Thursday, December 30, 2010

Emerging Economies Still Expected To See Strong Growth

Much is made of the fact that investors should allocate some of their investment portfolios to emerging market economies. This makes sense from the standpoint the emerging economies of the world have been experiencing stronger economic growth versus the developed economies.

From The Blog of HORAN Capital Advisors

From a cautionary perspective though, investors need to be aware of the strong returns already achieved in the emerging markets over the last ten years. From a performance perspective, the emerging markets' 10-year annualized returns are around 13% (MSCI Emerging Markets Index) versus the 10-year annualized return of the S&P 500 Index of around 1%.

On a prospective basis, the emerging economies are still expected to achieve economic growth rates that are higher than those of the developed economies. A recent article by T. Rowe Price, The Decade Ahead, highlights economic growth rates out through the end of 2020. Certainly a long time frame, but the graph to the right points to the opportunities in these emerging economies based on their projected growth rates.

At HORAN Capital Advisors, we do have an overweight to the emerging markets versus our baseline allocation. Also included in our investment philosophy is to invest in U.S. or foreign multinational companies that do, or intend to, derive a large part of their revenue from emerging market economies.

Lastly, on a shorter time frame, two years, GDP growth in the developed countries is expected to grow 3.5%. And GDP growth in the developing economies is projected to grow 25%% through 2012.

Before investors allocate investment funds to the emerging markets, they should conduct there own research. A number of the emerging countries are attempting to slow their faster growing economies by pursuing a tighter monetary policy. On a short term basis the tighter policy could reduce growth rates and have a short term negative impact on market returns.
From The Blog of HORAN Capital Advisors


Wednesday, December 29, 2010

Consumer Confidence, Consumer Sentiment and S&P 500 Index

Strategist tend to focus attention on consumer related data when attempting to forecast the future direction of the stock market. The consumer receives attention since he/she accounts for two-thirds of the data that goes into the GDP calculation. Because of this focus on the consumer, there are a number of different data points one can follow. On this blog we highlight the AAII sentiment survey data from time to time. Other sites have their own sentiment data. On the SentimenTrader site, they track a smart money/dumb money indicator. Technical Take has another version of sentiment.

Beyond these consumer oriented data points, more publicly reported data is reported by the Conference Board in its Consumer Confidence Index (CCI) and the University of Michigan's Consumer Sentiment Index (MCSI). The two surveys are similar, but have two differences investors should be aware of. The MCSI survey asks one less question about employment. This fact makes the Conference Board survey a better indicator of consumers' expectations about employment. But the MCSI survey's questions focus on consumer expectations one year ahead instead of six months for the CCI. The Michigan survey therefore attempts to predict economic conditions a full year into the future. For a more detailed discussion on these two indicators click here. It should be noted that the CCI is a component of the Composite Index of Leading Indicators. Having highlighted these two indicators, do they predict in any way the future direction of the stock market?

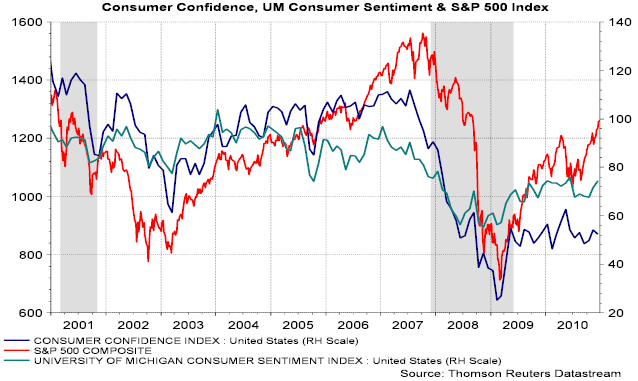
Earlier this week the Conference Board reported that the CCI came in at a lower than expected 52.5 versus expectations of 56.0. As the below chart shows, there does appear to be a positive correlation between the CCI, MCSI and the S&P 500 Index. From the graph perspective, one could argue which is the dependent variable.

From The Blog of HORAN Capital Advisors

As noted in a research paper by Sydney Ludvigson(PDF):
"...the evidence from in-sample regressions suggests that measures of consumer confidence—taken alone—have important predictive power for quarterly consumer expenditure growth...the results indicate that both the Michigan and Conference Board overall indexes have modest incremental forecasting power for total personal consumer expenditure growth."
Given the significance of the consumer as it relates to GDP, tracking these indexes can have important implications for investors. The recent below expected CCI result is worth watching near term. Although the trend is higher since the beginning of 2010, it is beginning to flatten out.


Monday, December 27, 2010

Dogs Of The Dow Update

One investment strategy that seems to get quite a bit of press is the "Dogs of the Dow" strategy. This strategy consists of selecting, after the close of business on the last trading day of the year, the ten stocks which have the highest dividend yield from the stocks in the Dow Jones Industrial Index. Once the ten stocks are determined, an investor would invest an equal dollar amount in each of the ten stocks. The strategy has had mixed results over the years.

With the year coming to an end, it does appear the 2010 Dow Dogs will outperform the Dow Jones Industrial Index. Additionally, the Dow Dogs are maintaining a narrow performance edge over the S&P 500 Index. On a price only basis, the YTD return for the S&P 500 Index is 12.77% and the S&P's total return equals 15.03%.

From The Blog of HORAN Capital Advisors

As of the market's close last Thursday, the below table contains the list of stocks that are in the running to make up the Dow Dogs list in 2011.

From The Blog of HORAN Capital Advisors


Sunday, December 26, 2010

Better Investing's Most Active December 2010

From time to time it is interesting to review Better Investing's most active stocks. The list is based on an informal sampling of Better Investing members. Readers can compare the below list to the list of stocks in May of this year and the list of stocks in November of 2009.


Friday, December 24, 2010

The Market After Bear Rallies

Over the last few weeks, the Chart of the Day service has presented several charts that reflect the market's performance subsequent to bear rallies. As they say a picture is worth a thousand words. Chart of the day notes in their first chart,

"...a 'massive' bear market is defined as a decline of greater than 50%. Since the Dow's inception in 1896, there have been only three bear markets whereby the Dow declined more than 50% (early 1930s, late 1930s until early 1940s, and during the very recent financial crisis). Today's chart also adds the rally that followed the dot-com bust during which the Nasdaq declined 78%. The current Dow rally has followed a path that is fairly similar to that of post-massive bear market rallies. The initial surge of the current rally lasted nearly 300 trading days and has been trading flat/choppy ever since. It is worth noting that the current rally just made new rally highs. However, both the 1932 Dow rally and the 2002 Nasdaq rally briefly made new highs during their flat/choppy phases. If the current rally were to continue to follow the post-massive bear market rally pattern, the current choppy phase would continue for another 150+ trading days (i.e. 7+ months)."
From The Blog of HORAN Capital Advisors

The x-axis in the above chart is presented in days; thus a shorter time frame than the chart below. In the below chart, for both the 2000 to present S&P 500 (blue line) and the 1929-1949 S&P 500 (gray line) have been normalized to where each of their peaks begin in year zero and at the $100 level. COTD notes,
"What is of interest is not that both of these markets had declines and rallies of equal magnitude -- they did not. What is of interest is that both bear markets have tended to head in the same direction for approximately the same amount of time. For example, both bear markets suffered through a major decline during the first 2 1/2 years and then rallied sharply into year seven. Both markets then formed a major peak in year seven and declined sharply in the middle of the eighth year. Both bear markets have continued to follow a similar path following the eighth year trough. However, if this similarity in direction were to continue, the current stock market rally would need to close out in fairly short order."
From The Blog of HORAN Capital Advisors

The question for many investors is what will be the future direction of the market as the 2010 year closes and we move into 2011?


Thursday, December 23, 2010

Bullish Investor Sentiment Increases 13 Points

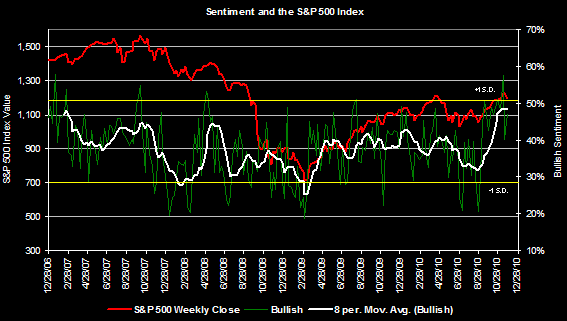
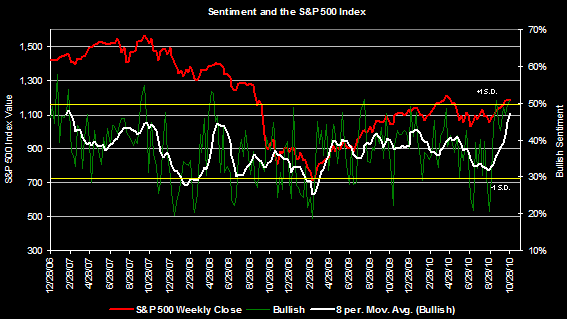
This week's release of the American Association of Individual Investors weekly sentiment survey shows bullish sentiment increased over 13 percentage points to 63.28%. This is the highest level the bullishiness reading has reached since November 18, 2004. Shortly after the November 2004 period, the 8-period moving average reached almost 57% and the market experienced a small correction of about 3%.

From The Blog of HORAN Capital Advisors

As regular reader of this blog know, the investor sentiment reading is a contrarian indicator. As a result increasingly higher bullishness readings are one factor to consider when evaluating whether or not the market is overbought. The 8-period moving average does smooth the volatility that is associated with the weekly sentiment figures.


Monday, December 20, 2010

Presidential Cycle and Bull Market Entering Year Three

In a few short weeks the presidential cycle will enter its third year and the market has been kind to investors at this point in the presidential cycle. As the below chart details, since 1945, the third year of a president's term has seen the S&P 500 Index rise an average of 17.1% and up years have occurred in 94% of those years.

From The Blog of HORAN Capital Advisors


S&P notes in the 2011 Outlook Forecast newsletter,
A rational for third-year outperformance, in our opinion, is stimulus anticipation. To stay in power, the president typically uses policies designed to stimulate the economy before voters go back to the polls in November of year four. Investors anticipate the benefit of this stimulus to economic growth, corporate earnings, and consumer confidence, and bid stocks higher in year three.
In addition to the third year of the presidential cycle, in March, the stock market would be entering the third year of a bull market. With this, the economy does seem to be gaining some strength with the Fed's second round of quatitative easing in place. Additionally, the tax package that was recently appoved by Congress will provide consumers with additional money to spend with the payroll tax being reduced by 2%.

From an investment perspective, trading activity does seem to indicate sector rotation is taking place. The below table outlines the performance of each sector in the S&P 500 along with the frequency of each sector's outperformance. The best performing sector has been energy followed by utilities.

From The Blog of HORAN Capital Advisors

Overall market action does seem to be on the side of higher prices. From a contrarian perspective though, most investment strategists are forecasting higher stock prices for 2011. When everyone is in agreement on the same trend, this does raise a yellow flag. At HORAN we continue to like the valuations of higher quality large capitalization stocks. We also believe emerging markets, and those companies selling into the emerging markets, will provide better returns in 2011.

Source:

2011 Annual Forecast
The Outlook
Standard & Poor's
December 22, 2010
http://www.outlook.standardandpoors.com/NASApp/NetAdvantage/servlet/login?url=/NASApp/NetAdvantage/index.do


Thursday, December 16, 2010

Dividend Aristocrat Changes For 2011

After the market close on Friday, December 17th, Standard & Poor's has announced the following changes will be made to the Dividend Aristocrats for 2011.

From The Blog of HORAN Capital Advisors

Following is the list of the companies that will comprise the Aristocrats for 2011. The new additions are highlighted in green and those being removed from the Aristocrats list are highlighted in yellow.


Tuesday, December 14, 2010

The Vix And S&P 500 Indices

As the below chart shows, the fear index, or VIX, has declined to just above 17% versus 80% in October of 2008. In the recent past, a low level on the VIX has been indicative of a top in the market. However, when looking at the 2008 time period, the VIX has declined to the 10% range.

If the market can form a base around the 1,220 level on the S&P 500 Index, this would be constructive for further advances in the market on a prospective basis. The 1,220 level would support the break out level of the cup and handle chart formation as discussed in yesterday's post.

From The Blog of HORAN Capital Advisors


Monday, December 13, 2010

S&P Cup & Handle Breakout

Recent price action for the S&P 500 Index has the chart pattern resembling a cup and handle breakout. Additionally, the breakout from the handle does appear it has occurred on increased volume.

From The Blog of HORAN Capital Advisors

The market's recent advance has certainly been a strong one. Some consolidation of these gains would not be unexpected; however, from a technical perspective, the market seems to want to move higher.


Consumer And Corporate Balance Sheets Improving

Several factors have contributed to the slower than average growth in GDP in this recovery from the recession. Aside from the high rate of unemployment and the bursting of the housing bubble, individuals and companies are focused on improving their balance sheets.

As the below chart details, individuals continue to reduce their leverage. The slight up tick in leverage, based on the latest print, could be supportive of the recent improvement in consumer sentiment that I reported yesterday. This is equally impressive given the contraction in the value of home prices that would contribute to a higher leverage ratio.

From The Blog of HORAN Capital Advisors

Coinciding with this improvement in individual leverage is the fact individuals have stepped up their level of savings.

From The Blog of HORAN Capital Advisors

Lastly, nonfinancial companies continue to increase the level of liquid assets. Assuming there is more clarity on policy coming out of Washington, this cash may be put to use in higher dividend distributions, stock buybacks and even increased acquisition activity.

From The Blog of HORAN Capital Advisors

All of this would be supportive of higher stock prices. The risk at the moment is the market has been on an essentially uninterrupted uptrend since the end of August.

From The Blog of HORAN Capital Advisors

Last week the market (S&P 500 Index) broke through a double top. If the market can successfully test this level and turn this former resistance into support, further market advances are likely.

Source:

The Balance Sheet Recovery
Economic Trends
Federal Reserve Bank of Cleveland
By: Tim Bianco and Filippo Occhino
December 12, 2010
http://www.clevelandfed.org/research/trends/2010/1210/01gropro.cfm


Sunday, December 12, 2010

Consumer Sentiment Continues To Improve

The University of Michigan's consumer sentiment report continues to show improvement. Last week's preliminary sentiment report for December increased to 74.2, exceeding expectations by 1.7 points. Consumer sentiment tends to lead the market by several months; thus, continued improvement in sentiment could be positive for the market. If consumers remain more optimistic, this is likely to have a positive impact on the personal consumption component of GDP.

From The Blog of HORAN Capital Advisors


Monday, December 06, 2010

Investors May Be Growing Wary of Bonds

As the below chart shows, investors continued to favor bonds over equities as of October 15, 2010.

From The Blog of HORAN Capital Advisors

In November though, fund flows for bond investments turned negative.
From The Blog of HORAN Capital Advisors
One type of bond investment that actually performed well in November was bank loan investments. In November, the broader category of bank loan investments did generate a positive return. Bank loan investments have floating rates and have historically delivered positive returns in rising interest rate environments as noted in the chart below.
From The Blog of HORAN Capital Advisors
Disclosure: HORAN Capital Advisors has a position in a bank loan investment for its clients.


Wednesday, December 01, 2010

Dividend Payers Outperforming Non Payers Through November

For the first eleven months of the year, on an equally weighted basis, the dividend payers in the S&P 500 Index are outperforming the non payers, 10.60% versus 8.91%, respectively. For the month of November the payers did underperform the non payers by 21 basis points, .79% versus 1.00%.

From The Blog of HORAN Capital Advisors


Sunday, November 28, 2010

The Consequences Of A Breakup In The Eurozone

One aspect of the problems impacting a number of the Eurozone countries is the fact these issues were not addressed in the formation of the Euro. A recent article in the Telegraph notes, in 1990, Commission economists advised the EMU some of the issues facing the EMU today needed to be addressed before implementation of a single currency. According to the Telegraph,
"[the EMU] was told too that currency unions do not eliminate risk: they merely switch it from currency risk to default risk. For that reason it was all the more important to have a workable mechanism for sovereign defaults and bondholder haircuts in place from the beginning, with clear rules to establish the proper pricing of that risk. But no, the EU masters would hear none of it. There could be no defaults, and no preparations were made or even permitted for such an entirely predictable outcome..."
An article in the Financial Times, Investors Must Try To Predict German Politics (registration required), provides some thought on potential outcomes if there is a breakup of the Euro.
"A sovereign debt crisis will naturally affect equities. Banks hold their governments’ bonds on the assumption they are virtually risk-free. Any change to that assumption could drastically worsen their financial position. A devaluation to the currency would reduce the value of companies’ domestic earnings to foreign investors and make it harder for them to finance foreign debt.

But it is startling to see the extent of the pain that international stock markets think eurozone-based companies must endure. According to MSCI indices, developed world stocks outside the eurozone are up 7.22 per cent. European stocks outside the eurozone are up 4.45 per cent. And yet eurozone stocks themselves are down 9.82 per cent. Even within the eurozone, there is a stark division. Germany’s stocks are up a decent 4.4 per cent, according to MSCI. All the zone’s other big markets are down terribly. It is not surprising that Spain or Greece are down – but note that France has fallen 8.5 per cent and Italy 19 per cent. This implies extreme bearishness about the prospects for everyone in the eurozone, bar Germany."
In the Guardian, the Dutch bank Ing, opines that a breakup would be far worse than the issues dealt with in the bankruptcy of Lehman Brothers.
"In a bleak assessment, entitled "quantifying the unthinkable", they warn that in the first year alone, so by the start of 2012, output would fall between 5% and 9% across various member states, while their new national currencies would fall by 50%....

On the basis of a euro break-up by the end of 2010, he warned: "In 2011 a deep recession across the eurozone emerges, dragging down the global economy. In the eurozone output falls range from -4% in Germany to -9% in Greece".

But he notes neighbouring European economies are also caught up in the chill, with GDP falling 3% in the UK and 5% in central and eastern Europe.

"While the US would be less adversely affected, the combination of lower global growth and a strongly appreciating US dollar would see it flirting with outright recession in 2011," Cliffe added."
Lastly, in a paper commissioned by European Parliament's Committee on Economic and Monetary Affairs, a number of proposals are put forth to address the issues in the Eurozone. Much of what is addressed are guidelines that should have been put in place prior to the introduction of the Euro. I suppose better late than never. The document does address the consequences of removing members from the EMU: primarily the contagion that might follow.

At the end of the day it seems Germany is being asked to finance the profligate ways of some of the smaller European countries. Does Germany have the desire to keep the Eurozone together at the potential expense of its own financial stability? A number of difficult decisions need to be made by countries on both sides of these issues. These issues will be more difficult than determining a European standard for electrical plugs.


Friday, November 26, 2010

Eurozone: Living Beyond Its Means And Implications For U.S.

If the U.S. looks at the issues facing a number of the Euro Zone countries, it is not too much of a stretch to say the U.S. could go down that same path. Certainly the U.S. economy is more diversified than those of the coutries that are encountering financing issues. However, much of what is occurring in a number of the Euro Zone countries is a result of countries living far beyond their means. In the U.S. we seem to be going down that same path. Recent government policies and entitlement growth are creating a situation where the public sector is absorbing more of the financial burden versus the private sector. Not only is there a large burden (that is, budget deficit) at the federal level, nearly every state in the U.S. is dealing with significant budget deficit issues. As the below chart shows, the U.S.budget deficit as a % of GDP and gross debt as a % of GDP is pretty close to some of the Euro Zone countries that have encountered financial difficulties.

Recent articles in the Wall Street Journal address some of the issues impacting Spain. The first article, Spain: A Quick By The Numbers, notes the folowing financial characteristics of that country. As the above chart shows, the U.S. debt and deficit is worse than Spain's. Additionally, the U-6 unemployment rate for October is 17% and not much better than Spain's.
  • The fourth-largest economy in the euro zone.
  • Deficit-to-GDP in 2009: 11.1% (Ireland is 14.4%. Greece is 15.4%)
  • Government spending as a percentage of GDP: 45.8%.
  • Government debt-to-GDP: 53.2%.
  • Unemployment rate: 19.8% in the third quarter. That is more than twice the European Union average, although the figure is down slightly from 20.9% in the second quarter.
The other article, Spain: What Are Its Funding Needs?, provides details on the magnitude of the debt that will be rolling over in Spain. The article concludes, and we agree, that these issues will be headline material in the financial press and thus impact market volatility for the near term.


Updated: November 27, 2010. Next Debt Crisis May Start in Washington: Bair


Thursday, November 25, 2010

David Einhorn Interview On WealthTrack

Consuelo Mack of WealthTrack interviews hedge fund manager David Einhorn of Greenlight Capital. Einhorn rarely gives television interviews; however, he sits down with Consuelo Mack and provides his insight into what he sees occurring with financials, gold and various other investments. In this interview Einhorn discusses the rational behind some of his current long and short positions. Einhorn correctly called the precarious condition of financial firms from Allied Capital to Lehman Brothers and the financial system as a whole.


Investor Sentiment And Fund Flows

Two weeks ago bullish investor sentiment was reported at its highest level of the year coming in at 57.56%. At the same time the S&P 500 Index hit is yearly high of 1,225. In the following week the bullish sentiment level fell over 17 percentage points to 40% and the market has trended lower since this time. In the latest week the bullish sentiment level has ticked higher to 47.4% with the market trading pretty much in a volatile range.

From The Blog of HORAN Capital Advisors
This market volatility seems to be resulting in investors having uncertainty about investing in equities. The below chart shows investors continue to pour money into bond mutual funds at the expense of equity mutual funds. The chart captures data through mid September and the subsequent table contains weekly data for November.

From The Blog of HORAN Capital Advisors

From The Blog of HORAN Capital Advisors
Table Data Source: ICI

As noted in several earlier posts, one on the recent move in interest rates and the other on potential inflation, investors in long term bonds are taking on duration risk that is likely to result in poor bond returns.


Wednesday, November 24, 2010

More Evidence Of Inflation In The System

One area that is providing a hint that inflation seems set to increase is the change in commodity prices. As the below table shows, many commodity prices have seen significant increases over the past year.

From The Blog of HORAN Capital Advisors

Aside from investors allocating a portion of their portfolio in inflation protected assets like TIPS or commodities themselves, certain companies can benefit from these higher commodity prices. The key is the company needs to have the ability to pass on these higher cost to its customers.

Those companies that are in the beginning or intermediate stage of the production cycle have the best opportunity to pass along these higher costs. Those companies that sell to individual consumers are having the most difficulty in passing along these higher prices though. A recent Thomson Reuters report highlights several comments from recent company earnings reports.
“As anticipated, our first quarter operating income came in below the prior-year period. We see our price increases coming through across the board, but in the first quarter they still lagged sharply increasing commodity prices. We are confident that the additional price increases we have announced will mitigate commodity inflation for the full year. We also continue to execute against our capital plans with further share repurchases and the successful refinancing of $800 million of debt at an attractive rate in the first quarter.”
- Sara Lee Corp. (Nov 9. 2010)

“Commodity costs are now expected to have an unfavorable impact on EPS of approximately $0.08 to $0.10, attributable primarily to higher coffee costs. The company’s EPS expectation noted above reflects the impact of higher commodity costs.”
- Starbucks (Nov 4, 2010)

"Our long-term perspective in managing our business is backed by a strong financial position that provides the ability and flexibility to capitalize on opportunities that support our strategy," added Richard Smucker, Executive Chairman and Co-Chief Executive Officer. "As we look ahead, we anticipate that marketplace dynamics, including escalating commodity costs, will continue to present challenges. However, we are confident in the ability of our team to execute our strategy and address these obstacles."
- J. M. Smucker Company (Nov 18, 2010)

“The outlook for nitrogen and phosphate fertilizers is very favorable. Historically high grain prices and low grain stocks support high planting expectations and optimal fertilization practices.”
- CF Industries Holdings (Nov 4, 2010)

“Sales revenue for third quarter 2010 was $1.7 billion, a 29 percent increase compared with third quarter 2009 primarily due to higher sales volume and higher selling prices. The higher sales volume was attributed primarily to improved end-use demand in packaging, durable goods, and other markets and the positive impact of growth initiatives. The increase in selling prices was in response to higher raw material and energy costs.
- Eastman Chemical (Oct 28, 2010)


Monday, November 22, 2010

Higher Income Consumers Seem To Be Spending Again

Recent same store sales data seems to suggest high end consumers are opening their wallets and spending again. Recent same-store sales were up 9.5% at Neiman Marcus, Saks reported an 8.1% increase and Nordstrom same store sales were up 3.4%. The mid tier stores actually saw a decline with Kohl’s declining 2.5% and J. C. Penney Co. down 1.9%. The results at high end retailers does seem to be a sign that the higher income consumer is spending again after cutting back purchases during the middle of the recession.

Consumer confidence is not only driven by the level of employment but also by the level of the stock market. The latest release of the unemployment data shows the unemployment rate for individuals with at least a bachelor’s degree is 4.7% which is down from a 5% peak earlier this year. This unemployment rate is half the national average.

From The Blog of HORAN Capital Advisors

H/T: Argus Research


High Quality Stocks Are Cheap Based On Free Cash Flow

The below chart shows companies’ free cash flows (excluding financials and utilities) compared to BAA corporate bond yields. The ratio is the highest seen in the last 50 years. It is free cash flow that pays investors and one reason we take a hard look at a company's cash flow statement and dividend practices.

From The Blog of HORAN Capital Advisors
Source: Fidelity


Saturday, November 20, 2010

Higher Tax Rates And Performance Of Dividend Payers Versus Non Payers

As the end of 2010 is fast approaching, it appears Congress is having difficulty deciding how to handle the expiration of the Bush era tax cuts. If the Bush era tax structure expires, a whole host of tax increases will be thrust upon nearly all tax payers. One tax that will be impacted is the tax rate on dividends will increase.

From a performance perspective, higher taxes on dividends does not necessarily translate into the stocks of dividend payers underperforming the non payers. A recent Reuters article, Tax Changes Won't Kill Dividend Trend, highlights where Allianz reviewed tax rates from 1972 to the present, identified nine distinct time 'regimes', and found dividend-paying stocks outperformed nondividend-paying stocks in all but one period: 1987 (see below chart.)

From The Blog of HORAN Capital Advisors

If tax rates do increase, the current high level of cash on corporate balance sheets could lead these firms to institute special dividends before year end.

From The Blog of HORAN Capital Advisors
Source: PIMCO

Wynn Resorts (WYNN) recently announced an $8 per share special dividend and Progressive Corp. (PGR) announced a $1 per share special dividend. More firms may follow this lead before the end of 2010.

Given the fact firms that have consistently paid a growing dividend tend to exhibit strong fundamentals, if a higher dividend tax rate is realized, the performance of these firms is still likely to be good. The current low rates on fixed income investments is also making dividend paying stocks look attractive on a relative basis.


Friday, November 19, 2010

Dividends Matter And More So During Inflationary Periods

As noted in a number of earlier posts, at HORAN Capital Advisors, we use the dividend paying actions of companies as one way to evaluate a company's future growth expectations. In some ways, the dividend actions by companies provide investors with insight into management and the board's expectations of a company's future earnings prospects. This valuation methodology is what led to using the "dividend discount model" as a way to value companies. Importantly, the DDM can further be used to relate the value of a stock to a company's fundamentals.

Generally, companies do not want to reduce or slow their dividend growth rates as investors in these types of companies have come to expect a certain level of dividend growth or income growth. If the growth rate slows or other financial ratios begin to trend in the wrong direction due to a company's desire to maintain a certain dividend growth rate, this provides investors with important insight into the future return potential for a stock.

Additionally, as noted in a recent research report by Fidelity's Market Analysis, Research & Education group, dividends are a critical component of a stock's overall return. The opening paragraph of the report notes,
"Companies that regularly return some of their profits to shareholders in the form of stock dividend payments are predominantly mature businesses that have steady cash flows, relatively stable profit outlooks, and lower operational risk on average than non-dividend-paying companies. These characteristics generally have led to less share price volatility for dividend-paying companies compared to the broader market. Typically, a company does not start paying stock dividends unless it is confident it can continue to generate enough earnings to distribute dividends on a regular basis going forward. The primary reason: cutting a dividend may be interpreted by investors as a negative statement about the company’s profit outlook, which may result in a decline in the company’s stock price."
One aspect of the current actions by the Federal Reserve, specifically, round two of quantitative easing (QE2), concerns us at HORAN in that it is likely to fuel inflation at some point in the not too distant future. In an inflationary environment though, stocks actually perform okay when looking at the entire inflation cycle. Our post titled Where To Invest In An Inflationary Environment addresses this point.

The Fidelity report also notes during the period 1974 - 1980, the rate of inflation was 9.3%. During this time period the return on the S&P 500 Index averaged an annual rate of return of 9.9%. The dividend component of this return (4.9 percentage points) accounted for nearly one half of the overall return as can be seen in the below chart.

From The Blog of HORAN Capital Advisors

In conclusion, certainly, the level of dividends paid by companies have declined in recent decades; however, this decline seems to be reversing at the moment. More importantly, dividends continue to represent a critical component of the total return on stocks. And when, not if, we see inflation increase, this inflationary impact will be more favorable for stocks than for fixed rate bonds.

From The Blog of HORAN Capital Advisors

Source:

Realizing the Impact of Stock Dividends (PDF)
MARE
Fidelity Management &Research Company
November 12, 2010
http://personal.fidelity.com/products/funds/content/pdf/realizing-the-impact-of-stock-dividends.pdf


Tuesday, November 16, 2010

Interest Rates On The Rise

In spite of the Fed's QE2 program and desire to push down interest rates, the longer end of the curve is seeing a big jump in yield. The first chart below displays the price action of the iShare 20-year Treasury Bond (TLT). The price of TLT has declined from a high of over 108 down to yesterday's close of 94. This represents a 13% price decline. The yield moves in the opposite direction of price and the second chart displays the change in yield of the 20-year Treasury. At the end of August the yield on the 20-year treasury stood at 3.23% and closed yesterday at 4.01%. This represents a 24% rise in the yield.

From The Blog of HORAN Capital Advisors

From The Blog of HORAN Capital Advisors


Saturday, November 13, 2010

S&P 500 Index Share Weighted 3Q Earnings Spike Higher

Year over year 3Q earnings for the S&P 500 Index continue to show positive progress. Of the 456 companies that have reported out of the 500 companies in the index, share weighted earnings in Q3 2009 totaled $154.6 billion versus Q3 2010 earnings of $202 billion or a 31% YOY increase.

From The Blog of HORAN Capital Advisors

Revenue growth on a YOY basis is 8%. The sectors with the highest revenue growth rate are: Technology (+20%), Materials (+17%) and Energy (+16%). The only sector showing negative revenue growth is the Financial sector (-2%). From an earnings perspective though, financials are reporting a YOY increase of +94%. Obviously financials are reporting fewer charges.


Thursday, November 11, 2010

Earnings In Third Quarter Better Than Expectations

Over the past six quarters, Thomson Reuters notes 75% of S&P 500 companies have reported earnings above the mean analyst estimate. Additionally, during these six quarterly periods, the average negative to positive surprise is 1.2. This level is below the long term average N/P ratio of 2.0. However, in Q3 of this year, the N/P ratio did increase to 1.8., but still remains below the previously noted long term average.

From The Blog of HORAN Capital Advisors

It is apparent company earnings continue to be better than analyst expectations. At HORAN Capital Advisors, we do believe this positive trend in earnings will continue through the fourth quarter and into 2011 as well. This positive earnings picture, and the fact we have a second round of quantitative easing in process, should provide for a positive stock environment in 2011.


Wednesday, November 10, 2010

Should More Focus Be Placed On Public Sector Pay?

An interesting article appears in USA Today showing the number of Federal workers earning more than $150,000 has increased tenfold since 2005. It is the private sector that ends up paying these wages. This rate of growth in public sector compensation is unsustainable.

From The Blog of HORAN Capital Advisors

The article notes:
  • The Defense Department had nine civilians earning $170,000 or more in 2005, 214 when Obama took office and 994 in June.
  • The biggest pay hikes have gone to employees who have been with the government for 15 to 24 years. Since 2005, average salaries for this group climbed 25% compared with a 9% inflation rate.
  • Federal workers earning $150,000 or more make up 3.9% of the workforce, up from 0.4% in 2005.


Tuesday, November 09, 2010

Wholesale Inventory Growth Exceeds Expectations

Today it was reported that wholesale inventories rose 1.5% which was higher than the consensus estimate of a .6% rise. Briefing.com notes, "wholesale sales rose 0.4% in September after increasing 0.5% in August. The gains suggest that the growth in inventories was planned and not the result of shoppers leaving more goods on the shelves." Although sales did rise, they did not keep pace with inventory growth.

The inventory growth for August was revised higher to 1.2% versus the originally reported level of .8%. This revision was not expected and will result in a higher upward revision to GDP for Q3 at the expense of a downward revision in 4Q GDP. The resulting inventory to sales ratio increased to 1.18 versus 1.17 in the prior period. Although the I/S ratio did rise, it is in line with the average I/S ratio from 2003 - 2008.

From The Blog of HORAN Capital Advisors


Monday, November 01, 2010

Dividend Payers Maintain Performance Edge Through October

Given the roller coaster the market has been on over the course of the past four or so months, it has been an environment that favors higher quality companies. It is the higher quality companies that exhibit strong cash flow and/or dividend payments that tend to hold up better in down market environments.

Through October, the average return of the dividend payers in the S&P 500 Index are outperforming the non-payers, 9.73% versus 7.83%, respectively. The payers are also outperforming the weighted S&P 500 Index return of 6.11% on a year to date basis.


Saturday, October 30, 2010

Most Of Market's Gains Occur From November Through April

In general most of the gains on the S&P 500 Index ($SPX) occur in the period from November through April. This is one reason technical analyst indicate investors sell their equity holdings in May, i.e., "sell in May and go away until November." As Chart of the Day notes:
"...investing in the S&P 500 from the last trading day in October (therefore referred to as the Halloween indicator) through the end of April accounted for the vast majority of S&P 500 gains since 1950. While there are some noteworthy periods during which the Halloween indicator didn't produce (e.g. during the oil embargo of 1973-74, the dot-com bust of 2000-01, and the financial meltdown of 2007-2009), the overall out performance is compelling."
From The Blog of HORAN Capital Advisors


Gridlock In Washington And The Market's Performance

If one believes history has a way of repeating itself or at least looking similar, investors might hope that the Republicans gain control of the Senate as well as the House next Tuesday. We have noted on page 4 of this link that the third year of a presidents term in office tends to be the strongest from a stock market perspective; however, this might hinge on the makeup of Congress.

Many prognosticators are already projecting control of the House of Representatives will swing to the Republicans. The prediction website, Intrade, is showing that the odds of the Republicans taking control of the House has increased to nearly 92% versus under 20% at the beginning of 2009.

From The Blog of HORAN Capital Advisors
Source: Intrade

Additionally, Ireland's largest bookie, Paddy Power, has paid gamblers early that bet the House would go Republican noting "there would be nothing short of a miracle for the Democrats to maintain control of the House."

As the below table shows, in an environment where control of Congress is split between Republicans and Democrats, and the presidential party is Democratic, the market's performance has been its worst since 1900. In an environment where the Republicans control both Houses of Congress and there is a democratic president, historically, this has been an environment where the market generates some of its best returns.

From The Blog of HORAN Capital Advisors

S&P surmises that one reason the market does not perform well when Congress is split is due to the fact the market's do not like uncertainty. With a split Congress there does tend to be less accomplished in Washington. One thing seems certain at this time and that is the country needs to get control of the spending coming out of Washington. This will require some difficult decisions to be made in Washington in the coming year and a split Congress might prevent the hard decisions from being made.


Thursday, October 28, 2010

A Few Things On Our Mind In This Market Environment

By and large we have been positive on the markets since mid summer as our prior posts and newsletters have noted. A number of factors contributed to our positive market bias including attractive large cap stock valuations and our belief the economy was/is not going into a double dip recession. Since July of this year, the S&P 500 Index is up 15+% with most of the gain coming since the beginning of September. From September 1st through the close today, the S&P is up 10.8%. It is not reasonable to think the market can move higher by 10+% every two months. The market may not move higher by 10% every two months, but it seems individual stocks like Apple (AAPL) are trying.

So what is on our mind at this point in time as we evaluate the future direction of the market?
  • Mutual fund flows have seen strong flows into fixed income/bond funds over the last three years while at the same time investors have withdrawn funds from equity mutual funds. However, over the last two weeks, equity funds are finally experiencing positive in flows. primarily international equities. The question then is whether investors are now beginning to buy bequonds near a top?

From The Blog of HORAN Capital Advisors

Source:ICI
  • Individual investor sentiment as reported by the American Association of Individual Investors indicates bullish sentiment is beginning to move in to an overly bullish zone. Bullish investor sentiment has increased from 24.68% at the beginning of July to 51.23% reported this week. The long term average for the bullishness level is 39% with an 11% standard deviation. The bull/bear spread stands at 30% and has been as high as 75%.

From The Blog of HORAN Capital Advisors

  • As our third quarter newsletter touched on, market sentiment resulting from a change of control in congress seems to be weighing positively on the market as well. The question then becomes, how much of a potential Republican majority is factored into current stock prices. What are the market implications if the outcome is not as expected. As many investors know, the markets trade on expectations and surprises can be market moving.
At the end of the day, we believe investors need to focus on fundamentals and valuations at this point in time. One could say this should always be the case and they would be right. However, there are times when the market favors momentum based stocks and pushes them higher regardless of valuation.
The markets have a lot to digest over the next several months:
  • election outcome
  • expiration of the Bush tax cuts: higher taxes for consumers while consumer spending accounts for 70% of GDP.
  • impact of a lame duck Congress


Wednesday, October 27, 2010

Smart Money Anticipating Higher Interest Rates?

Yesterday, Goldman Sachs (GS) issued a 50-year corporate bond with a coupon yield of 6.125%. Due to the strong investor demand the issued amount was increased from the originally anticipated $250 million. I would say Goldman is expecting higher interest rates in the not too distant future.

From The Blog of HORAN Capital Advisors
Source: Reuters


Tuesday, October 19, 2010

S&P 500 Index Forms Inverted Head & Shoulders Stock Chart Pattern

Over time fundamental factors will determine the longer term direction of stocks and the stock market. On a short term basis though, technical factors can lead to self fulfilling outcomes as enough investors do trade on technical market data.

The recent price action of the market has resulted in the S&P 500 index's chart pattern to resemble an inverted head and shoulders. This pattern tends to be a bullish indicator for future market advances. With the inverted pattern though, volume tends to be a more critical element in determining whether the pattern's anticipated outcome is achieved. As the below chart does show, both the left and right shoulder have been formed on each side of the head pattern. What appears to be missing is the volume on the right shoulder formation.

From The Blog of HORAN Capital Advisors
Upside resistance for the market is around 1,218. Additionally, the 50 day moving average is getting close to crossing the 200 day moving average from below. This cross is know as the golden cross and can be an indication of further market advances as well. Investors should keep in mind that the golden cross and death cross indicators have mixed predictive results.

Lastly, we are approaching the third term of the presidential cycle and the third year of the cycle tends to be one in which the market has its best performance. We highlighted some of the election data in our third quarter newsletter. In addition to the election cycle, we are entering the buy period in the "sell in May and Go Away" seasonal indicator. This indicator suggests selling stocks in May and re-buying them in November. Below is a chart from an earlier post I wrote at the beginning of May this year, The Beginning of May and the Market.

From The Blog of HORAN Capital Advisors
Given the market's strong advance since the end of August a little market consolidation, like experienced today, is to be expected.


Sunday, October 17, 2010

Third Quarter Investor Insight Newsletter

The S&P 500 Index ended up 8.9% for September and 11.3% for the third quarter. It was the market's best September since 1939. Ironically, this strong quarter was achieved in the face of mixed fundamental data. The Philadelphia Fed reported in August that 36 forecasters now see the economy looking less favorable than they thought just three months prior.

Third quarter GDP has been revised down to 2.3% from 3.3% (the second quarter was also revised down from 2.4% to 1.6%) and most economists agree the labor market shows little to no signs of improvement. One might assume historically low mortgage rates would stimulate the housing market but, in fact, housing inventories continue to rise and consumers continue to save and reduce debt. As an important aside, consumer spending accounts for 2/3 of the economy. However, we suspect economic data has presented just enough hope that a double dip recession is unlikely, hence, the bullish quarter.

View the complete Quarterly Investor Letter with market insights.

More information on HORAN Capital Advisors can be found at www.horancapitaladvisors.com.


Retail Sales Higher In September and Inventory To Sales Higher

The U.S. Census Bureau reported advanced retail sales figures for September this past Friday. The preliminary results show retail sales rose .6% for the month while at the same time, the August sales figures were revised higher to +.7% from +.4%. Sales did get a lift from an increase in the automobile sales category; however, sales ex auto were still up +.4%.

Also business inventories and sales were reported on Friday. The total business inventories/sales ratio at the end of August was 1.27 which is lower than the August 2009 ratio of 1.31.

From The Blog of HORAN Capital Advisors

Core CPI remains flat and will give the Fed justification for more quantitative easing (QE2) in an effort to stimulate stronger economic growth at the expensive of higher inflation. QE has consequences as well.

In short, with the continued reporting of mixed economic data, one thing seems certain and that is economic growth is not occurring at a blistering pace. On the other hand, a double dip recession seems fairly remote at this point in time. Throw in the fact the U.S. has a mid term election in November, the election outcome could impact consumer confidence and future economic growth. The recent positive returns in the equity markets might be discounting this outcome though.