Thursday, October 30, 2008

TARP And Dividend Growth

There are a large number of parameters that are a part of the Treasury's TARP (Troubled Asset Relief Program). One of the aspect of the plan financial investors will want to watch is the dividend increase stipulation. One of the TARP parameters requires institutions that accept TARP funds to obtain the Treasury's approval before any increase in a company's common stock dividend until the third anniversary of the date the treasury invests in the firm. Additionally, the treasury's approval is required before any share repurchases.

A few other TARP parameters:
  • The senior preferred shares will pay a cumulative dividend of 5% annually for the first 5 years and will reset to 9% per year after year 5. These shares will be non-voting.
  • The senior preferred shares are callable at par after 3 years.
  • Prior to the end of 3 years, the shares may be redeemed with the proceeds from a qualifying equity off erring of any tier 1 perpetual preferred or common stock.
  • The Treasury will receive warrants to purchase common stock at an aggregate market price equal to 15% of the senior preferred investment. The exercise price on the warrants will be the market price of the participating institutions common stock at the time of issuance (calculated on a 20-trading day trailing average).
Source:

Treasury Announces TARP Capital Purchase Program Description
U.S. Department of the Treasury
October 14, 2008
http://www.treas.gov/press/releases/hp1207.htm


Wednesday, October 29, 2008

Vectren Increases Dividend 3%

Today Vectren (VCC) announced a 3.08% increase in the company's quarterly dividend. VVC is one of Standard & Poor's S&P 1500 companies that has increased its dividend each year for at least the last ten years. In fact, this is the 49th consecutive year Vectren has increased its dividend.

The new quarterly dividend increases to 33.5 cents per share versus 32.5 cents per share in the same quarter last year. The company's 5-year average dividend payout ratio is approximately 67%. The projected payout ratio on the new dividend is approximately 64% based on 2009 estimated earnings per share of $2.09. The company's S&P Earnings & Dividend Ranking is B+.

(click for larger image)

Vectren dividend analysis table October 29, 2008
Vectren stock chart October 29, 2008


Tuesday, October 28, 2008

Suntrust Reduces Dividend

Yesterday, Suntrust (STI) cut its quarterly dividend 29.9%. The new quarterly rate will equal 54 cents per share versus 77 cents per share in the same quarter last year. At the time of the announcement, the company stated it has received preliminary approval from the U.S. Treasury for the sale of $3.5 billion in preferred stock and related warrants to the U.S. Treasury under the Capital Purchase Program of the Emergency Economic Stabilization Act of 2008.

(click for larger image)

Suntrust dividend analysis table October 28, 2008
Suntrust stock chart October 28, 2008


Monday, October 27, 2008

Income Tax Uncertainty Weighing On Market

Many factors are weighing on the stock market. One of the factors likely impacting the markets is the potential drag Barack Obama's tax plan would have on businesses and U.S. investors.

(click table for larger image)

McCain Obama tax plan comparison
  • Mr. Obama would roll back the 2001 and 2003 tax cuts for taxpayers in the top two brackets, raising the top two marginal rates of income tax to 36% and 39.6% from 33% and 35%. The 33% rate begins to hit this year at incomes of $164,550 for an individual and $200,300 for joint filers.
  • If you're an individual with taxable income of $164,550, you will pay more taxes.
Particularly of concern is Mr. Obama's desire to eliminate the cap on payroll taxes. This has negative consequences for small business and it is small business that create most new jobs in the U.S.
  • Mr. Obama's most dramatic departure from current tax policy is his promise to lift the cap on income on which the Social Security payroll tax is applied.... it's unclear if that higher rate would apply to the employee, the employer, or both.
If Mr. Obama's plan is instituted as proposed, a further slowing of the U.S. economy is likely. A slowing U.S. will have implications for global markets as well.

Updated: 9:50AM:

And this additional concern with respect to wealth redistribution.


Source:

The Election Choice: Taxes
The Wall Street Journal
By: Brian M. Carney
October 25, 2008
http://online.wsj.com/article/SB122488938501868507.html?mod=todays_us_opinion


Sunday, October 26, 2008

What Is The VIX Index

(I originally posted an article on the VIX Index on The DIV-Net website on October 19, 2008)

One market indicator that has been getting a lot of attention lately is the VIX Index (VIX). The VIX has been in the news lately since the Index has been hitting all time high levels, reaching over 89 on Friday (10/24/2008). The importance of the VIX has to do with the fact it is a measure of investor fear looking forward over the subsequent 30 day period.

(click chart for larger image)

VIX Index chart October 24, 2008

According to the CBOE,

since the VIX Index introduction in 1993, VIX has been considered by many to be the world’s premier barometer of investor sentiment and market volatility. The VIX Index is an implied volatility index that measures the market’s expectation of 30-day S&P 500® volatility implicit in the prices of near-term S&P 500 options. VIX is quoted in percentage points, just like the standard deviation of a rate of return.

Additionally, one of the most interesting features of VIX, and the reason it has been called the “investor fear gauge,” is that, historically, VIX hits its highest levels during times of financial turmoil and investor fear. As markets recover and investor fear subsides, VIX levels tend to drop. This effect can be seen in the below chart in the VIX behavior isolated during the Long Term Capital Management and Russian Debt Crises in 1998.

(click chart for larger image)

VIX Index chart at prior economic crisis points

An important historical aspect of the VIX is it tends to reach high levels at market bottoms. Could the current high level be signaling a market turning point looking forward. Last week's 4.7% market advance is certainly a start.

Source:

VIX (pdf)
CBOE Volatility Index White Paper
http://www.cboe.com/micro/vix/vixwhite.pdf


Saturday, October 25, 2008

Aflac Announces 16% Increase In Dividend

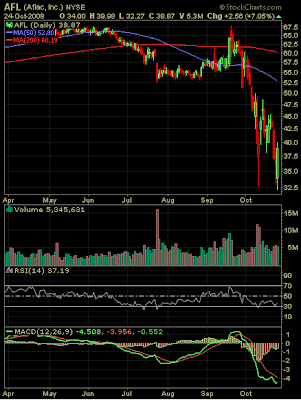
Earlier this week Aflac (AFL) announced a 16.67% increase in the company's first quarter 2009 dividend. The new quarterly dividend will equal 28 cents per share versus 24 cents per share in the first quarter 2008. The estimated payout ratio on the new dividend is approximately 25%. This compares to the five year average payout ratio of 19%. The company carries a S&P Earnings and Dividend Quality Ranking of A.

The company's third quarter earnings indicated net income fell to $100 million, or 21 cents a share, from $420 million, or 85 cents a share, in the third quarter of 2007. About $198 million of the after-tax investment losses in the quarter partly stems from the company's decision to sell its holdings in Lehman Brothers and Washington Mutual and impair its investment in Ford Motor. Operating earnings, which exclude net realized investment gains and losses, were $493 million, or $1.02 a share.

(click table/chart for larger image)

Aflac dividend analysis table October 25, 2008
Aflac stock chart October 24, 2008


Some Positives Developing That May Signal A Market Bottom Is Near

A couple of recent posts highlighted below, indicate a market bottom could be forming.

  • The Big Picture website contains a post, S & P 500 forming "W" Bottom?, using technical analysis that suggests the S&P 500 Index may be forming a bottom. Additionally, Barry Ritholtz notes:
  • This suggests accumulation and could suggest a complex bottoming formation is occurring, particularly when one looks at the recent extremes in sentiment data.


Thursday, October 23, 2008

Bullish And Bearish Sentiment Gridlocked

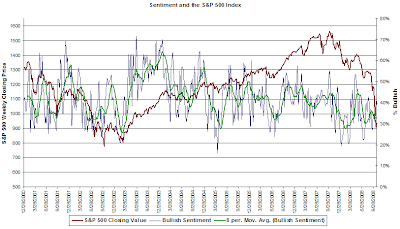
Given the wide daily swings in the market, I am not surprised this week's sentiment survey by the American Association of Individual Investors shows an equal percentage of bullish and bearish investors: 38.74%. From a contrarian perspective, the sentiment indicator marks a market bottom when individual investors are the least bullish. The low 20% area or in ta reading in the teen range would be such an area.

Given the market weakness experienced since October of last year and a bullishness reading that has ranged in the 30-40% area, investors do not seem overly bearish. One would think the market would be acting better based solely on these investor sentiment readings. That raises the question-who is doing all the selling. When this period is evaluated at some point in the future, I would not be too surprised if much of the selling has been hedge fund and institutionally driven.

(click on table for larger image)


Tuesday, October 21, 2008

S&P Decreases Expected 2008 Dividend For The S&P 500 Index

Today, Standard & Poor's is lowering the S&P 500 Index 2008 estimated dividend by 2.8% to $28.05 versus the prior estimate of $28.85. Although S&P is lowering the expected dividend, it remains above the dividend level recorded in 2007, i.e., $27.73. The indicated dividend rate for the S&P 500 Index has also been lowered to $27.35. S&P's Senior Index Analyst, Howard Silverblatt attributes the reduction to potentially negative government actions that might limit the dividend with additional cuts anticipated in 2009.

Most of the dividend cuts have been centered in the financial sector--35 in total; however, Howard Silverblatt notes S&P:
"...believes that the majority of S&P 500 companies will continue their long history of dividend payments and increases, with over half of them expected to pay out more this year than last."
S&P 500 Estimated Dividend table October 21, 2008Source:

S&P Decreases Expected 2008 Dividend Payment for the S&P 500 Index
Q4 Payments Expected to Decline 10% - Worst Since 1958 (PDF)

Standard & Poor's
By: Howard Silverblatt & David Guarino
October 21, 2008
http://www2.standardandpoors.com/spf/pdf/index/102108_DividendRateChange-PR.pdf


Sunday, October 19, 2008

Better Investing's Most Active Stocks

Better Investing is a community of individual investment clubs throughout the U.S. The organization has been in existence for 57 years and gives individual investors an opportunity to:
combine Better Investing's proven investing approach with the knowledge, tools and community support their members need to become smarter, more successful investors.
Below is a listing of the most active stocks from Better Investing members taken from an informal sampling of 147 transactions as of October 19, 2008.


Another Management Evaluation Tool

(I originally posted a portion of this article on The DIV-Net website on October 12, 2008)

As a follow up to one of my post last week on evaluating management using ROE, this post will touch on an additional management evaluation tool. Before I do that though, these are extraordinary investment times and many an investor are unsure of what to do next. Many factors will go into that ultimate decision, but I believe Warren Buffett said it best a few weeks ago:

"You know, five years from now, ten years from now, we'll look back on this period and we'll see that you could have made some extraordinary (stock market) buys. That doesn't mean it won't get more extraordinary a week or a month from now. I have no idea what the stock market is going to do next month or six months from now. I do know that the American economy, over a period of time, will do very well, and people who own a piece of it will do well."
A key aspect to the success of a company and its stock price is the strength of the company's management. In fact, if this one element is missing, no matter how good a company or its competitive advantage, the lack of strong management can lead to poor company results.

In addition to evaluating the company's ROE, investors should review the company's shareholder letter that accompanies the firm's annual report. The American Association of Individual Investors recently wrote an article on elements to look for in the letter. The article notes:
The one window into a CEO's perspective and goals is the shareholder letter contained in the annual report. But upon reading one, you might find that you can't understand what the CEO is trying to say. Often, shareholder letters are riddled with jargon and glossy prose that convey no information. Six of the most popular CEO letter clichés:
  • Talented people,
  • Global presence,
  • Market knowledge,
  • Financial strength,
  • Leverage competitive advantages, and
  • Create significant value for our shareholders.
The article indicates investors should read the shareholder letter and circle in red the cliché phrases outlined above. If one sees more red than black, be forewarned. Once the company passes this test, there are seven criteria an investor should score. The AAII article contains more detail on each criteria, but a summary is listed below:
  • CEO Voice—Personal and Authentic: When you finish reading the shareholder letter, do you feel like you had a meeting with the CEO? Do you feel as if the CEO is talking to you?... A CEO's attitude toward shareholders can reveal how he or she runs the business—for long-term profits or short-term gain. You need to read between the lines of the letter to try to figure out what kind of "relationship" a CEO is looking for

  • Practicing the Financial Golden Rule: Is the CEO giving you information that he would expect to receive if he were the investor?

  • Detailed and Jargon-Free Information: Is the CEO explaining complex topics in simple terms without "dumbing" down this information? Is the letter free of clichés and technical jargon?...
The best letters provide business details in simple, but never simple-minded, language. And they explain how these investment opportunities will produce profits.

  • Consistent and Realistic Information: Has the CEO provided historically consistent information, especially with regard to the company's earnings? Is the CEO explaining the company's goals and how the company intends to meet its goals?...
A CEO who wants to show that he or she is trying to be accountable to investors and other stakeholders is going to tell you about their corporate goals. Financial goals reveal the financial targets that CEOs want their companies to achieve; operating goals reveal the CEO's aspirations to improve the way the work gets done.

  • A Proper Accounting of Earnings: Does the CEO letter reveal an understanding of the difference between the company's cash and accounting earnings? Can you find statements of earnings in the shareholder letter and easily locate this same number on the firm's income statement in the annual report?
Even when CEOs do report company earnings, it's often hard to figure out what they mean. You can blame part of this problem on accounting.

Earnings can be reported at different "layers." Many CEOs choose to report their earnings in shareholder letters several layers up, typically at a level that lets them show their company's earnings in the best possible light. This is not illegal. But when companies offer these customized pro forma earnings, you'll want to examine the underlying assumptions the company is using to calculate them.

To judge management's accounting integrity in the shareholder letter, look for:

  • Clarity in reporting the nature of non-routine write-offs that affect company earnings; and
  • Consistency in the presentation of earnings over time.

  • Balanced Strategic Sense: Does the CEO include a balanced picture of the execution of the company's strategy and its results? Are you learning about the year's business failures as well as the successes?...

The topic that is most frequently cited in a shareholder letter is "corporate strategy." This should be no surprise—when we learn about a company's plans to make money from tangible assets, like plants and equipment, and intangible assets, such as patents, brand recognition and new technology—we get to the heart and soul of financial analysis.

Many companies describe the corporate strategy as a list of action steps they intend to take. But such a list only tells you what a CEO plans to do. They don't show how these steps are being acted out in real-life situations....

  • CEO Values:Is the CEO describing his or her values and are these related to specific events in the company? Do you gain more understanding about how the CEO and his or her company practice these values in relation to their corporate stakeholders: employees, customers, investors, suppliers and others?
A key investor takeaway from reading the letter is whether or not you feel comfortable entrusting your investment dollars to a company's particular management. So when you receive an annual report, read the shareholder letter first.

Source:

Shareholder Letter Revelations: Can You Trust the Leadership?
American Association of Individual Investors
AAII Journal
2008
http://www.aaii.com/includes/DisplayArticle.cfm?Article_Id=2310&digit=524


Saturday, October 18, 2008

Important To Look At Small Business Trends

One segment of economic information that I find important to review on a regular basis is data on the small business segment of the economy. Small business represents roughly 99.7% of all employer firms and 80% of all new jobs in the U.S so the health of this segment is important to future economic growth. The NFIB organization, National Federation of Independent Business, is the leading small business association representing small and independent businesses. It is a nonprofit, nonpartisan organization founded in 1943.

The NFIB Index of Small Business Optimism rose 1.8 points to 92.9 in September continuing one of the longest strings of recession level readings in the history of the survey (started in 1973), but headed up for the second month in a row.

(click chart for larger image)

NFIB Optimism Index September 2008
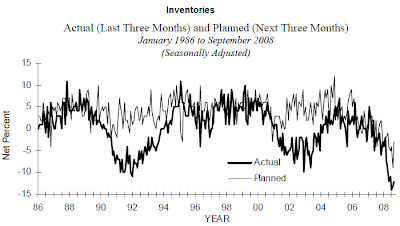
In addition to this small positive, small business owners continued to liquidate inventories, a negative for third quarter Gross Domestic Product numbers. However, when, not if, the economy starts to gain traction, these low inventory levels will mean small companies will need to ramp up production quickly. This will contribute to a rapid restart to economic growth.

(click chart for larger image)

small business inventories September 2008The U.S. Census Bureau's inventory to sales ratio also remains in a longer term downtrend.

(click chart for larger image)

inventory to sales chart September 2008Chart Courtesy of U.S. Census Bureau

Source:

NFIB Small Business Economic Trends (PDF)
National Federation of Independent Business
By: William C. Dunkelberg and Holly Wade
October 2008
http://www.nfib.com/object/IO_38976.html


Friday, October 17, 2008

Dow Jones Industrial Average Up For The Week

It certainly did not feel like the Dow Jones Industrial Average ($INDU) was up 401 points (4.75%) for the week given the high level of volatility. As the weekly Dow chart below details, this was the first week in the last five that the Index ended in positive territory.

(click chart for larger image)

Dow Jones Industrial Average Weekly chart October 17, 2008
The VIX Index ($VIX) reached a surprisingly high level over 81 on Thursday and continues to trade at elevated heights.

(click chart for larger image)

Volatility Index chart, VIX October 17, 2008
A few prominent investors are using this opportunity to build equity positions. The following two articles contain some talking points from Warren Buffett.


Thursday, October 16, 2008

Investor Bullish Sentiment Rises And Redemption Overhang

Individual investor bullish sentiment rose to 40.94% versus last week's reading of 31.47%. Equally impressive was the decline in bearish sentiment to 39.77% versus the prior week level of 60.84%. The bull/bear spread narrowed to -20% versus last week's spread of -29%.

(click graph for larger image)


Is it likely a large part of the market down draft is being driven by hedge fund redemptions? Dow Jones News Wire reports in an article today, Each Market Rally To Be Met By Wave Of Redemption Selling,
In its weekly flow report, TrimTabs Investment Research estimated hedge funds had a record $43 billion outflow in September alone, with flows into hedge funds down 56% for the first eight months of the year. In addition, redemptions for mutual funds this year have totaled about 12% of the total assets in each fund, well above the 8% TrimTabs had expected.

A report from JPMorgan estimated about $100 billion in redemption requests for funds of hedge funds in the fourth quarter, noting that $400 billion in overall position unwinding was likely over the coming year. In prior years, redemptions were well below fund inflows, but the tables started to turn late in 2007. In its most recent second-quarter report, HedgeFund.net said there was a total fund outflow of about $470 million for that quarter, while a Merrill Lynch survey found fund managers are holding more cash than they have in years.

This movement of money is essentially stamping out any significant stock market rally. Some traders saw rallies late last Friday, Monday and early Thursday as signs of a recovery in equities, but fund managers viewed them another way: Get out while you can. They're taking advantage of the modest gains to sell shares and thus satisfy investor redemptions. This has fueled big falls, including Wednesday's 733-point drop in the Dow Jones Industrial Average - the biggest one-day percentage drop since October 1987.

A flood of investor redemptions before Oct. 1 deadlines forced several funds to liquidate positions quickly, causing the wave of selling last week. Funds typically have until the end of the year to pay, but many were inundated with more requests than expected, so quickly sold to raise a cash buffer.
When the selling pressure from hedge funds subsides, the cash sitting on the sidelines could find its way into the equity markets pretty quickly.

Source:

Each Market Rally To Be Met By Wave Of Redemption Selling
Dow Jones Newswire via INO.com
By: Geoffrey Rogow and Joseph Checkler
October 16, 2008
http://news.ino.com/headlines/?newsid=20081016013926


Tuesday, October 14, 2008

Living Within Your Means

Consumer credit outstanding declined by 3.7% in the month of August. An obvious sign that the credit crunch has spilled over into the consumer segment of the economy. Argus Research notes, "The decline was the result of a 0.8% drop in revolving, or credit card, debt and a 5.4% plunge in nonrevolving debt. Miserable auto sales are the explanation for the decline in nonrevolving activity."


The big question is what impact will this have on the economy going forward.


Monday, October 13, 2008

Market Timing Dangers

Today's sharp move higher in the stock market sheds light on the dangers of an investor trying to time the market. I wrote a post earlier this year, Focus on the the Long-Term, in which it was noted missing just a handful of the market's best days in a given year can really penalize returns. If an investor missed just 40 of the biggest up days in the market over the last 20 years (1987-2007), their return would have totaled 3.98% versus remaining fully invested and achieving an average annualized return of 11.82%.

The market research firm DALBAR went one step further and looked at the returns of mutual fund investors over the 20-year period, 1986-2006, and reported the average market timer return was -2%. During this same time period, the S&P 500 Index returned 12%.

market timing chart December 2007
  • Additionally, during the 10-year period 1997-2006, the S&P 500 Index achieved an annualized return of 8.4%. If an investor missed just the top 20 days during this period, their return fell to -.4%.
  • Further, 21 of the best 40 days came during the bear market period 2000-2002.
  • Lastly, nearly three-fourths of the 40 best days came within two weeks following a worst market day.
A key investment decision for an investor should be to review their overall asset allocation. If the review, and investor risk tolerance, indicates additional equity exposure is appropriate, then maybe now is a good time to begin averaging into the market.


Source:

Market Timing Doesn't Work
Charles Schwab OnInvesting
By: Liz Ann Sonders
Fall 2007
http://oninvesting.texterity.com/oninvesting/2007fall/?pg=12

Volatility and Complacency Make Strange Bedfellows
Charles Schwab OnInvesting
By: Liz Ann Sonders
Summer 2007
http://oninvesting.texterity.com/oninvesting/2007summer/


More Federal Holidays To Support Market?

If I were a government employee or bond trader, I would be a little concerned the market saw one of its biggest one day rallies on a day they were off work due to the holiday. Could this be a sign we need less government (less government spending) and fewer bond traders to trade that mortgage debt? If so, let's extend the holiday.

The S&P 500 Index finally broke its string of eight straight down days by advancing 104.13 points or 11.58%.

(click chart for larger image)

S&P 500 Index chart 10/13/2008
Every S&P sector saw positive returns with the Industrial being the weakest, returning 7.28%.

(click for larger image)

S&P 500 sector returns 10/13/2008


Sunday, October 12, 2008

Not A Depression But Lack Of Confidence

A number of economist and financial writers continue to debate whether the current events are leading the U.S. past a recession and into a depression. In short, I believe it is a recession with the lack of confidence in our financial system leading to thoughts of a depression. Following are some highlights from article across the web that support the recession (and not depression) scenario.
Table Courtesy Charles Schwab & Co.
  • Bill Conerly, Ph.D. at the Businomics Blog contains a brief discussion on the TED spread in his article, TED Spread: How High Is Financial Risk Today?, noting "the Great Moderation, the milder business cycle climate" and if you survived any of those past recessions. You'll likely survive this one, too.
  • Jeff Miller, Ph.D. notes in his post, How NOT to Think about Your Investments, at A Dash of Insight, some links to the behavioral aspects to investing. Some investor decisions tend to be "knee-jerk" reactions.
  • And what does Warren Buffett say about the current environment. This from a few weeks ago:
"You know, five years from now, ten years from now, we'll look back on this period and we'll see that you could have made some extraordinary (stock market) buys. That doesn't mean it won't get more extraordinary a week or a month from now. I have no idea what the stock market is going to do next month or six months from now. I do know that the American economy, over a period of time, will do very well, and people who own a piece of it will do well."
So don't make investment decisions by looking in the rear view mirror. As noted in Warren Buffett's quote above, a week or a month from now we may see additional downside volatility. Five and ten years from now: likely higher prices.


Evaluating Management Using ROE

(I originally posted this article on The DIV-Net website on October 5, 2008)

Few factors are more critical in determining the potential success of a company than the quality of a firm's management. During economic and financial times like these, a quality management team can make the difference between success and failure. Certainly a company's dividend practice provides insight into management's anticipated view of future business prospects. Another variable that provides a clue to a company's anticipated prospects is return on equity (ROE) trends.

Return on equity provides information on how well management has invested the capital supplied by its shareholders. ROE is calculated by dividend earnings per share by book value per share than multiplying by 100 to convert to a percentage. In a recent article in BetterInvesting Magazine, it is noted adjustments may need to be made to equity to get an accurate measure of book value.
A company’s book value is determined by subtracting long- and short-term debt from the company’s total assets. It represents what a shareholder would get if the company and its assets were sold at cost. A note of caution about book values: If you’re dealing with a company that has most of its assets related to intellectual property or brands, the figure might be more art than science. The book value of drug patents, factory equipment and vehicle fleets are easily quantified. The book value of a brand isn’t so firm (though it would be foolish to say that brands such as Coca-Cola and McDonald’s don’t have value).
When companies use debt to finance growth, the debt level can inflate the ROE number due to the equity number in the denominator being smaller. Consequently, for firms that carry high debt levels, the resulting higher ROE may not be an effective gauge of management effectiveness. When evaluating the ROE, the return figure should be evaluated on a trend basis as well as compared with its peers.

In general, a higher ROE means the company is generating capital with its existing assets. This ability to generate capital internally means the company is less likely to issue more equity (dilutive) or take on more debt. The additional capital that is generated can then be used for business expansion, stock buybacks and/or dividend increases.

Additionally, I published a post on The DIV-Net website today that covers another management evaluation tool: reviewing the shareholder letter. In addition to the detail on the shareholder letter review, the post contains some advice from Warren Buffett on potential expectations for the coming weeks ahead.

Source:

Measuring Management by Return on Equity ($)
BetterInvesting
By: Michael Maiello
September 2007
http://www.betterinvesting.org/Public/default


Saturday, October 11, 2008

RPM International Increases Dividend 5.3%

RPM International (RPM) announced the company will increase its quarterly dividend to 20 cents per share versus 19 cents per share in the same quarter of last year. The estimated payout ratio is approximately 44% based on estimated May 2009 earnings of $1.78.

RPM dividend analysis table October 11, 2008
RPM stock chart October 11, 2008
The company notes in its press release:
This action marks RPM's 35th consecutive year of increased cash dividends paid to its stockholders, which places RPM in an elite category of less than half of one percent of all 19,000 publicly-traded U.S. companies. Only 67 other companies, besides RPM, have consecutively paid an increasing annual dividend for this period of time or longer, according to the 2009 edition of America's Finest Companies.
It should be noted though the company did go eight quaters, October 31, 2000 through July 31, 2002, without increasing the dividend. During this time period the dividend remained at 12.5 cents per share. Nonetheless, given these difficult market times, this is a welcomed dividend increase.


United Technologies Increases Dividend 20.3%

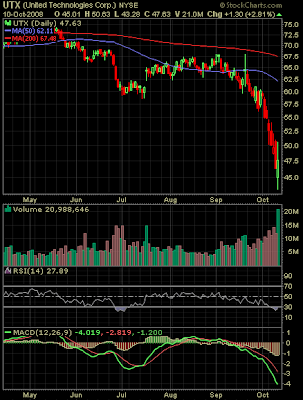
United Technologies (UTX) announced it will increase its quarterly dividend to 38.5 cents per share versus 32 cents per share in the same period last year. The projected payout ratio is 28% based on 2009 estimated earnings of $5.42. This payout compares to the company's 5-year average payout of 26%. The company carries an A+ S&P Quality Ranking score.

United Technologies Dividend Analysis Table October 11, 2008
United Technologies Stock Chart October 11, 2008


Dow Performance In First Year Of Major Corrections

The Chart of the Day published an interesting chart on the Dow's performance in the first year of corrections going back to 1900. They note:
"The first year of the current correction has been more severe than the first year of any correction since 1900 -- and that includes the correction that began in 1929.

[October 9, 2007] also marks the one-year anniversary of the current correction. The Dow put in its record high of 14,164.53 back on October 9, 2007. Today [October 9, 2008], the Dow closed at 8,579.19 -- down 39.4% from its one year old peak."

I would like to think the selling is over done and we are at least due for a bounce.


Thursday, October 09, 2008

Investor Sentiment Has Further To Fall

For the last few weeks I had not looked at the individual investor sentiment reading from the American Association of Individual Investors. I was surprised to see that the bullish sentiment reading was not at a lower level, i.e., like in the 20% range. Historically, individuals are the least bullish when the market reaches a bottom and is about to rally.

The bullish reading for the reporting period ending 10/9/2008 is 31.47% versus last week's reading of 33.33%. Earlier this year, July, the bullishness level was in the low 20's. On the other hand the bearish reading increased to 60.84% versus last week's level of 55%. The last time the bearish percentage was at 60% or higher was October 19, 1990.

(click chart for larger image)


After the last few days, maybe this reading will finally fall into the low 20's.


Wednesday, October 08, 2008

Are Money Market Cash Levels Signaling A Market Bottom?

The below chart notes money market cash as a percentage of all mutual fund assets is at elevated levels. The data is through June and I have no doubt cash levels are at even higher levels today.

(click chart for larger image)

cash levels, stock market, bear market headlines. January 1998 - June 2008Fidelity's Market Analysis, Research and Education Group notes:
  • This flight to safer investments recalls similar investor behavior in 2001-02, when a bear market coincided with sharp increases in flows to money market funds.
  • For example, in October 2002, money fund assets stood near an all-time peak of nearly 35% of all mutual fund assets (reached in January 2003). This cash surge coincided with the low in the S&P 500 and a spike in “bear” headlines.
  • Although a new bull market began in October ‘02, investors kept an above average level of cash until February ‘04—meaning in the aggregate, investors overallocated to cash during a 15-month period when stocks rose more than 30%.
  • As a result, some investors who kept long-term capital tied up in cash likely missed out on considerable gains.
According to Fidelity, the bottom line is to stay invested if your cash levels are at acceptable levels:
  • Historically, investors have increased cash positions during bear markets but have been slow to reallocate to stocks. Sudden corrections—and sudden rallies—have been a normal part of the stock market over time, and attempting to move in and out of it can be a costly endeavor.


Tuesday, October 07, 2008

Dow Jones Industrial Average Falls To Zero In Six Weeks?

The Dow Jones Industrial Average has declined about 1,403 points over the last five trading days or nearly 13%. If the index continues to decline at this same pace, it will be at zero in about six weeks. I don' think so. The index fell 508 points today. At this rate of decline, the index will be at zero in 19 days! The market seems disconnected from fundamentals and fear seems to have taken over.

(click charts for larger image)

Dow Jones Industrial Average percentage change last 5 days as of October 7, 2008
Dow Jones price chart as of October 7, 2008
On the members section of The Kirk Report website, Charles Kirk noted all of the technical indicators from the SentimenTrader's roundup are flashing bullish. None are giving off bearish readings.

(click table for larger image)

technical indicators all bullish as of October 7, 2008
Additionally, The Kirk Report highlights the oversold sectors from Bespoke. Charles notes that five sectors are trading with no stocks above their 50 day moving average as of October 7, 2008: Industrials, Energy, Health Care, Materials and Telecom. On October 3, 2008, Bespoke indicated there were three sectors that had no stocks trading above their 50 day moving average.

The economy and market are certainly challenged at the moment. However, the recent sell off seems to be extremely overdone. At a minimum, the market could be setting itself up for an oversold bounce.


Monday, October 06, 2008

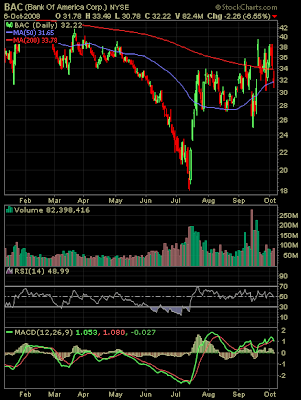
BAC: Another Financial Dividend Aristocrat Cuts Dividend

Today, Bank of America (BAC) announced a 50% reduction in the company's quarterly cash dividend. The new quarterly dividend is reduced to 32 cents per share versus 64 cents per share in the same quarter last year. The company also announced it intends to raise $10 billion in additional capital via a stock offering. BAC is the sixth financial S&P Dividend Aristocrat to cuts its dividend this year.

The Dividend Growth Investor website recently posted an article detailing the recent dividend cuts in the financial sector.

(click table/chart for larger image)

Bank of America dividend analysis table
Bank of America stock chart


Sunday, October 05, 2008

Should You Stick With Stocks

(I originally posted this article on The DIV-Net website on September 21, 2008)

Given the recent volatility in the markets, many investors are wondering what to do with their stock investments. Warren Buffet's thoughts regarding the market can be summed up in one of his famous quotations:

"I will tell you how to become rich. … Be fearful when others are greedy. Be greedy when others are fearful."-- Warren Buffett

Along these same lines, in a recent interview by Jeremy Siegel, he notes:
As some say, it's too late to sell. One thing that I think is also important is again, this is a bear market, but not a huge one. You know we had a 50% bear market from March of 2000 up to October of 2002. This is 20% to 25%. Some people think that it is getting worse and I don't. Listen, it's part of the 200-year history of the U.S. Stock Market. And, if you go back 200 years, has it been right to sell in the bear markets? The answer is no. You take the pain, you hold your position, and you will be rewarded in the future. (emphasis added)
The entire interview, Rough Going for Now, but Stocks Still a Good Bet, is a worthwhile read during this volatile market period.


Saturday, October 04, 2008

Dividend Cuts: $22.5 Billion In 3rd Quarter

Standard & Poor's reports the dollar amount of dividend cuts in the third quarter of 2008 total $22.5 billion. These cuts come from 138 of the approximately 7,000 companies that report dividend information to S&P. Two-thirds of the cuts came from the financial sector.

Updated 3:16 PM, 10/4/2008:

According to BusinessWeek's Investing Insights blog, "...the insult to injury however may come next January, when they find out that since their company didn’t make any money, they didn’t pay any U.S. Federal income taxes, and therefore, the dividends that they were paid are not dividend qualified, meaning they have to pay 35% tax on them instead of 15%. On the bright side, since dividend investors usually hold on to their stocks for decades, many of them will still show a gain over the decades..."

(click chart for larger image)

Dividend Actions third quarter 2008
According to Howard Silverblatt, Senior Index Analyst at Standard & Poor's:
“It was the worst September for dividends since we started keeping dividend records in 1956. During the second quarter, companies were nervous and cautious. The third quarter, however, saw many companies deciding to take action, and that action took $22.5 billion out of the pockets of investors.”

“Financial issues accounted for about two-thirds of the dividend cuts and 93% of the dollar damage during the third quarter. Also, no longer is it just blue chip companies cutting dividends. Many of the issues are now much smaller, and more regional. The problem has trickled down.”
Financial companies are certainly taking a cautious view towards future business prospects and seem to be choosing to conserve cash.

Source:

Dividend Cuts Hit $22.5 Billion in 3rd Quarter (PDF)
Standard & Poor's
By: David R. Guarino & Howard Silverblatt
October 3, 2008
http://www2.standardandpoors.com/spf/pdf/index/100308_DividendReport-3Q2008.pdf

September was the Worst Month for Dividends, but January May Bring Insult to Injury
Investing Insights
BusinessWeek
By: Howard Silverblatt
October 3, 2008
http://www.businessweek.com/investing/insights/blog/archives/2008/10/september_was_t.html


Friday, October 03, 2008

It's A Wonderful Life: Crisis of Confidence

As I noted at the end of an earlier note, the passage of the bailout package would likely not spark a surge in stock prices. In fact, it is less the equity markets that are causing the symptoms rippling through the economy and more the credit markets. The below comment comes from the post, More Discussion of Why the Bailout Bill Will Not Help Money Markets, Commercial Lending, at the website, Naked Capitalism.
"...the market has lost about 2/3s of its ability to convert liquidity to 30-day loans. 90-day is probably similar although there are technical issues with analyzing the chart because 90-day would expire during the end of year crunch so there probably isn't much demand. Next week we'll be able to look at 90-days again.

One of the most critical functions of the banking system is converting short-term deposits into longer-term loans for businesses. Much of the working capital market, for decades has come via money market funds (MM). Joe public or Joe CFO deposits money into a MM. That MM loans it to a bank (usually by buying paper, and usually at a medium duration) and then that bank loans it out to business for inventory, payroll or whatever. The MM has converted Joe's demand deposit into a fixed-duration loan.

The problem we're having is that people are fleeing commercial MM for treasury MM. Those are buying treasuries and thus converting the money to the desirable medium duration BUT that money is loaned to the Fed, and the Fed doesn't make working capital loans. So the deposited money that had been made into working capital has been diverted into the Fed and lost to working capital.

The Fed is kind of trying to address this by loaning out money via various auction/discount windows. BUT, those loans have been overwhelmingly overnight - a particularly nasty demand deposit because it goes back so fast. For a bank to convert that to a 90-day loan it's got to win 90 auctions in a row - a very risky deal with a crunch on. So the Fed undoes the duration conversion, and then some, converting the liquidity into a form that the banks can't make into useful-duration loans.

Right now we have both commercial and treasury MMs. Deposits have shifted from commercial MMs to treasury MMs, and consequently we have less working capital (a commercial MM product) and better credit for the Fed (a treasury MM product). But, treasury MM rates are now very low and the gap between treasury and commercial fairly high, which creates an incentive for depositors to put money into commercial funds, producing some working capital..."
So what we have is a crisis in the public's confidence in the financial system.

In the movie, It's A Wonderful Life, George Bailey's (Jimmy Stewart) bank faced funding issues as depositors became concerned about the bank' viability after the loss of a large deposit. Initially, many depositors wanted to withdrawal funds from the bank. In the end, the community realized the importance of the bank and came in droves to return their funds to Bailey's institution.

The message in the movie is one of courage and sacrifice for the greater good as George Bailey, a man with big ideas about seeing the world, continually forsakes his own desires to do what is right for the town. No matter how insignificant we feel we are, we are all inextricably linked to each other and play an important part in the fabric of one another's lives.

Although investing seems more complex today given the different investment vehicles, the funding of financial institutions is essentially unchanged. We need leadership and legislation from Congress that will rekindle depositor confidence in the financial system. The way this can be done is for the government/FDIC to guaranty 100% of all depositor funds for at least two years. The country of Ireland has implemented such a system. During this time period, the government can arrange bank mergers between the strong and the weak, effectively eliminating weak institutions.

One thing is certain though, it appears increasingly more attractive investment opportunities are being made available on a daily basis. If one has a five year or longer time horizon, prices of equity and some debt (bonds) are at levels that create nice entry points for beginning to build positions in various investments.

Source:

More Discussion of Why the Bailout Bill Will Not Help Money Markets, Commercial Lending
naked capitalism
By: Yves Smith
October 2, 2008
http://www.nakedcapitalism.com/2008/10/more-discussion-of-why-bailout-bill.html


Wednesday, October 01, 2008

S&P 500 Dividend Payers Outperform Non-Payers In September

In my post yesterday, I noted that the Dividend Aristocrats significantly outperformed the market for both the month of September and year to date through September. Those returns were based on a market cap weighed basis.

For the payers and non-payers in the S&P 500 Index in the month of September, the payers did outperform the non payers, -9.20% versus -14.81%, respectively. These returns are reported on an average basis by S&P and both payers and non-payers underperformed the S&P 500 Index's weighted return of -8.91%. Year to date though, the table notes the payers have outperformed the S&P 500 Index.

(click on table for larger image)

s&p 500 dividend payers versus non payers September 2008
Every sector in the S&P generated a negative return with the materials sector losing the most at -17.24%. On a year to date basis, only the consumer staples sector has generated a positive return at 4.13%.

(click on table for larger image)


Let's Not Forget How We Got Into This Bailout Mess

Congress has a convenient way of twisting the truth about how this country got into the mortgage mess.
"Those who cannot remember the past are condemned to repeat it"
As the 1999 New York Times article, Fannie Mae Eases Credit To Aid Mortgage Lending, notes, this entire situation started as far back as 1999. A couple of excerpts from the article:
In a move that could help increase home ownership rates among minorities and low-income consumers, the Fannie Mae Corporation is easing the credit requirements on loans that it will purchase from banks and other lenders (emphasis added).

The action, which will begin as a pilot program involving 24 banks in 15 markets -- including the New York metropolitan region -- will encourage those banks to extend home mortgages to individuals whose credit is generally not good enough to qualify for conventional loans (emphasis added). Fannie Mae officials say they hope to make it a nationwide program by next spring.

Fannie Mae, the nation's biggest underwriter of home mortgages, has been under increasing pressure from the Clinton Administration to expand mortgage loans among low and moderate income people (emphasis added) and felt pressure from stock holders to maintain its phenomenal growth in profits....
Extending easy credit to those that can't pay will continue to lead to further stress.

In short, I am not certain the bailout package from Congress addresses the issue occurring in the money markets. Maybe on a short term basis, but likely not a long term fix. Broadening FDIC insurance is a good step as well as temporarily altering the mark-to-market FAS 157 accounting rule. The unfortunate aspect of this entire situation is our Congressional representatives do not seem to grasp what are the real structural problems. One only needs to look at the amount of "pork" amendments added to this bailout bill.

The markets and our economy are resilient and will get through this. One thing is certain though, incredible investment opportunities are being presented to investors.

Source:

Fannie Mae Eases Credit To Aid Mortgage Lending
The New York Times
By: Steven A. Holmes
September 30, 1999
http://query.nytimes.com/gst/fullpage.html?res=9C0DE7DB153EF933A0575AC0A96F958260&sec=&spon=&pagewanted=1