Friday, February 27, 2015

Market Advance Not Extraordinary In Terms Of Magnitude And Duration

In prior post over the past year I have highlighted the current market advance as it relates to prior bull markets. This information has been prepared by Chart of the Day and the below chart and commentary updates the comparison for the Dow Jones Industrial Average. The most recent commentary for the S&P 500 Index is included in the post, Current Stock Rally Below Average In Magnitude.
"The Dow just made another all-time record high. To provide some further perspective to the current Dow rally, all major market rallies of the last 115 years are plotted on today's chart. Each dot represents a major stock market rally as measured by the Dow with the majority of rallies referred to by a label which states the year in which the rally began. For today's chart, a rally is being defined as an advance that follows a 30% decline (i.e. a major bear market). As today's chart illustrates, the Dow has begun a major rally 13 times over the past 115 years which equates to an average of one rally every 8.8 years. It is also interesting to note that the duration and magnitude of each rally correlated fairly well with the linear regression line (gray upward sloping line). As it stands right now, the current Dow rally that began in March 2009 (blue dot labeled you are here) would be classified as below average in both duration and magnitude."
From The Blog of HORAN Capital Advisors


Tuesday, February 10, 2015

A Rising Bearish Wedge Pattern Is Developing In the S&P 500 Index

Near the end of October last year the S&P 500 Index moved into a sideways trading range that has seen the market move back and forth between 1,975 and 2,093. Then on December 19, a spike in up volume occurred that created the top of this trading range. Subsequent to this capitulation buying the market has struggled to recapture this December high mark with the market trading action forming a rising bearish wedge pattern. A rising wedge pattern tends to resolve itself with a market that breaks to the down side. Several highlights from the below chart.
  • The rising wedge is noted by the solid green and solid red lines. Also, the market is making lower highs as evidenced by the red dashed line.
  • The full stochastic indicator turned negative today with the fast green line dipping below the slower moving red line. This negative divergence has occurred at a level where the stochastic indicator shows the market is short term overbought.
  • Lastly, the on balance volume indicator (OBV) has trended lower since the start of the year. With the OBV, it is the trend of the line that is important. As noted on the stockcharts.com website, "OBV rises when volume on up days outpaces volume on down days. OBV falls when volume on down days is stronger. A rising OBV reflects positive volume pressure that can lead to higher prices. Conversely, falling OBV reflects negative volume pressure that can foreshadow lower prices." The OBV often moves before a stocks price.

From The Blog of HORAN Capital Advisors

To provide another market perspective, Charles Kirk of The Kirk Report always provides insightful technical analysis during the week (small subscription required). In his strategy report tonight, he provides the below chart of the S&P 500 Index graphed in a 30 minute time frame and included the following analysis,
"By closing above swing resistance at S&P 2064 today, a new smaller bullish range breakout setup with a target at S&P 2141 has now triggered. Today’s rally also further developed the handle on the new cup setup we talked about in yesterday’s report and which you can also see in the 30 minute view below but needs to trade above last Friday’s intraday high at S&P 2072 to fire."
From The Blog of HORAN Capital Advisors

"With the attempted small range breakout in motion, it is now important that we see sustained bullish upside follow through to confirm. The first step would be to clear and hold above last Friday’s high at S&P 2072 and then take out the prior early December swing high at S&P 2079. If those levels are broken all that would remain is the December high at S&P 2093. If we are to now move away from this multi-month trading range, we will need to see sustained bullish upside follow through. In sum, this is the bulls’ best chance yet to try to put this trading range behind it. Whether it can hold above the smaller range is key."
In conclusion, I think Charles Kirk's analysis and mine are telling a similar technical story. The key is the fact the market needs to break resistance at the S&P 500 December high of 2,093. However, I believe the on balance volume indicator and the stochastic indicator are suggesting the market may trade lower before pushing through this December high level.


Saturday, February 07, 2015

A Strong Dollar Does Not Mean Large Cap U.S. Multinationals Underperfom Small Cap Equities

The US Dollar has been on a strengthening trajectory since early 2011 and more so since mid year last year. This move in the Dollar has been a headwind for U.S. domiciled multinational companies earnings, with many firms citing this as a reason for earnings disappointment during this earnings reporting season.

From The Blog of HORAN Capital Advisors

One belief is investors can avoid this negative currency impact within their investment portfolio by focusing more on small company stocks since small caps are less exposed to this exchange rate risk. The thinking is small cap companies generate a larger percentage of their overall business from domestic sources versus the larger multinationals that generate a larger portion of their revenue from overseas. In fact this seems to be the case during the earlier phase of the Dollar's strengthening as the above chart shows small cap outperformance from 2010 through most of 2013. However, as the Dollar continues to strengthen, larger cap companies actually outperform small caps as occurred in the mid 1990s. This can be seen in the below chart that compares the relative return of large caps versus small caps (orange line) to the U.S. Dollar Index.

From The Blog of HORAN Capital Advisors

S&P Capital IQ provided additional analysis in a report released in late January titled, Don't Duck A Rising Buck. In the report S&P analyzed the performance of large cap stocks versus small cap stocks during bear markets and bull markets and compared the results to the trend of the U.S. Dollar. The report is a worthwhile read for investors. In short, the data suggests large cap companies actually outperform small cap companies in a rising Dollar environment when the overall equity market is in a bull market phase. This outperformance occurs when the Dollar Index rises above 95 (closed Friday just below 95.) The report contains a sector performance comparison as well.

From The Blog of HORAN Capital Advisors

There are several reasons this outperformance by large caps may occur when the Dollar Index is above 95 and when the equity market is in a bull phase. Foreign investors likely see the U.S. economy growing at a faster pace than other economies, and this is the case today. With this thinking, foreign investors will allocate investment funds to U.S. equities. In doing so, they tend to focus on larger multinational firms that are more broadly know. Additionally, larger equities are more likely to be more liquid. This additional investment flow into the U.S. and the investment in Dollar denominated assets further pushes the U.S. Dollar Index higher. For non U.S. investors then, they receive an additional return benefit from a positive currency exchange when Dollar's are converted back into their home currency.

Just one comment on small caps. At HORAN, we have been out of small cap equities since late 2013. A reason we chose to eliminate the category from our client allocations was partially due to the valuation of small cap stocks broadly. In a Reuters report today, Valuations May Hurt Small Caps, Despite Job Growth, the article cites the apparent overvaluation of small cap stocks. Specifically, the article notes,
"The trailing price-to-earnings ratio of the index is at 22.7, which is 40 percent more than its long-term average of 16.2. Its price-to-sales ratio of 1.6 is nearly 67 percent higher than its long-term average."
In summary, even though small caps are less exposed to overseas business, there are several factors that indicate large cap U.S. equities outperform in spite of the currency headwind. Additionally, the valuation of small cap stocks are likely to be a headwind for the small cap equity asset class.


Sunday, February 01, 2015

The S&P 500 Index Nearing A Technical Bounce Level?

The month of January was not kind to U.S. equity investors. The S&P 500 Index ended the month down 3.00% and the Dow Jones Industrial Average was down 3.58%. The small cap and mid cap indices did not fare much better. On the surface, European equities appeared to be a bright spot with the S&P Europe 350 Index up 7.27%. However, for a U.S. investor not hedging the Euro/Dollar currency exchange, virtually all of this gain was lost in the currency translation back to the Dollar. The S&P Europe 350 Index was up a marginal at .09% in US Dollars.

From a sector perspective, the defensive sectors were the bright spot as can be seen in the below graphic. For the month utilities were up 2.37% and Health Care was up 1.23%, A bit surprising was the weakness seen in the consumer discretionary sector which was down 3.06%. Consumers seem to be restraining their spending even though they are realizing a large savings at the gas pump.

From The Blog of HORAN Capital Advisors

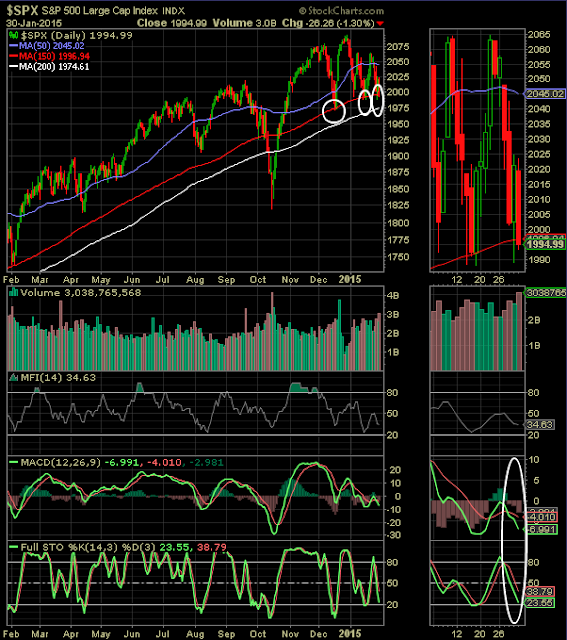
From a technical perspective, the market is not at an extreme oversold level but has approached an important support level, the 150 day moving average. On Friday, the S&P 500 Index closed at 1994.99 which is just below the 150 day M.A of 1996.94 as can be seen in the below chart. The 50 day M.A. has served as important support for the market over the past three years.

From The Blog of HORAN Capital Advisors

Other technical indicators, such as the MACD and stochastic, are nearing levels indicative of a market that is nearing a potential bounce. In my mind though, these technical indicators could see a little more weakness before the market does move higher. The percentage of stocks trading above their 50 and 150 moving average also are not at extreme levels, but are at levels where market recoveries occurred in the rally during the last several years.

From The Blog of HORAN Capital Advisors

Of a bit of concern is individual investor sentiment seems to be shaking off this resent pullback. For example, the American Association of Individual Investors reported bullish investor sentiment increased seven percentage points to 44.17% last week, which is above the long term average of 39%. Additionally, the bull/bear spread widened to 21.78% from 6.35% in the prior week. The long term bull/bear ratio average is 8.6%.

From The Blog of HORAN Capital Advisors

Lastly, the CBOE equity put/call Ratio declined as of Friday to .68, which means a slight increase in investor bullishness. This, along with the AAII sentiment indicator, is a contrarian one and both would suggest a little market weakness before a bounce ensues. As noted before on our blog, these sentiment indicators are most predictive when at extreme levels though.

From The Blog of HORAN Capital Advisors

Consumers are a critical component to economic activity and what they say has not yet translated into what they are actually doing. However, positive consumer sentiment is likely to lead to an improving consumer sector as we move out of winter and into the summer. As Econoday noted last week, Friday's University of Michigan consumer sentiment report was another strong and positive one.
"Consumer sentiment held on to its very strong surge at the beginning of the month, ending January at 98.1 vs the mid-month reading of 98.2 and compared against 93.6 in December. The current conditions component extended its first half gain to 109.3 vs 108.3 at mid-month and against 104.8 in December. The comparison with December points to strength for January consumer activity. The expectations component ends January at 91.0 vs 91.6 at mid-month and 86.4 in December. Price expectations are low, at 2.5 percent for 1-year expectations, up 1 tenth from mid-month but down 3 tenths from December, while 5-year expectations remain at 2.8 percent, unchanged from both mid-month and December. Consumer spirits are now very strong but have yet to translate to a similar pickup in consumer spending."
From The Blog of HORAN Capital Advisors
Source: Econoday

For investors then, the market's action around the 150 day moving average in the days ahead will be important. The near oversold levels reached by the MACD and the stochastic indicators, just naming a few, are indicative of a market that is nearing a position where an oversold bounce could occur. Certainly of concern is the fact the S&P 500 Index has been making lower highs and lower lows so far this year.