Thursday, May 29, 2008

Bullish Investor Sentiment Sees Sharp Decline

The American Association of Individual Investors reported bullish investor sentiment declined this week. The bullishness level fell to 31.36% versus last week's level of 46.30%. The bull/bear spread equaled -14% versus a +12% in the prior week.

(click on graph for larger image)


Although investor sentiment declined, the percentage of NYSE stocks trading above their 50 and 200 day moving averages remain at fairly high levels as noted in the charts below.

(click on graphs for larger image)

percent of NYSE stocks trading above 50 day moving average
percent of NYSE stocks trading above 200 day moving average


Wednesday, May 28, 2008

Supervalu Increases Dividend 1.5%

Today, Supervalu, Inc. (SVU) announced a 1.47% increase in its 3rd quarter 2008 dividend. The new quarterly dividend will increase to 17.25 cents per share versus 17 cents per share in the same quarter last year. The company's 2nd quarter dividend of 17 cents per share will be paid on June 16th to shareholders of record on June 2. SVU's estimated earnings per share for year end February 2009 is $3.10. The dividend payout ratio on the 2009 earnings estimate is approximately 22%. The 5-year average payout ratio is 28%. The company carries an S&P Quality Ranking of A-.

In addition to the dividend increase, the company announced a new annual share repurchase program authorizing the purchase of up to $70 million of the Company's common stock. Stock purchases will be made from time to time in open market purchases primarily from the cash generated from the settlement of stock options. The company noted this annual authorization program replaces the existing $235 million share repurchase program authorized in April 2007.

Supervalu dividend analysis table May 2008
Supervalu stock chart May 2008


Tuesday, May 27, 2008

Energy Stock Added To The S&P 500 Index

Could the addition of another energy stock to the S&P 500 Index be additional evidence that energy stock performance may have seen its better days? Today Standard & Poor's announced it would add Southwestern Energy Co. (SWN) to the S&P 500 Index at the close of trading on June 5, 2008. SWN will replace Trane as it is being acquired by Ingersoll-Rand (IR).


Friday, May 23, 2008

Bullish Sentiment Increases Slightly

In the American Association of Individual Investors sentiment survey release this week, bullish investor sentiment moved higher by a small amount. The bullish sentiment level increased to 46.30% versus last week's reading of 45.16%. Conversely, bearish investor sentiment increased to 34.26% versus 29.68% last week. One result was a narrowing of the bull/bear spread to 12% from 15%. It should be noted the 8-period moving average of the bullish sentiment level continues to move higher for the ninth consecutive week.

(click on chart/table for larger image)

investor bullish sentiment chart May 22, 2008


Wednesday, May 21, 2008

Stock Buyback Reduction Versus Dividend Cut

Given the high level of stock buyback activity over the last few years, should a company's reduction in its buyback program be viewed similar to a dividend reduction? If nothing else, significantly more weight should be applied to a company's dividend practice versus its buyback intentions when evaluating stocks. A company that is committed to growing its dividend finds it less palatable to cut a dividend versus reducing or eliminating a buyback program.

I good example is Home Depot's (HD) first quarter 2008 earnings release earlier this week. In a discussion with the Wall Street Journal, the company's CFO noted:
"the second half of Home Depot's $22.5 billion share-repurchase program remains 'on pause just because of the instability of our business and the instability of the credit markets.'"
The other caution is the potential distortion in financial ratios that involves shares outstanding in the calculation. Ratios like P/E and EPS, just to name a few, may not reflect the underlying trends within a company. The reason is shares outstanding are in the denominator a number of different ratios.

For an investor, slowing dividend growth and buyback program reductions can be used to evaluate potential earnings difficulty on a forward looking basis.

Source:

Home Depot Net Falls 66% As Store Growth Brakes ($)
Wall Street Journal
By: Ann Zimmerman & Marry Ellen Lloyd
March 21, 2008
http://online.wsj.com/article/SB121127839332906705.html


Sunday, May 18, 2008

S&P 500 Operating Earnings Up 8.77% Ex-Financials

According to Standard & Poor's, first quarter operating earnings are up 8.77% when excluding the 95 financial issues in the index. With the financial issues included though, operating earnings are down 25.89%. This preliminary data is after approximately 95% of the S&P 500 companies have reported earnings.

(click on table for larger image)

S&P 500 Operating Earnings Contribution first quarter 2008
The year over year operating earnings changes are detailed below.

(click on table for larger image)

S&P 500 year over year change in operating earnings first quarter 2008Excluding financials and consumer discretionary stocks, the YOY operating earnings change is fairly respectable.

Source:

S&P 500 Q1 Earnings Down 25.9%;
Financials Again Posts Negative Earnings (pdf)

Standard & Poor's
By: David R. Guarino & Howard Silverblatt
http://www2.standardandpoors.com/spf/pdf/index/2008Q1_earnings.pdf


Friday, May 16, 2008

The Bulls Have The Advantage

A lot has been said about the bulls needing to make a stand and push the S&P 500 Index above 1,420. Well this week the S&P did take out this resistance level and closed above 1,420 both Thursday and Friday. Next week the focus of the technical discussion might centered around the S&P 500 ability to hold and close above 1,420; thus creating a support level for the market. In the end though, I think this type of discussion is good; however, a long term investor should not get too focused on only technical data.

If an investor waited to put money to work until these support and resistance levels were validated, they would have missed a strong upward move in the market since the end of March as noted in the NYSE Index chart below.

(click on chart for larger image)

NYSE Index chart May 16, 2008
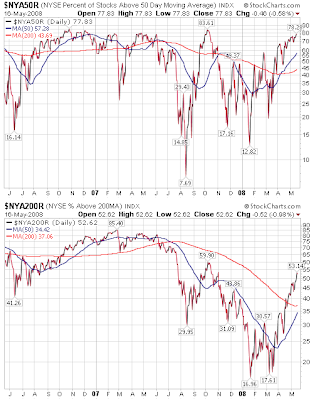
On a short term basis, a case could be made that the market needs to consolidate at this level before moving higher. The chart below shows that 78% of NYSE stocks are trading above their 50-day moving average. From a longer term perspective though, only 53% of NYSE stocks are trading above their 200-day moving average.

(click on chart for larger image)

percent of NYSE stocks trading above 50 day and 200 day moving average May 16, 2008Beginning next week and going forward should be interesting for the market. From a short term perspective we could see some sideways market movement as some of the recent gains are digested. Longer term though, the market appears to want to go higher as it climbs the commodity "wall of worry."


Thursday, May 15, 2008

Investor Bullish Sentiment Declines And Market Moves Higher

The American Association of Individual Investors' Sentiment Survey tends to be a contrarian indicator. True to form, this week the bullish sentiment reading declined to 45.16% versus last week's 52.81% and the S&P 500 Index moved higher by 1.4%. The less volatile 8-period moving average moved higher to 44% versus last week's 41.6. The bull/bear spread narrowed to 15% compared to 28% last week.

(click on graph for larger image)


Wednesday, May 14, 2008

Yield Curve Predicting Stronger Economic Growth?

According to the Federal Reserve Bank of Cleveland, one year ago the yield curve was predicting there was a 35% chance the U.S. economy would be in a recession by May 2008. At that time, many thought this high probability was not realistic. Fast forwarding to today, the higher probability predicted last year seems to have been somewhat correct in that the economy has certainly slowed.

Instead of looking in the rear view mirror, today's yield curve might be predicting stronger economic growth one year in the future. According to the Cleveland Fed study, "...the expected chance of the economy being in a recession next May stands at 0.9 percent, just below April’s 1 percent, and March’s 2.7 percent."

probability of recession based on yield curve spread May 2008
Although the article notes the yield curve does not do a great job in predicting the actual rate of GDP growth, based on the yield spread,
Projecting forward using past values of the spread and GDP growth suggests that real GDP will grow at about a 3.0 percent rate over the next year. This is on the high side of other forecast.
yield spread versus predicted GDP growth May 2008Lastly, as the yield curve steepens (wider yield spread) it does appear future economic activity is stronger one year later. The below chart graphs the yield spread versus GDP lagged by one year.

yield curve spread versus GDP one year laggedTwo related posts on the yield curve are noted below.
Source:
The Yield Curve
Federal Reserve Bank of Cleveland
By: Joseph G. Haubrich
May 13, 2008
http://www.clevelandfed.org/research/trends/2008/0608/01monpol.cfm


Monday, May 12, 2008

Exchange Traded Fund Assets Grow 28%

As of March-2008, assets in exchange traded funds grew 28%. The Investment Company Institute reported assets in ETFs grew to $571 billion as of March-2008. This compares to $444 billion in March-2007. During that same time period, the number of exchange traded funds increased to 644 funds versus 454 funds at the end of March 2007.

(click on table/graph for larger image)


Sunday, May 11, 2008

Recent Dividend Increases


Company
Rate of IncreaseNew Qrtly RateOld Qrtly Rate (YOY)New YieldOld YieldQuality Ranking
Pepsi13.33%$.425$.3752.52%2.22%A+
Rohm & Haas10.81%$.41$.373.04%2.74%A-
Granger (W.W.)14.29%$.4$.351.86%1.63%A
Johnson & Johnson10.84%$.46$.4152.76%2.49%A+
Procter & Gamble14.29%$.4$.352.45%2.15%A+
Exxon Mobil14.29%$.4$.351.8%1.58%A+
TJX Companies22.22%$.11$.091.42%1.16%A+
Chubb13.79%$.33$.292.5%2.2%A-
Wal-Mart7.95%$.2375$.221.66%1.54%A+
Air Products & Chemical Co.15.79%$.44$.381.8%1.55%A


Thursday, May 08, 2008

Bullish Investor Sentiment Essentially Unchanged: May 8, 2008

The American Association of Individual Investors reported that investor bullish sentiment was essentially unchanged this week at 52.81% versus last week's 53.29%. The bull/bear spread widened one percentage point to 28% from the prior week's level of 27%.

(click on graph for larger image)


Tuesday, May 06, 2008

Market Is A Leading Indicator Coming Out Of Recession/Economic Slowdown

The stock market tends to serve as a leading indicator heading into a recession as well as coming out of a recession. T. Rowe Price (TROW) along with Ned Davis Research note:
...on average the stock market peaked about nine months before the onset of recessions, the pattern of each recession is different. In the 1990–91 recession, for example, the market hit its high less than a month before the recession began, while stocks peaked 14.5 months before the most recent recession began in March 2001.
Not only has the market peaked, on average, nine months prior to the beginning of a recession, the market tends to recover in advance of an improving economy.
...the market bottomed on average about five months before the end of recessions, this low has ranged from just about two months before the end of the 2001 recession to more than eight months prior to the end of the 1953–54 recession.
S&P 500 performance around postwar recessions 2008
S&P 500 Performance: postwar recessions
One aspect of the market coming out of a recession is the outperformance of small company stocks relative to large cap stocks. On the other hand, going into an economic slowdown, small caps significantly underperform large cap stocks.

According to the spring edition of the T. Rowe Price Report, "For the 12-month period following the end of the last nine recessions, small-cap stocks on average provided a 24% gain compared with 17.6% for the S&P 500." Going into the slowdown though, "in 18 bear markets since the 1930s, small-cap stocks have suffered a median decline of 29% versus 21.4% for large-cap stocks."

small cap performance relative to large cap. postwar recessions
Since studies indicate it is difficult to time the market, investors should use this point in the market cycle to make adjustments to their asset allocation. The adjustments should focus on those that bring an investor's overall portfolio allocation in line with their long term objectives.

Source:
Tracking Stock Market Performance
Through Past Economic Recessions (pdf)

T. Rowe Price Report
Spring 2008
http://www.troweprice.com/gcFiles/pdf/04779-Spring08-final.pdf?
scn=2008&rfpgid=7949&ft=GNL_CTT


Saturday, May 03, 2008

Pain At The Pump

One expenditure weighing on consumer sentiment is the price of a gallon of gas. As the chart below shows, the inflation adjusted price of a gallon of gas has surpassed the prior peak that occurred in 1981.


Dividends Are A Critical Component Of Total Return

A significant benefit of focusing on a company's dividend practices is the fact dividends must be paid out of cash. Regardless of a firm's reported earnings based on Generally Accepted Accounting Principles (GAAP), a look at the cash flow statement provides insight into the true cash generation capability of a company.

In a recent dividend investing white paper (pdf) from Eaton Vance (EV), the company notes dividends have accounted for over 50% of a stock's return since the 1930s.

dividend contribution to total return since 1930The white paper shows:
Dividends have been a major component of investment return over the long-term. In fact, over the past 45 years, more than 50% of the annualized total return of the S&P 500 Index came from dividends.1 As the chart below shows, $1000 dollars invested in 1960 in the S&P 500 would have grown to over $114,718 today. But if you take away dividends, that same $1,000 dollars would be worth $24,517.2

Value of dividends over time since 19601Total return is annual price appreciation, or loss, plus dividends.
2
Source: Lipper Inc. Not meant to represent income from any Eaton Vance fund. S&P 500 Index is an unmanaged index commonly used as a measure of U.S. stock market performance. For illustrative purposes only. Past performance is no guarantee of future results. It is not possible to invest directly in an Index.
Lastly, over longer periods of time, data indicates the dividend growers and initiators out perform the other types of companies in the S&P 500 Index.

dividend growers and initiators outperformLastly, the white paper details the impact that legislative tax changes have had on the likelihood of companies to pay a dividend. Also, as the baby boomers begin entering retirement, paltry bond yields are enticing the baby boomers to look at dividend paying and dividend growth stocks.

Source:
Dividend Investing:
Favorable Long-Term Opportunities for Total Return and Income

Eaton Vance
By: Judith A. Saryan, CFA & Michael A. Allison, CFA
April 2008
http://www.eatonvance.com/alexandria/2843.pdf


Friday, May 02, 2008

Dividend Payers Underperform Non Payers In April

For the month of April 2008, the dividend paying stocks in the S&P 500 Index underperformed the non payers, 4.70% versus 7.12%, respectively. On a year to date basis though, the payers continue to maintain a performance edge over the non payers (-3.63% versus -4.92%).


Individual Investor Bullish Sentiment Continues To Rise

I have been traveling on business for the last several days and unable to post on recent dividend news. Over the weekend, I will strive to detail some of the dividend growth news that was reported this past week.

In the meantime, individual investor bullish sentiment rose to its highest level since being reported at 54.64% in October 2007. The percentage of individual investor reported as bullish this week rose to 53.29%. The bull/bear spread widened to +27% versus last week's reading of +19%.

This is a volatile contrarian indicator; however, since the bullish reading bounced along in the 20% range in mid to late March, the S&P 500 Index is up 6+% since that time.

(click on chart for larger image)