Tuesday, August 31, 2010

The Real Facts About The Recent Hindenburg Omen Trigger

One technical data point that has received quite a bit of press recently is the triggering of the criteria that make up the "Hindenburg Omen" indicator. On the surface, it would seem the data provides support for the underlying factors that comprise this indicator. However, as Bespoke Investment Group and Liz Ann Sounders of Charles Schwab note, the facts are not as they appear.

As Bespoke notes, the five criteria that need to be met are as follows:
  1. The daily number of New York Stock Exchange new 52-week highs and daily number of new 52-week lows must both be greater than 2.2% of total NYSE issues traded that day.
  2. The smaller of these numbers is greater than or equal to 69 (2.2% of 3126 NYSE issues). This is not a rule, but more like a check.
  3. The NYSE 10-week moving average must be rising.
  4. The McClellan Oscillator must be negative on the same day.
  5. New 52-week highs can't be more than twice new 52-week lows (however, it's fine for lows to be more than double highs).
As Schwab outlines in a recent research article the most important factor is the first one noted above. Following are the real facts behind the supposed trigger of this variable:
"Looking at the list of news highs and lows from Thursday, August 12 (the first Hindenburg Omen trigger day), there were 92 stocks (2.9% of NYSE) that hit new highs and 82 (2.5%) that hit new lows.

However, a closer look at the list of new highs shows that most of the "stocks" hitting new highs were hardly stocks at all. Practically all were closed-end fixed income securities, preferred stocks or some other form of fixed income product masquerading as stocks. In fact, of the 92 issues that hit new highs, only seven were common stocks!

Given that there are so many fixed income products that now trade on the NYSE, and with demand for them so high, perhaps a better way to measure new highs (or lows) is by filtering out all the quasi-stocks. B.I.G. did this by looking only at stocks in the S&P 500® index and applying the same Hindenburg Omen parameters.

On the initial trigger day, only 0.2% of S&P 500 stocks hit new highs while 5.6% hit new lows. Of course, a day with 5.6% new lows doesn't highlight a healthy market, but it may not reflect the confusion that the Hindenburg Omen supposedly conveys. As B.I.G. noted, 'Call us crazy, but an indicator that measures the internals of the equity market should probably avoid using fixed income securities in its analysis.'"
Appropriately, as one factors out the non-equity variables, only seven of the new highs were stocks! And, as the noted above, only .2% of the stocks hit new highs on the 12th of August.

For investors then, as uncertainty about the future direction of the market abounds, be sure not to take the bearish or bullish market signals at face value. This is not the same market your parents or grandparents invested in historically.

Source:

Land of Confusion … Bubbles and Omens Dissected
Charles Schwab & Co.
By: Liz Ann Sounders
August 30, 2010
http://www.advisorperspectives.com/commentaries/schwab_090110.php

Know Your Indicators: Hindenburg Omen
Bespoke Investment Group
August 18, 2010
http://www.bespokeinvest.com/thinkbig/2010/8/18/know-your-indicators-hindenburg-omen.html


Sunday, August 29, 2010

Change In Control Of Congress And The Market

Many eclectic technical market indicators have surfaced recently given the uncertain direction of the economy and the stock market. We have the Hindenburg Omen, the Kindleberger Cycle just to name a few. I sometimes wonder if these indicators bubble to the surface or gain popularity because fundamental indicators do not support a bear market case.

In any event, one other technical indicator that may come to pass is the potential change in the party that controls Congress. The last time the Democrats held control of both houses of Congress and the White House was during the first two years of President Bill Clinton's first term in office in 1993 and 1994. During the mid-term elections in 1994, the Democrats lost control of both houses of Congress. Prior to the election, the Democrats held 57 senate seats and 258 house seats. Today the Democrats hold 55 senate seats and 256 house seats. So how might the stock market react if one or both houses of Congress change hands over to the Republicans?

Subsequent to the 1994 mid term elections and during the second half of Bill Clinton's presidential term, the stock market advanced over 34% in 1995.

From The Blog of HORAN Capital Advisors

If one believes in cycles and playing in favor of the market now is the fact the third year of a president's term tends to be the best performing one.

From The Blog of HORAN Capital Advisors

More detail can be found in an earlier post I wrote on this topic titled, Presidential Election Cycle Nearing Its Best Quarters. The above table comes from a Standard & Poor's research piece written by Sam Stovall and titled, Whistling a New Tune in June?

One can track the prediction market for these potential outcomes on Intrade. The likelihood that the House of Representatives changes over to Republican control has increased to 77% from below 30% at the beginning of 2009.

The reported economic data is certainly not suggesting strong growth. Slow growth is a potential outcome, but sentiment could change as the end of the year approaches. (This week will see some important economic reports with initial claims for unemployment reported on Thursday and non-farm payrolls reported on Friday.)


Thursday, August 26, 2010

Money Supply, Velocity and Economic Growth

A great deal has been written recently about the fact that the Fed's effort to provide for more liquidity in the financial system has really not produced much growth as bank's are holding the liquidity in excess reserves.

From The Blog of HORAN Capital Advisors

The importance of this has to do with the Quantity Theory of Money (QTM) which describes the interplay of nominal GDP, money supply and velocity. I wrote on this topic in early 2009 in a post titled, Money Supply Causing Concern With Future Inflation.

Recently though, the velocity of M2 and the YOY percentage change are showing increases. As the below charts do show, it is not uncommon for velocity to take some time to pick up following an economic recession.

From The Blog of HORAN Capital Advisors

From The Blog of HORAN Capital Advisors

As I noted in my post in 2009, the relationship between velocity, the money supply, the price level, and output is represented by the equation:
  • M * V = P * Y where
  • M is the money supply,
  • V is the velocity,
  • P is the price level, and
  • Y is the quantity of output.
  • P * Y, the price level multiplied by the quantity of output, gives the nominal GDP.
This equation can thus be rearranged as V = (nominal GDP) / M. Conceptually, this equation means that for a given level of nominal GDP, a smaller money supply will result in money needing to change hands more quickly to facilitate the total purchases, which causes increased velocity. In the QTM, velocity is assumed to be constant in the short run since it is not easy to manipulate. If the above equation holds and output is not quickly changed, prices will rise. Additionally, a rise in prices multiplied by an unchanged output will result in higher GDP. The question is whether or not there is demand for the output.

At HORAN Capital Advisors, we do believe the consumer demand side of the equation is being restrained for a number of reason, the uncertain regulatory environment, consumer deleveraging and high unemployment to name just a few. At HORAN we are cautiously optimistic that higher velocity is being realized and will lead to higher nominal GDP via an upward pressure on prices. GDP growth is likely not to be strong near term, but growth nonetheless.


Thursday, August 19, 2010

Inflation In The Pipeline

Of appropriate concern is the fact the economy could be entering into a period of deflation. The concern stems from the fact the Consumer Price Index continues to trend lower. As the below chart notes, the overall YOY change in the CPI is a little over 1% while the core CPI is near .9% (not shown.)

From The Blog of HORAN Capital Advisors

The inflation concern comes into play as its cause tends to be the result of a fall in overall demand. With high unemployment and thus lower anticipated consumer spending, the lower demand trend feeds into the bear case for the economy and the market.

A deflationary period would certainly have an impact on appropriate investment strategies for investors. In mild deflationary periods though, stocks tend to deliver fairly decent returns. More detail on stock returns in various inflation scenarios can be found in an earlier post I wrote titled, Where to Invest in an Inflationary Environment. The below chart details the average return for the S&P 500 during various inflation/deflation periods. The number in parenthesis represents the number of return periods for each range of inflation/deflation.

From The Blog of HORAN Capital Advisors
From a valuation perspective, looking at the price earnings ratio or PE, stocks will tend to trade at lower PE multiples in a deflationary environment; however, many of the high quality large company stocks are already trading at low PE multiples today.

At the end of the day then the relevant question is whether we are entering an inflationary or deflationary cycle. As the below table shows, inflation does appear to be entering the supply chain at the producer level. Argus Research notes:
"...Producer Price Inflation for finished goods has increased at a 4.2% rate over the past year through July. This is higher than consumer inflation, and up month-to-month from 2.8%. Deeper in the production pipeline, pricing pressures are even more pronounced. For intermediate and crude goods, prices have jumped 6.4% and 20.5%, respectively, over the past year...."
From The Blog of HORAN Capital Advisors

Deflation concerns certainly warrant watching; however, in mild deflation periods, there are investment categories that can generate profits for investors. From a PPI perspective though, inflation pressures appear to be bubbling up in the producer level of the economy. This higher producer price pressure often leads to higher consumer prices; hence, a potential counter to the deflation case.


Tuesday, August 17, 2010

Business Activity Actually Strengthening

Today's release of the industrial production and capacity utilization data ("V-shaped" recoveries?") indicated an improvement in manufacturing activity. Industrial production rose to 93.4% and exceeded expectations of 93%. Although motor vehicle production was up 10%, the Federal Reserve release notes indicate:
...manufacturing production excluding motor vehicles and parts advanced 0.6 percent. The output of mines rose 0.9 percent, and the output of utilities increased 0.1 percent.
From The Blog of HORAN Capital Advisors

In addition to an improvement in industrial production, the Federal Reserve reported an increase in capacity utilization. Capacity utilization increased to 74.8% versus expectations of 74.5%.

From The Blog of HORAN Capital Advisors

The demand for truck drivers is on the increase with driver shortages now a reality. In essence, these trucks are not driving around empty and are supporting the distribution of more goods due to the improving economy. This improving anecdotal evidence seems to indicate an environment where the economy is improving.


Wednesday, August 11, 2010

Cisco Comments Indicative Of Economy That Is Just Bumping Along

Cisco's (CSCO) earnings release and comments after the market close is indicative of an economy that is just bumping along with weaker growth. See the August 2010 comment that Chambers today. The forecasting foresight of John Chambers during other significant economic turning points and pulled together by Reuters is outlined below.

I do believe we will be in this uncertain economic environment until there is more clarity on the regulatory and tax environment that is coming out of Washington. This may not be visible until November; however, the market is pretty good at predicting what the future holds and is likely to react a month or two in advance of November.
CHRONOLOGY-Cisco CEO John Chambers' comments on the economy
6:42 PM Eastern Daylight Time Aug 11, 2010

NEW YORK, Aug 11 (Reuters) - Cisco Systems Inc Chief Executive John Chambers said there was "unusual uncertainty" in the economy and gave a revenue forecast that was below Wall Street expectations, sending shares tumbling. Chambers, one of Silicon Valley's longest-serving executives, is considered a good reader of industry trends. He was one of the first executives to flag the impact of the financial meltdown on the technology sector in late 2007.

Here are some of Chambers' comments in recent years.

AUG 2007
"I have been in this business for 30 years ... It's the strongest global economy I have been a part of."

NOV 2007
Chambers warned of "dramatic decreases" in orders from U.S. banks.

FEB 2008
Chambers said orders slowed rapidly from December to January in the United States and Europe. "It's the most cautious I've seen CEOs in the U.S. and Europe in many years."

MAY 2009
On customer sentiment: "You can call it stability, you can call it leveling out ... for the first time many of them feel something solid beneath their feet as opposed to going into deeper and deeper water."

FEB 2010
"In our opinion Q2 marked the second phase of the recovery with additional across-the-board acceleration -- in other words, balance across the board -- in all of our geographies and market segments."

MAY 2010
"Given all the uncertainties regarding the strength and shape of the recovery, concerns about the recovery possibly slowing and the unknown extent of job creation, we encourage you to wait for additional economic data before becoming too optimistic."

AUGUST 2010
"We are seeing a large number of mixed signals in both the market and from our customers' expectations, and we think the words 'unusual uncertainty' are an accurate description of what is occurring."
In this environment, equity investors should focus on higher quality companies that have strong cash flow and lower debt levels. Many of these companies pay growing dividends and hold up better during down market periods.


Tuesday, August 10, 2010

Wholesale Inventory to Sales Ratio Near All Time Low

One area businesses have focused on is not getting stuck with high inventory levels in the event the economy takes a double dip. At this point in time, at HORAN, we are not in the double dip camp.

As the below chart details, the wholesale inventory to sales ratio is near a record low at 1.15:1.

From HORAN Capital Advisors

If we continue to see an improving trend in consumer sentiment, sales activity would likely improve.

From HORAN Capital Advisors

This higher demand on inventory at a time when inventories have been reduced may lead to upward pressure on selling prices. Today it was noted that Wal-Mart (WMT) has been raising prices by an average of 6% in some markets. The company cites lower sales as the reason; however, one wonders if tight supplies are driving the pricing decision as well.

On Friday retail sales and business inventories will be released. Business inventories are expected to increase .2% and retail sales are expected to be higher by .5%. This would result in a decline in the business inventory to retail sales ratio. The detailed report can be found on the U.S. Census Bureau/Department of Commerce website.


Sunday, August 08, 2010

Earnings In Q2 Still Strong, Forward PEG Less Than 1.0

Earnings for the S&P 500 Index in the second quarter continue to exceed expectations.

From HORAN Capital Advisors
According to Thomson,
  • Of the 443 companies in the S&P 500 that have reported earnings to date for Q2 2010, 75% have reported earnings above analyst expectations.
  • The blended earnings growth rate for the S&P 500 for Q2 2010 is 38%.
  • The forward four-quarter (Q3 2010 – Q2 2011) P/E ratio for the S&P 500 is 12.7, below the average forward four-quarter P/E ratio of the previous 52 weeks (14.2).
From HORAN Capital Advisors

The forward PE to earnings growth rate (PEG) for the S&P 500 Index is .77. This is arrived at by calculating the earnings growth rate from CY 2010 to CY 2011 and dividing the result into the estimated CY 2011 P/E of 11.7.


Saturday, August 07, 2010

Emotions Can Lead To Poor Investment Returns

Benjamin Graham, often referred to as the father of value investing, once said,
"Individuals who cannot master their emotions are ill-suited to profit from the investment process."
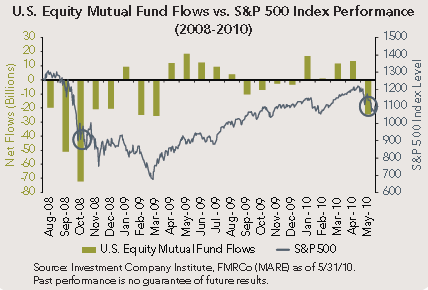
Graham's quote was alluding to the fact that individual investors tend to make incorrect investment decisions when they let their emotions overtake investment discipline. Behavioral finance has shown that investors have a much stronger preference for avoiding investment losses than they do investment gains. As a result, this bias against losses causes investors to sell an investment after the investment has already incurred substantial loss. A recent article in the Financial Analyst Journal, titled Relative Sentiment and Stock Returns ($), provides research supporting this conclusion.

The below chart details mutual fund equity flows relative to the performance of the S&P 500 Index. As the chart shows, equity outflows are at their greatest near the bottom of market cycles.

From The Blog of HORAN Capital Advisors

The impact on investors' investment returns due to this behavioral bias is lower overall investment returns. During the height of the financial crisis in late 2008 and through 2010, investors who maintained their exposure to stocks through the crisis have generated a higher level of return than those who sold all their stocks and stayed out of the market or those that sold all of their stocks and jumped back into the market.

From The Blog of HORAN Capital Advisors

Because of the tendency for individual investors to let emotions influence investment decisions, at HORAN we review various sources of sentiment data on an ongoing basis. In last week's individual investor sentiment report released by the American Association of Individual Investors, it shows bullish sentiment fell over nine percentage points to 30.4%. Bearish sentiment increased to 38.2% versus the prior week's bearishness level of 33.3%. A result is the bull/bear spread was reported at -7.9% versus the prior week's spread of 6.7%.

From The Blog of HORAN Capital Advisors
In concluding, investors should use this behavioral knowledge to review ones appropriate asset allocation and risk tolerance. Additionally, investment decisions should be grounded in a disciplined process to reduce the likelihood of making decisions that can harm overall investment returns. Also, choosing an investment approach that has its foundation built on lower volatility, especially in down markets, can reduce the feelings that influence ones emotions during volatile market periods.

Source:

Defending Your Investment Brain
Market Analysis, Research & Education
Fidelity Management & Research Company
July 29, 2010
http://personal.fidelity.com/products/funds/content/pdf/defending_your_investment_brain.pdf


Tuesday, August 03, 2010

Dividend Payers Achieve Strong Performance Through July

The dividend payers in the S&P 500 Index continue to generate strong performance through the month of July. On a year to date basis the payers are outperforming the non-payers 4.53% to 1.46%, respectively. For the 12-month period the payers are outperforming both the non-payers and the S&P 500 Index.

The payer/non-payer performance is calculated on an average basis while the S&P returns in the below table are on a weighted basis. As noted in an earlier post, equal weighted holdings in the S&P Index have outperformed the market cap weighted holdings. This seems to be playing out with the dividend payers as well.

From The Blog of HORAN Capital Advisors