Showing posts with label International. Show all posts

Saturday, January 09, 2021

Broadening Participation In Equity Market Asset Classes

One favorable aspect of the recent equity market performance is the broadening participation of asset classes other than the large cap FANGMA stocks, Facebook (FB), Amazon (AMZN), Netflix (NFLX), Google (GOOGL), Microsoft (MSFT) and Apple (AAPL). As the below chart shows, during the first eight months of 2020, the average return of this basket of stocks significantly outpaced the other asset classes shown on the chart.


Sunday, December 29, 2019

Just Own Something: Hyman & McLennan Global Outlook Part 2 Interview

Consuelo Mack of WealthTrack conducts Part 2 of her interview with Ed Hyman, Vice Chairman of Evercore and Matthew McLennan of First Eagle Investment Management. I published highlights and a link to Part I of the interview last week that focused on the U.S. outlook and below is the link to the Part 2 interview that focuses on the Global outlook. Not surprisingly, China gets a lot of attention from Ed and Matt, but Ed Hyman is cautious on the outlook for China, i.e., growth but slowing growth. Ed does not believe China and trade issues are a game changer to his positive 2020 outlook.


Sunday, October 13, 2019

A China Trade Deal: Reset Higher In Market And Economic Expectations

The equity market ended this past week on an upbeat note, reacting positively to a China/U.S. trade deal. In looking at the Dow Jones Industrial Average Index, it gapped higher by 197 points at the open on Friday and was up as much as 517 points until late in the day. The below chart shows the S&P 500 Index and a similar gap higher open occurred Friday.


Friday, December 07, 2018

Trying To Make Sense Of China/US Trade Issues

What seems to be influencing the market the most at the moment is the trade issues with China and the U.S. Jeff Miller who writes at the Dash of Insight blog published a short article yesterday that seems to get to some of the main issues surrounding trade and the equity markets. A couple of highlights from the article follow, but the entire post is a worthwhile read. Jeff notes the market's reaction is,
"a typical example of the trading community’s failure to understand politics, negotiation, and compromise. I have highlighted this before on issues like Greece and the asserted collapse of Europe and concerning various US policy debates."
He notes further,
Here is what to expect:
  • Decades of history will not be reversed in a few months. Be happy for some progress.
  • The outcome will be a compromise. It will not be a complete success for either side, but each will trumpet what they have accomplished.
  • Nothing big will happen until the last minute. This is the way that partisans demonstrate they have accomplished as much as possible.
  • Eventual relief on the most important reciprocal tariffs.
  • Some progress on the intellectual property issues.
  • Some immediate relief on existing boycotts, e.g. soybeans.
The entire post can be read here: China/US Trade – Finding a Signal Amidst the Noise


Sunday, November 11, 2018

Dollar Defies The 7-Year Cycle

Historically the U.S. Dollar has had a tendency to exhibit strength over a 7-year cycle. In July of this year the Dollar strength cycle crossed into its eighth year though, as seen in the below chart.


Tuesday, October 30, 2018

Emerging Markets: An Opportunity?

For a period of time this year, the U.S. equity market avoided the weakness that was occurring in many other equity markets around the world. October has certainly changed this though. As can be seen below, the S&P 500 Index is in correction territory now, i.e., down greater than 10% from its high at the end of September.


Saturday, August 11, 2018

Is Korea Equity Market Weakness A Precursor To Weakness In U.S. Markets?

About a year ago I provided an update on the Korea Stock Exchange Index (KOSPI) and the fact it can serve as a leading indicator to U.S. equity market performance. As noted in that earlier post, I referenced noted economist, Ed Hyman of Evercore ISI, who believes the KOSPI index is a leading indicator of the global economy as South Korea's exports account for over 40% of the country's gross domestic product. In other words, the KOSPI Index performance is a reflection of the health of the global economy. Also worth noting is the largest sector weighting in the KOSPI index is the technology sector, accounting for over 40% of the index weight. The below chart compares the KOSPI index, in US Dollars, to the S&P 500 Index. Since early June the performance of the KOSPI Index has diverged to the downside versus the S&P 500 Index. Even with the KOSPI priced in Won a similar divergence is seen.


Some of the weakness may be attributable to investors reducing emerging market positions in ETFs like the iShare MSCI Emerging Market Index (EEM) as Korea remains classified as an emerging market country and makes up about 14% of the index. China is the largest weighting at 32%. The EEM ETF has experienced outflows of nearly $5 billion since June 1. Last week though, EEM had inflows of about $178 million.

Some of the weakness in the Korean market might be related to tariff issues. The Trump administrations comments about increasing tariffs on more Chinese exports is being felt in other Asian countries. However, economically, the Korean economy is continuing to expand, but higher tariffs could have a negative spillover impact on their economy.


Monday, November 06, 2017

Investment Opportunities Outside The U.S.

In a post yesterday I somewhat rhetorically titled the post wondering if the equity market was at a top. In short, I do not know, but offered suggestions for investors about reviewing their asset allocation vis-à-vis their spending needs.

Not all markets have traveled the same path as the S&P 500 Index though. A number of markets outside the U.S have lagged the U.S. since the end of the financial crisis. The below chart compares the cumulative performance of the S&P 500 Index (SPY) versus the MSCI ACWI ex U.S Index (ACWX). The chart goes back to the beginning of 1992 and clearly the S&P 500 has a performance advantage with a widening gap beginning to develop around 2011.


Saturday, October 28, 2017

Sizable Declines In A Few Individual Stocks; Time To Review Allocations

Much is going right as it relates to the equity markets around the globe; however, this past week saw the market punish companies that reported earnings that did not match market expectations. The below 2-week chart only lists a few of those companies, but companies like Celgene (CELG) down 28.1% and Expedia (EXPE) down 17.5% suffered much of their losses on one or just a few trading days.


Saturday, October 14, 2017

Synchronized Global Growth

Much of the sentiment and global market data continues to come in on the positive side of the ledger. Friday's University of Michigan Consumer Sentiment jumped six points to 101.1 for October and is the highest reading in thirteen years. As reported by Econoday, "The expectations component is up nearly 7 points to 91.3 with the component for current conditions posting a nearly 5 point gain to 116.4."


In reviewing the Global PMI's for Manufacturing, as of the end of September, the below table shows all of the PMIs are in excess of 50 which suggests improvement versus deterioration in the manufacturing sector. PMI's are leading indicators with health in the manufacturing sector providing insight into sales, employment, etc. The common surveyed questions center on new orders, manufacturing output, employment, suppliers' delivery times and inventory.


The positive sentiment and economic data has translated into positive equity market returns around the world. All of the 45 country Exchange Traded Funds (ETFs) at the following link are showing positive returns year to date through October 13, 2017.

The economy is not the market and vice versa; however, the positive sentiment and positive economic data currently being reported is translating into higher equity market prices. The lack of market volatility is certainly something that will not persist forever. Maybe the Fed's desire to reduce its balance sheet will result in higher equity market volatility. A correction or pullback near term would be healthy, noting the average intra-year pullback is just over 14%.


Wednesday, September 27, 2017

A Recession And Equity Market Bubble Five Years Ago Did Not Materialize, Now What

I was communicating with a client today who reminded me of a conversation we had five years ago almost to the day about whether or not the U.S. equity market was in a bubble. The discussion was prompted by the USA Today article, Consumer Sentiment Stat Hints that Bull Market May be Stalling Out, that highlighted a data point from the recent University of Michigan Sentiment Survey. In the survey it was noted that 65% of individuals surveyed believe stock prices rise over the next twelve months. This is a high level for the survey and a contrarian data point for stocks. The conclusion from that 2012 conversation was equities were attractive and our firm wrote as much in our third quarter 2012 newsletter. Additionally, I shared a Fidelity white paper, U.S. Equities: Light At The End Of The Tunnel. An interesting read in retrospect.

Much was occurring in 2012 with the 10-year Treasury yield below 2% and the Federal Reserve providing massive monetary support (QE) to the economy, i.e., buying $40 billion of mortgage bonds each month. This was occurring on the back of an equity market that was up 100% from the March 2009 low to June 2012. Both print and television financial commentary at the time was intimating concern for the markets.


A CNN Money article from September 2012 was titled, Stocks End Week At Multi Year Highs. In the article a link was provide to, Are Investors Getting Too Greedy which referenced CNN Money's Fear & Greed Index that was flashing an extreme Greed level of 93. Several weeks later and into the first week of October 2012, Sam Zell, Chairman of Equity Group Investments, stated in an interview on CNBC, "We're heading for a recession and that's exactly what you're looking at now."

Five years after 2012 to today and following all the consternation about bubbles, corrections and recessions, the U.S. equity market (S&P 500 Index) is up an additional 87% and the economy has avoided a recession. Certainly the period from 2015 through the third quarter of 2016 was a choppy one with the S&P 500 Index trading mostly sideways for almost two years. But so far in 2017, U.S. stocks seem to know only one direction and that is up, with the S&P 500 Index returning just under 13% on a price only basis with very little downside volatility


Raising the bubble question now is even more appropriate today then it was five years ago given how far the equity markets have risen over the last five years. Also, market data is decidedly different and is summarized below. Some of the data was taken from the earlier cited Fidelity white paper. If any variable in the below table jumps out at readers, it should be the higher valuation of the S&P 500 Index based on the price earnings ratio or P/E, 56.5% higher, while earnings are higher by only 17.5% during the same time period. In other words, the market advance over the last five years has largely been supported by multiple or P/E expansion. Sentiment data is also more bullish at the moment, but not at a level that has historically been associated with a bear market type downturn.


Certainly given current market valuation levels, earnings growth will be important for strong S&P 500 Index returns as we look ahead. Twelve month trailing earnings as of June 2017 does capture the energy weakness in 2012; however, when evaluating the year over year June 2017 to June 2018 estimated operating earnings growth rate for the S&P 500 Index, earnings growth is expected to equal about 18% and in line with the forward P/E. On a calendar year basis, comparing 2018 to 2017, earnings growth is expected at a respectable low double digit growth rate.

In a couple of recent posts I have noted the Fed's desire to actually begin withdrawing liquidity from the market and they announced as much in last week's Fed statement with a start date beginning next month. An old adage that gets repeated around Fed accommodation changes is, 'don't fight the Fed'. Just as the Fed has been supply liquidity since the onset of the financial crisis, and this has likely had some positive impact on asset prices, withdrawing liquidity can be disrupting on the way out. We will be on guard for potential asset price volatility, but will note, historically, stocks have been positively correlated to the rate moves when they occur below 5%.

In summary, we were strongly bullish in 2012 given equity valuations and a high equity risk premium. We do not expect a recession near term, but believe today that more pressure falls on companies to generate earnings growth, which we do think is likely, but probably not a market where a rising tide raises all boats.


In client accounts we have reduced some equity investments where we believe earnings growth is more challenged  and taken profits in some stocks that have moved higher and gotten ahead of valuations. At the same time, we have allocated equity investments to developed and emerging international markets over the last 18-months or so. This allocation adjustment has been a positive for clients and we continue to find valuations outside the U.S attractive.


Saturday, April 22, 2017

Emerging Markets Poised To Outperform

In our Spring 2017 Investor Letter we briefly commented on first quarter investment changes we initiated in client accounts, specifically, adding exposure to emerging markets. Expanded commentary follows on some of the rational for this change. Simply because an asset class or stock is cheap does not necessarily suggest the asset should be purchased; however, valuation does tend to matter in the long run. The below chart was referenced in our Spring Investor Letter and the top pane of the chart shows the relative valuation of the MSCI Emerging Market Index versus the S&P 500 Index favors emerging markets.


Additionally, when comparing the forward earnings growth expectations for emerging market equities and S&P 500 equities, emerging market companies that comprise the MSCI Emerging Market Index are expected to grow earnings nearly three times faster then S&P 500 companies.


With respect to emerging markets, their prices seemed to be discounting the improvement taking place in global economies and the consequent benefit that should accrue to emerging market economies and thus emerging market stock prices themselves. Certainly, if global trade slows significantly, emerging market economies will be negatively impacted. However, our firm's view is developed economies will continue to grow over the next several years, even if at a below trend pace, and emerging economies will benefit. As the below chart shows, GDP growth in the emerging and developing economies has started to turn higher indicating a faster pace of economic growth than advanced or developed economies.


This faster pace of economic growth tends to persist over multiple years. As a result, some investors are beginning to recognize this as emerging market equity performance on a year to date basis is outperforming a number of developed markets as can be seen in the below chart.


This recent outperformance is occurring at a time when emerging markets have underperformed the U.S. market on a rolling 3-year annualized basis for the past five years. The second chart below shows the rolling 1-year returns versus the S&P 500 Index and the rolling 1-year returns have begun to favor emerging markets in 2017.


In investing, there are no certainties; however, with global economies seeming to become more synchronized with respect to economic growth, emerging markets could have a performance advantage over developed markets over the course of the next several years.


Saturday, December 10, 2016

Emerging Markets, The Dollar and Interest Rates

This morning I published a few tweets and charts on our Twitter site reviewing emerging market equity performance and the impact US Dollar strength has on emerging market equity performance. Additionally, interest rates influence US Dollar movement and rising interest rates tend to result in a stronger Dollar, all else being equal. Below are those tweets.


I frequently provide market relevant tweets throughout the week so feel free to follow our firm on Twitter @HORANCapitalAdv. At the same time, readers may want to follow our broader firm, HORAN on twitter as well @HORAN1948. For over 65 years HORAN has created plans to control health care costs, protect your wealth and insure your life. But the end game for all that we do at HORAN is more than a set of plans. We believe good health and true wealth create a better quality of life for our clients and their families.


Sunday, September 25, 2016

The Risk Of Dismissing The Data: The TED Spread And Baltic Dry Index

No single variable or statistic provides clear insight into the future direction of the economy or stock market. When a data point does not fit ones narrative though, justification to eliminate it seems to be gaining among some strategists. Recently, the market has seen a fairly significant spike in LIBOR and a resultant increase in the TED Spread, i.e., 3-month LIBOR minus 3-month Treasury.


Saturday, June 25, 2016

BREXIT Inspired Equity Pullback: The World Is Not Coming To An End

Much is being written regarding the impact of the United Kingdom's exit from the European Union and all the conclusions lead to uncertainty. It is the uncertainty equity markets do not handle well, thus, the sell off on Friday. One conclusion I believe is certain is the world will not come to an end and business will continue to be conducted between EU and non-EU countries. This is a wakeup call for the EU and its seemingly unending promulgation of rules and regulations that seem to favor some EU member countries over others. On paper the formation of the EU seemed like a good idea; however, a monetary union without a fiscal union has led to a lack of spending discipline by some countries. And, no real spending discipline is a symptom not only of EU countries, but with non-EU countries as well. The United States can be included in the 'no discipline' crowd too. Our firm will have more commentary on the Brexit outcome later.

The damage done to global equity markets on Friday is pretty clear. The Nikkei was down 7.9%, S&P 500 Index down 3.6%, the Dow down 3.4%, the French CAC Index down 8.0%, Spain's IBEX 35 Index down 12.35% and the UK's FTSE 100 Index was down 3.2%. The unknown is what additional weakness can be expected in global equity markets over the next weeks and months ahead. In earlier blog articles, I have noted past crisis events and their duration and time to recover. Below is a chart from a June 28, 2015 post.

From The Blog of HORAN Capital Advisors

Some of the crisis influenced market declines bottomed after one day while other declines took place over a longer period of time. The average decline in terms of days was six with an average return of -5.3%.

The sentiment technicals for the S&P 500 Index are indicating fear is elevated. Historically, when the fear measure like the VIX is elevated or the equity put/call ratio is above one, these levels have coincided with near market bottoms. The first chart below shows the CBOE Equity Put/Call ratio spiked above 1.0 on Friday.


The VIX futures went into backwardation on Friday as well. VIX backwardation refers to the situation when the near-term VIX futures are more expensive than longer-term 3-month VIX futures (VXV). This is an indication traders expect volatility in the future to be lower than it is now. Historically, when this occurs, short term market rallies tend to result from this technical event.


The other sentiment measure that is indicative of an oversold market is the ratio of the VIX to the 10-year U.S. Treasury yield. The low level of the denominator of this ratio, the 10-year Treasury yield, is indicative of a slow growth economic environment and investors' propensity for risk off assets; hence, driving the yield lower. The numerator, the VIX, is elevated thus, an indication of investors' fear of the equity markets.


An expected certainty in this Brexit inspired uncertainty is the fact the markets will continue to be volatile. Of importance is whether or not this event pushes Europe into a recession and drags the U.S. into one along with it. What makes this a heightened issue is the slow, bump along growth, of the U.S. economy and the slow economic growth globally. The added uncertainty is whether or not Brexit leads to additional EU countries taking steps like the UK's and then the ultimate breakup of the EU. The world is not coming to an end and this Brexit induced equity market pullback will likely provide investors with a buying opportunity in equities that have been unduly punished.


Monday, May 30, 2016

An Allocation To International Small/Mid Cap Equities

One aspect that has faced investors over the past five years is the fact diversification has detracted from a mostly large cap U.S. equity allocation. Investments in high yield bonds and emerging markets generated negative returns, while investments in the NASDAQ and S&P 500 Composites resulted in double digit annualized returns over the most recent five year period.


Saturday, February 27, 2016

Are Emerging Markets The Trade Of The Decade?

In recent days, more strategists are indicating the emerging market asset class is providing investors with a 'trade of the decade" opportunity. The most recent is Robert Arnott and Christopher Brightman of Research Affiliates when they note in their February All Asset report,
"Many investors mistake a bear market for diminished prospective returns. From the rear-view mirror, the bear market in emerging markets has been painful. When we look out of the windshield, however, these very asset classes offer the highest potential returns (as of 12/31/2015 their 10-year expected return is 7.9%) available to today’s opportunistic investor. So, the exodus from emerging markets is a wonderful opportunity – and quite possibly the trade of a decade – for the long-term investor."
Certainly, the below chart shows the underperformance of the MSCI Emerging Markets Index versus the S&P 500 Index.


For investors interested in increasing emerging market exposure, they will want to evaluate the potential impact of further US Dollar strength due to the negative impact a strong Dollar has on emerging market performance.


Historically, Dollar strengthening moves have trended in a 7-year cycle. As the below chart shows, the most recent Dollar move has been running for about four and a half years. If the seven year pattern holds, continued weakness in emerging market performance may persist. Admittedly, a lot of the Dollar strengthening move has occurred; however, with the Fed interested in continuing to normalize interest rates, higher U.S. rates would likely provide some tailwind for additional Dollar strength.


Sunday, January 17, 2016

Ed Hyman And Dennis Stattman On Their International Outlook

Earlier this week Consuelo Mack of WealthTrack conducted Part II  of her interview (Part I highlighted last week) with legendary economist Ed Hyman, Chairman of Evercore ISI, and Dennis Stattman, fund manager on BlackRock's Global Allocation Fund. This interview occurred after the market weakness experienced during the first week of January so both guests were aware of the early year market contraction.

Ed Hyman believes the global issues facing economies are a result of growing too slowly and attributes this to the slowdown in China. This below potential growth rate leads to potential deflation and he cites the issues within the commodity sectors. His favored international market is Europe, but does acknowledge the benefits taking place in Japan after nearly 25 years of no growth in that country. He does believe China is the key for the broader emerging market arena and does think China's economic policies are moving in the right direction, i.e., getting growth in consumer demand and moving away from fixed asset investment. He cites good China sales data from Apple and Alibaba. His biggest worry is the issues in the Middle East as a result of the decline in oil prices and the negative impact this has on revenues for those countries.

Dennis Stattman is a pound the table bull on Japan. He notes that earnings growth and dividend growth for Japanese firms has left price earnings ratios for Japanese companies nearly unchanged. He cites Japan is the only major area where earnings revisions are positive. He does worry about the debt growth in China and the slowing of GDP growth in the country. Dennis' biggest worry is China experiences a large decline in tts currency and that adjustment negatively impacts other emerging markets. He believes a world of quantitative easing, asset prices in the QE countries inflate and economies do benefit. Hedging the currency exposure is an important factor for individuals investing in Japan though.

As with the Part I interview, this is a worthwhile viewing for readers.


Sunday, January 10, 2016

Ed Hyman: Halfway Through Current Expansion Cycle

Ed Hyman, Chairman of Evercore ISI, and rated the number one economist for 35 consecutive years by Institutional Investor, recently sat for Part One of a two part interview with Conseulo Mack of WealthTrack, which was aired a few days ago. Also participating in the interview was Dennis Stattman, the Portfolio Manager of Blackrock Global Allocation Fund.

Hyman pointed out many positives he has witnessed in his travels around the country and gleaned from Evercore ISI's business surveys. In short, Ed Hyman believes the U.S. economy is only halfway through its current expansion. He believes the consumer, employment and now broadly rising wages are some factors that continue to support slow but steady U.S. economic growth. The interview does point out his concerns as well.

Dennis Stattman on the other hand, believes greater opportunities for investors can be found in non-U.S. markets. His concern is the U.S. economy and market growth have been largely supported by the Fed's quantitative easing programs. The U.S. market began to stumble last year once the Fed pulled back on its QE endeavors. Additionally, Dennis Stattman believes U.S. firms will find it difficult to grow profits in an environment where corporate profits as a percentage of GDP are at historically high levels. Dennis did not say this, but if one believes QE inflated U.S. equity prices, the European Central Bank and Bank of Japan continue to implement QE strategies.

The interview runs about 30 minutes and is a worthwhile viewing for readers. I will post Part Two when available, likely next weekend.


Tuesday, October 06, 2015

Dollar Strength Continuing Headwind For Emerging Market Equities

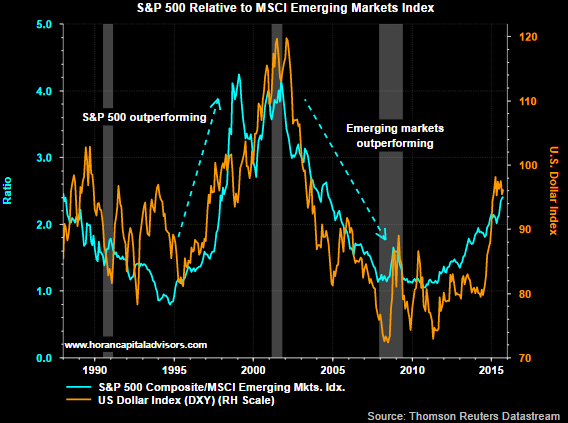
Since mid 2011 emerging market equities began to underperform the U.S. equity market (S&P 500 Index). Earlier this year we noted in a post, Emerging Markets Not Out Of The Woods Yet, the headwind a stronger U.S. Dollar can have on emerging market equity performance. The updated chart below continues to show the accelerated strengthening of the Dollar (orange line) and the underperformance of the MSCI Emerging Markets Index relative to the S&P 500 Index.

From The Blog of HORAN Capital Advisors

The U.S. Dollar tends to move in an average cycle of about seven to eight years and this cycle is about four years old. A number of factors can contribute to a stronger Dollar. One factor is a higher interest rate trend in the U.S. and the Fed's desire to raise rates continues to place an upward bias on the Dollar. 

Investors seem to be taking note of the headwind facing the emerging markets as ETF fund outflows have accelerated. Today, in a Bloomberg report, it was noted,
  • Outflows from U.S. exchange-traded funds that invest in emerging markets more than doubled last week, with redemptions exceeding $12 billion in the third quarter.
  • Withdrawals from emerging-market ETFs that invest across developing nations as well as those that target specific countries totaled $566.1 million compared with outflows of $262.1 million in the previous week.
  • The losses marked the 13th time in 14 weeks that investors withdrew money from emerging market ETFs and left the funds down $12.4 billion for the quarter, the most since the first quarter of 2014, when outflows reached $12.7 billion. For September, emerging market ETFs suffered $1.9 billion of withdrawals.
As difficult as it can be to predict currency moves, getting the directional call correct will likely be a factor that influences emerging market returns over the next several years. A stronger Dollar will serve as a headwind and a weaker one could be a positive for emerging market equities.