Thursday, November 28, 2013

Market Advance Below Average In Return And Duration

Investors and market pundits have been expressing cautiousness of late about the near uninterrupted advance of the U.S. equity market. This climb higher has been in place since the end of the financial crisis in 2009. I discussed this strong move higher in a post at the beginning of November that included the below chart.

From The Blog of HORAN Capital Advisors

In looking at the chart it seems rational to believe the advance is getting long in the tooth as they say. However, in a recent strategy article written by Liz Ann Sonders, Chief Investment Strategist at Charles Schwab, she notes how this advance is really not that long in duration relative to prior bull markets. Additionally, her article notes from a return perspective, on a rolling ten year basis, the S&P 500 index return is just below average. And, the market return, on the upside or on the downside, generally overshoots the average as can be seen in the below chart.

From The Blog of HORAN Capital Advisors

In an effort to put this in perspective her article included the below chart comparing the length and magnitude of prior S&P 500 bull markets and this one has been just an average one.

From The Blog of HORAN Capital Advisors

Another chart by the Chart of the Day charting services notes prior bull market advances and duration for the Dow Jones Industrial Average. Included with their recent chart is the following commentary.
"The Dow just made another all-time record high. To provide some further perspective to the current Dow rally, all major market rallies of the last 113 years are plotted on today's chart. Each dot represents a major stock market rally as measured by the Dow with the majority of rallies referred to by a label which states the year in which the rally began. For today's chart, a rally is being defined as an advance that follows a 30% decline (i.e. a major bear market). As today's chart illustrates, the Dow has begun a major rally 13 times over the past 113 years which equates to an average of one rally every 8.7 years. It is also interesting to note that the duration and magnitude of each rally correlated fairly well with the linear regression line (gray upward sloping line). As it stands right now, the current Dow rally that began in March 2009 (blue dot labeled you are here) would be classified as well below average in both duration and magnitude. However, the magnitude of the current post-financial crisis rally has now reached median status -- its magnitude is greater than six and less than six Dow rallies since 1900."
From The Blog of HORAN Capital Advisors
 
The Schwab article contains several interesting tables noting criteria that historically have been present that would signify a market top. Many of these criteria are not present today. She also notes a 5-10% correction would not be out of the norm and in fact writes,
"My bottom line is that I continue to hope for a pullback here in the near-term to alleviate some of the frothiness that's crept in and keep the bull market going. But I continue to fear a melt-up. Why "fear?" As good as they feel while they're happening, they don't end well."


Tuesday, November 26, 2013

Active Stock Selection Outperforming

Year to date, the S&P 500 Index is up over 26%. Investors have enjoyed a strong rally with this calendar year nearing an end. If an investor has been invested in the equity market from the beginning of the year, in total, losing money would have been difficult. How does one beat a market that has run so much? Pick the right stocks.

In today's market, it has increasingly paid to be a stock picker as opposed to indexing ones portfolio. Beating the market is certainly not an easy task in today’s technologically driven market. However, 57% of actively managed funds are beating their respective benchmarks in 2013. This is a strong performance versus the historical norm of 37% of managed funds outperforming their benchmark. Typically, a stock picker's market begins to unfold in an extended bullish environment where the market starts to distinguish between stocks within sectors that will continue to drive the market higher and those that will lag. This has begun to occur with the close of the third quarter earnings season.

An additional form of evidence for a stock picker's market comes from looking at the percentage of S&P 500 stocks trading above their 200 day moving average. This indicator is one of many measures providing an indication of the overall health of the market. The higher the percentage, the healthier the market. A stock is said to be in an uptrend once it begins to trade above its 200 day. The chart below illustrates the percentage of stocks in the S&P 500 trading above their 200 day moving average year to date.

11 26 2013 200 day

As the chart shows, since mid-May, this measure has dropped from 94% to 82.40%. While it is easy to make the case of weakening in the “broader” market, one can also view this as a healthy re-balancing or rotation into other stocks. Stocks remain in uptrends as noted in our article posted Saturday and there seems to be plenty of opportunities for longs. An interesting observation is the S&P 500 has still managed to deliver new highs although the percentage of stocks trading above their 200-day moving average has decreased. From a cautionary perspective, this decrease in the number of stocks trading above their 200 day M.A. can be a signal the market is losing some momentum. So far this year though, active investors have broadly generated better returns than their passive ones.


Sunday, November 24, 2013

QE's Influence On Equity Prices

One debatable issue with the Fed's quantitative easing (QE) program is whether or not the QE activity has an impact on equity prices. In a recent McKinsey & Company study, QE and ultra-low interest rates: Distributional effects and risks, McKinsey concludes,
"We found little evidence that ultra-low interest rates have boosted equity markets. We cannot discern a large-scale shift into equities as part of a search for yield by investors, and price-earnings ratios and price-book ratios in stock markets are no higher than long-term averages. Although stock prices do react to announcements by central banks, these are transitory effects that do not persist."
If a picture is worth a thousand words, then the below chart seems to suggest QE has positively influenced equity prices.
From The Blog of HORAN Capital Advisors

If QE has had a positive impact on equity prices, the next question becomes what happens when the QE program comes to an end. The recent focus has been on the timing of the Fed "tapering" its purchases. Tapering is still QE but simply in a lesser amount; hence, supportive of equity prices if one believes a positive correlation exists.


The Week Ahead Magazine: November 24, 2013

The equity market has been on a steady advance since after the election last year. And actually this market recovery has been in place since the end of the financial crisis in 2009. As noted in our blog article on Saturday, a market correction of 10+% has not occurred for more than 500+ trading days. A number of the articles contained in this week's magazine highlight the strength of the equity market as well as highlight the potential rotation out of bonds into equities that is taking place. Slowly rising market interest rates are serving as one tailwind that may be pushing equity prices higher.


Saturday, November 23, 2013

Waiting For A Correction?

One interesting aspect of this bull market run for the S&P 500 Index has been the absence of a 10+% correction.

From The Blog of HORAN Capital Advisors

It seems on a daily basis the talking pundits on business news channels and in print are certain an equity market correction is just around the corner. For those investors under invested in equities, a correction would certainly be a welcomed event. Market corrections, however, are hard (if not impossible) to predict and when they do occur, they tend to surprise investors. As the below chart of market advances without a 10% correction shows, it is not uncommon for the market to move higher without significant pullbacks.

From The Blog of HORAN Capital Advisors

As noted in the Bramesh article,
  • from March 2003 to October 2007 (the entire length of the last bull market), the index went 1,153 trading days without experiencing a 10% correction.
  • the longest streak on record without a 10% correction was from October 1990 to October 1997, and that lasted 1,767 trading days.
  • if the current streak matched the 1990 to 1997 streak, this bull market would run to October 1, 2018, nearly five years from now.
The other factor that seems to be preventing a so called market "melt up" is investor sentiment has not become overly bullish. In the sentiment survey release by the American Association of Individual Investors earlier this week, bullish sentiment actually feel 4.8 points after falling 4.3 points in the prior week. Investors should keep in mind though, sentiment indicators are most predictive at their extremes.

From The Blog of HORAN Capital Advisors
Source: AAII


Sunday, November 17, 2013

The Week Ahead Magazine: November 17, 2013

The S&P 500 Index closed higher for the sixth consecutive week. Investors seem concerned about the market entering into bubble like territory. In this week's magazine several of the article links comment on the current state of this market advance. As we referenced in last week's magazine, one technical factor favoring higher equity prices is the market is in a favorable seasonal period. This, however, does not guarantee higher prices ahead.


Saturday, November 16, 2013

Benchmarking Investment Performance

An important task for investment managers and clients is to develop an investment policy statement (IPS) for the investment portfolios that are being managed. The IPS details guidelines specific to the client that outlines the client's goals and objectives. Some of the criteria of the IPS will detail the goals and objectives of the client along with liquidity needs. In the end the IPS will serve as a road-map for the investment manager in managing the client's portfolio as well as detail the specific asset allocation for the client's account(s). For the client then, the next step is evaluating the manager's investment results, not only against the criteria in the IPS, but also compared to relevant performance benchmarks. The question then becomes what are appropriate performance benchmarks.

Selection of an appropriate benchmark is not as clear cut as it may seem. In selecting a benchmark should the market benchmark be a capitalization weighted one or a price weighted one? Or should the benchmark really be tied to achieving specific return parameters that might be outlined in one's financial plan? Below I will discuss the difference between these various benchmarks with thoughts on the most appropriate one to use for evaluating an investment manager's performance.

Capitalization Weighted Benchmark: Probably the most common capitalization weighted benchmark is the S&P 500 Index. The holdings that comprise the index are weighted based on capitalization. This is determined by multiplying a company's stock price by the number of shares outstanding. As a consequence larger companies command a higher weighting within capitalization indexes.

Price Weighted Benchmark: In a  price weighted benchmark the index companies are weighted based on a company's respective stock price. For example, a company with a stock price of $100 would have twice the weighting as a company with a stock price of $50. The disadvantage of price weighted indexes is a company's actual stock price does not have much to do with why a company with a larger share price has a larger weighting. Also, a company's stock price is influenced by the number of shares outstanding; thus shares outstanding heavily influence the stock's price and weighting. The Dow Jones Industrial Average is an example of a price weighted index.

Equal Weighted Benchmark: As the description indicates the company weightings in an equal weighted benchmark are equal. Smaller size companies will have the same weighting as larger companies. One negative of an equal weighted benchmark is the benchmark requires frequent rebalancing in order to maintain the equal weighting. If one's portfolio is attempting to mimic the equal weighted benchmark transaction cost and capital gain taxes will likely be higher. Also, the smaller companies in the index may actually be difficult to replicate in an actual portfolio due to liquidity constraints. Equal weighted benchmarks and ETFs have gained in popularity. One reason may be the fact smaller capitalization companies have outperformed larger cap companies over the last four and a half years.

Goals Based Benchmarks:  The key component of a goals based benchmark is the direct relationship to an investor's future goals and objectives. In constructing this type of benchmark the investor will need to define his or her future needs as it relates to asset levels and spending needs. Often times this is best accomplished by the investor developing a financial plan. Institutions, such as not for profit organizations, can benefit from goals based benchmarks as well. Equivalent to the financial plan is a longer term financial projection, say a 1, 3 and 5 year budget. The performance of one's investments will most likely deviate from the financial goals established in the plan. What is critically important is to attempt quantify these deviations or construct a portfolio that minimizes the downside deviations. It is becoming more wide spread that performance reporting incorporates some type of downside measurement. Morningstar reports include upside and downside data in the reports they prepare on mutual funds and ETFs.

The benefit of goals based benchmarks seems clear, that is, one's portfolio construction is tied to achieving the targets laid out in the financial plan. Investors will likely not be happy if their manager says they beat the benchmark return by generating a negative 28% return when the benchmark is down 30% and now the client needs to adjust their lifestyle.

I believe goals based benchmarking is important. I do not believe it should be relied upon in a vacuum. If the equity market is up 30% and the investor's portfolio is up 10%, although this might achieve the goal targets in the financial plan, a discussion between the client and investment manager needs to center around why the large return difference. Is the difference the result of poor investment selections or a too conservative asset mix? In the end there needs to be a balance between the risk being taken in the investment portfolio as well as achieving the goals based returns. For clients that are withdrawing funds from their investment portfolio on a regular basis, downside risk management can be very important, vis-à-vis the percentage withdrawal rate.


Sunday, November 10, 2013

Declining Labor Force Participation Rate And Baby Boomers

One aspect of the slow growing recovery following the recent recession has been anemic job growth. A consequence of the weak job growth has been a steady decline in the labor force participation rate. Some economist and strategist attribute the declining participation rate to the retirement of baby boomers. However, as noted by the orange line in the below chart, the participation rate of baby boomers (55 years and over) remains at near the same level equal to that at the end of the recession. Consequently, data does not support that a declining participation rate is the result of these boomer retirements.

From The Blog of HORAN Capital Advisors

Interestingly, total job openings (JOLTS Survey) indicates companies desire to hire. Job openings are approaching the level prior to the recession. The question becomes why are these positions going unfilled. Is the government making it too easy for the unemployed by providing extended benefits through the various government assistance programs? Or are the benefits not the correct ones, for example, is job retraining made available to the unemployed? The second chart below shows the dramatic and continued increase in the SNAP or food stamp program. These government assistance programs are certainly necessary during recessionary times; however, it is possible the extended availability of these programs can discourage the unemployed from looking for employment.

From The Blog of HORAN Capital Advisors

From The Blog of HORAN Capital Advisors


The Week Ahead Magazine: November 10, 2013

Much of the discussion in recent weeks has centered around the equity market potentially going through a "melt up" phase in a run to year end. One factor that gives this thought some validity is the favorable seasonal period that occurs in the fourth quarter of calendar years. A number of article links in our Week Ahead magazine provide insight into this favorable seasonal period.


Saturday, November 09, 2013

Investors Express More Cautiousness Since The Financial Crisis

Since the bottom of the market at the depth of the financial crisis in early 2009, investors seem to be taking a more cautious view of the markets based on reported investor sentiment. It really hasn't been until this year that the S&P 500 Index has been able to make a sustained push above the market highs of early 2000. In mid to late 2007 the S&P was able to briefly surpass the 2000 highs; however, this was short lived as the financial crisis began to unfold.

From The Blog of HORAN Capital Advisors

An apparent result of the bursting of the technology bubble in early 2000 and the financial crisis in late 2007/2008, is the increased skepticism in which investors view the market. Some of this skepticism can be attributable to "recency bias" given the magnitude of the market's decline during the bursting of the tech bubble and the decline during the financial crisis. For an investor recency bias is when an investor uses recent past experience as the basis for what will happen in the future. The lost decade of the 2000s seems to have extended an investor's look back period to as far as 2000. Investors seem to express this cautious market view in reported sentiment surveys.

One popular sentiment measure is provided by the American Association of Individual Investors (AAII). AAII reports individual investor sentiment in a weekly sentiment survey. Below is a table that displays the maximum and minimum sentiment readings by year going back to the year 2000. The average of the bullish maximum percentage from 2000 through 2008 is 63%. The average of the bullish maximum percentage from 2009 through 2013 has declined to 55%. Does the individual investor view their portfolio as under invested in equities, i.e., waiting for a market pullback? This 2009 through 2013 period is also displayed separately in the table below the full spreadsheet.


From The Blog of HORAN Capital Advisors
A significant outcome resulting from the heightened investor skepticism is the fact the market continues to move higher, i.e., a long "climb the wall of worry" market. The below chart shows the S&P 500 Index price chart since the bottom of the financial crisis in 2009 through the market's close on November 8, 2013. As easily seen on this chart, the S&P has trended higher within a well defend uptrend channel. This move has not been in a straight line; however, it is higher nonetheless. This uptrend has been in place for four and a half years.

From The Blog of HORAN Capital Advisors


Given the lack of euphoria shown by investors, is it possible this market continues to deliver new highs? In the market's favor is the number of strategist and commentators stating the market is due for a correction. I could site a number of other potentially negative factors like, the elevated cyclically adjusted P/E ratio, single digit earnings growth and the presumed low levels of investor cash, just to name a few. Another positive is the fact the market is in a favorable seasonal period. And let's not forget the accommodative Fed. In other words, there seems to be quite a number of reasons the market should correct. The market, however, generally does not correct when the majority thinks it will. More discussion on this can be found in our most recent Investor Letter.

Yes, the market "could" be long in the tooth as they say. At HORAN Capital Advisors, we recently eliminated our small cap exposure in client accounts. For several years, we have allocated a portion (10%-15%) of client investments to alternative investments like absolute return and long short funds. We have not introduced alternative investments into our investment approach as a replacement for equity though. These alternatives are mainly exposure in lieu of some classes of fixed income in an effort to generate returns better than bonds, yet not take the same level of risk as if we had increased our equity allocation. This strategy has worked well for our clients.

In conclusion, sentiment figures tend to be most accurate at their extremes. Is it likely the individual investor has such a cautious view of the equity market because of their investment experience following the tech bubble and financial crisis that they now are viewing the slightest market pullback as a buying opportunity? Because of this, and assuming fundamental data continues to come in "okay", might the market continue to trend higher? We will certainly know in hindsight at some point in the future.


Friday, November 08, 2013

Retail Investor Cash Hits Low Along With Fear

Rydex Cash Levels have fallen to extreme lows recently (See chart below).  The Rydex Cash Level measures the cash held in Rydex money markets.  Historically, pullbacks or corrections occur when these levels reach the .4 marker, but the past three times the index has hit the .4 level, the pullbacks have been short-lived.  This is a sign that that those investors sitting on cash are eager to invest in equities in fear of missing out on this strong equity market rally. Alternatively, ICI data shows money market cash in mutual funds has been trended higher since April of this year.

Rydex Cash

At the same time, the CBOE Volatility S&P 500 Index (.VIX), also known as the “Fear” Index, is near 2007 lows (Chart Below).  The VIX displays 30-day forward volatility for the markets.  The index is used as a measure of market risk.

VIX

Investor sentiment appears to be worry-free by these two measures.  Some believe these indicators are projecting a market correction ahead, but not so fast.  Fed driven liquidity is providing a favorable environment for equities in a seasonal period where, historically, equity markets have been strong.  Investors have been and continue to be rewarded for taking a “risk-on” approach in terms of investing in risk asset classes.  As for how long this will continue, no one knows for sure.  The equity markets have enjoyed larger gains in the past during this generally positive seasonal period and saying “this time it will be different” can be a dangerous position to take.


Thursday, November 07, 2013

Are Small Cap Valuations Getting Extended?

Since the beginning of November, small cap stocks have been underperforming large caps. This recent underperformance has strategist questioning whether the small cap outperformance, since the end of the financial crisis in 2009, is coming to an end. As the below chart shows, since February 2009, small caps have significantly outperformed large capitalization equities.

From The Blog of HORAN Capital Advisors

This outperformance has caused the valuation of small caps to reach a premium relative to large caps. T. Rowe Price recently highlighted this valuation premium in their Fall 2013 T. Rowe Price Report newsletter. The below chart that accompanied the article, Leading Market Recovery, Small-Caps Face New Challenges, notes small caps are selling at a 14% premium to large caps.

From The Blog of HORAN Capital Advisors

Preston Athey, manager of T. Rowe Price's Small Cap Value Fund, states, "It’s harder finding attractive opportunities today than two to three years ago, so a value investor tends to be cautious. We’re paying 15 times earnings today for companies that were selling at 11 times earnings three years ago."

I believe investors should take to heart Athey's cautionary comment of, "But if we get a major correction or a mild recession, the market will go down and small-caps will do worse because this sector is more volatile. After a long period of good performance and outperformance, the caution light should be on now rather than flashing green."


Monday, November 04, 2013

Fund Flow Trends

As seen in the interactive fund flow graph below, the last three months equity fund flows, as prepared by Lipper for Reuters, have seen investors allocate more of their investment dollars to Europe, emerging markets and Japan. Some of the countries with the largest outflows are Asia Pacific ex Japan, the U.S. and Germany. For the month ending September 2013, fixed income flows indicate investors are favoring high yield bond investments. This fixed income flow data may be more an indication that investors are reaching for yield and less of an indication they are becoming less risk averse.

(click graphic for interactive version)


Source:
Germany Equity Fund Flows Tank as Bets Put on Big Europe
Reuters
By: Joel Dimmock
October 18, 2013
http://www.reuters.com/article/2013/10/18/lipper-flows-idUSL6N0I524D20131018


The Week Ahead Magazine (Belated): November 3, 2013

The posting of this week's Week Ahead Magazine is a day late. I was traveling in Chicago with my wife visiting our son recently transferred there with his company. As an aside we had a fantastic Italian meal at Riccardo Trattoria in Lincoln Park. I would say the focus of this week's article links center around the market's valuation and investor sentiment. Coinciding with some elevated sentiment measures is the level of margin debt. An interesting Bloomberg article is linked to in the magazine comparing margin debt as a percentage of GDP.


Friday, November 01, 2013

Structural Unemployment

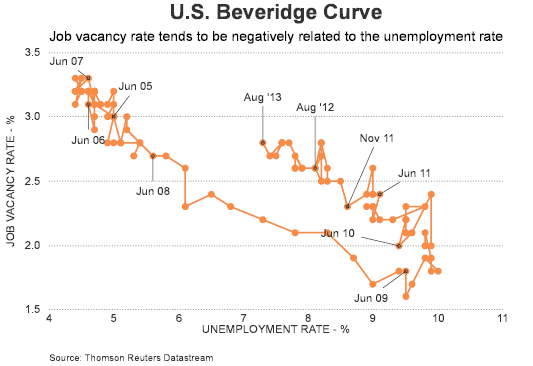
It has been nearly two years since I posted an article on structural unemployment, specifically, looking at the Beveridge Curve. As noted in that prior post, the Bureau of Labor Statistics notes the relationship between the unemployment rate and the vacancy rate, also known as the Beveridge Curve, named after the British economist William Henry Beveridge (1879-1963). The economy’s position on the downward sloping Beveridge Curve reflects the state of the business cycle. For example, a greater mismatch between available jobs and the unemployed in terms of skills or location would cause the curve to shift outward, up and toward the right (emphasis added). Certainly the unemployment rate shows improvement, yet the curve has maintained its outward and upward shift during this recovery.

From The Blog of HORAN Capital Advisors