Monday, April 30, 2007

When To Rebalance Ones Portfolio As Large Cap Stocks Receive More Favorable Press

As a follow up to my Friday post, Large Capitalization Stocks Poised To Move Higher?, today the Wall Street Journal had an article, Goliaths Gain Momentum on Davids($), on the out performance of large cap stocks during the month of April relative to small cap stocks.

On a year-to-date basis, the Dow Jones Industrial Average (large cap stocks) and the Russell 2000 Index (small cap stocks) have generated similar returns of a little over 5%. However, for the month of April, the DJIA is up 6.2% versus 3.6% for the Russell 2000 Index. Is it possible a rotation into larger capitalization stocks is underway?

One must remember it is difficult to time the market; however, one should have a discipline of rebalancing their portfolio from time to time. Ideally, one has developed an investment policy statement (at least parameters) outlining acceptable levels of exposure to stocks and bonds. Within stocks the exposure to large, mid and small cap stocks should be evaluated. In reviewing ones portfolio, if they are over exposed to small cap stocks, for example, one should consider reallocating to the under represented asset class. From a comfort standpoint, one will find it difficult to reduce exposure to a winning segment of the market. As the chart details below, though, nearly seven years of out performance of small and mid cap stocks is a long period of time from a historical perspective. Given the market performance over the last 5-7 years, one is likely under exposed to large capitalization stocks. The below chart details the performance disparity between mega cap stocks (S&P 100), large cap (S&P 500), mid cap stocks (S&P 400) and small caps (S&P 600).

(click on chart for larger image)

equity style performance April 2007
Lastly, it is difficult to determine when a particular segment of the market under performs or out performs the other. Many times, in the long run, the best alternative is to invest in high quality dividend paying stocks. As prior posts on this site have noted, dividend growth stocks tend to out perform other asset classes on a risk adjusted basis.


Harley-Davidson Goes HOG Wild With The Dividend

In August 2006 Harley-Davidson (HOG) changed the company's stock ticker to HOG. The change was desired by the company in order that the ticker might reflect what they sell/manufacture.
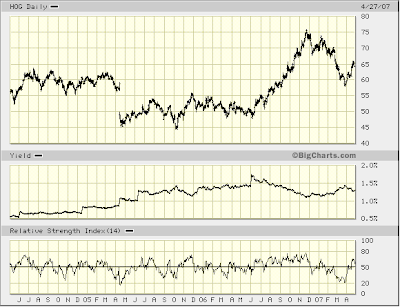
  • Over the weekend, the Harley-Davidson announced a 19% increase in the company's quarterly dividend to 25 cents per share versus 21 cents per share in the same quarter last year.
  • This 19% dividend growth rate compares to the 5-year average dividend growth rate of 57%. The historically large growth rate is largely attributable to the company increasing its annual dividend in 2004 to 40.5 cents per share versus 2003's dividend of 19.5 cents per share.
  • The projected payout ratio based on 2007 estimated earnings of $4.14 is 24%. This compares to the 5-year average payout of 14%.
(click on table/chart for larger image)

Harley-Davidson dividend table. April 2007
Harley-Davidson stock chart. April 2007


Sunday, April 29, 2007

Marriott International Increases Dividend 20%

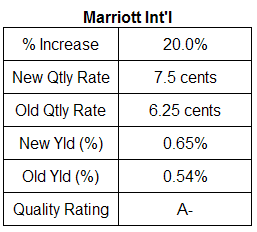
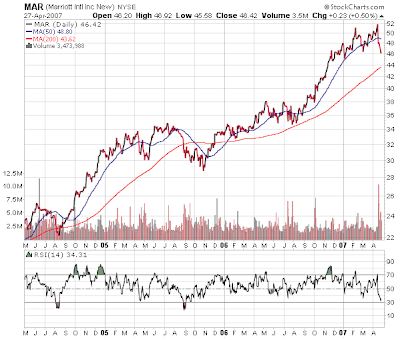
On Friday, Marriott International (MAR) increased its quarterly dividend 20% to 7.5 cents per quarter versus 6.25 cents in the second quarter last year. The 5-year average dividend growth rate for MAR is approximately 15%. The estimated payout ratio on the new dividend for 2007 is approximately 16%. The compares to the 5-year average payout ratio of 14%.

Marriott dividend analysis April 27, 2007
Marriott stock chart April 27, 2007


Saturday, April 28, 2007

Short Interest Ratio Increases: Bullish For The Market?

At Standard & Poor's Outlook website, the article, Stocks Headed Higher, discusses the fact that market sentiment indicators are showing an increase in "fear" versus "optimism". From a contrarian standpoint, this increase in fear as measured by the short interest ratio tends to be positive for future stock market returns.

"One way to gauge market sentiment is to watch the short-interest ratio on the New York Stock Exchange. First, the short-interest ratio is the number of shares sold short divided by average daily volume. This is often called the “days-to-cover ratio” because it tells — given the stock’s average trading volume — how many days it will take short sellers to cover their positions. Short sellers are, of course, betting on a price decline.

Since 1994, the NYSE short-interest ratio has oscillated between 3.7 and 7.5. The higher the ratio, the more investors are betting on a market decline. The lower the number, the more investors are looking for a rise in stock prices. The average ratio over this period has been 5.4. We view readings of 6 and above as bullish and readings of 4.6 and below as bearish. The current NYSE short-interest ratio is 7.4, or right near the top of the range since 1994 and just below the all time high of 7.5 in October 1996."
The article also discuss futures trading and the three types of futures players:
"...the commercial hedgers (smart money), large speculators (dumb money), and small speculators (dumber money). If we look at the current posture in the S&P 500 e-mini contract, commercial hedgers are net long the stock market, while large speculators are net short the market by a very large margin. The same situation can also be seen in the Russell 2000 e-mini contract. An e-mini contract is a portion of a standard futures contract. It trades in a highly liquid market and is more affordable for investors.

Small investors and large speculators are betting on lower stock prices. We will place a wager on the smart money; they are betting on further upside."
Given the recent positive moves higher by some of the higher quality large cap stocks, some short covering may be providing a tailwind to this market.

Source:

Stocks Headed Higher
The Outlook
By: Sam Stovall, Chief Investment Strategist
April 27, 2007
http://www.outlook.standardandpoors.com/NASApp/NetAdvantage/mkt/OutlookMarketInsight.do?
subtype=OWMO&pc=NET&tracking=NET&context=Company&docId=11874149


Friday, April 27, 2007

Large Capitalization Stocks Poised to Move Higher?

Over this past week, a number of large capitalization stocks experienced significant moves higher once earnings were announced. From a performance perspective, the highest quality large cap stocks have been the lagging part of the overall equity market. Analyst have projected that earnings growth for the S&P 500 companies would come in at the low to mid single digit range in the 1st quarter of 2007. Contrary to analyst expectations the large S&P 500/S&P 100 companies have been reporting strong earnings growth.

Donald Luskin, Chief Investment Officer at Trend Macrolytics, and a contributing writer for Smart Money, today noted in an interesting article posted at smartmoney.com titled, Once Again, Earnings Prove the Bears Cannot Get It Right:
SIGH. ANOTHER EARNINGS season, another dollar.

Or perhaps I should say another eight billion dollars. Since the end of March, just a few short weeks, that's how much Wall Street has upgraded its appraisal for the S&P 500's earnings over the last year.

If S&P 500 earnings grew at that rate for a whole year, they'd rise 14.4% — an earnings gusher. And don't think it can't happen. Earnings have been growing at that rate or better for most of the last three years.
After these large companies announced earnings this week, the company's stock price action has experienced a significant move higher. Following are charts on just a few of the companies that saw positive stock price movement after the company's earnings announcement: Microsoft (MSFT), 3M (MMM), C.H. Robinson (CHRW) and Apple (AAPL), just to name a few.


(click on charts for larger image)


One reason the large capitalization firms saw the strong upward movement in their stock price is partly attributable to the increased short interest in the company's stock. This increased short interest caused the shorts to cover their positions; thus, contributing to the higher upward movement in the stock.

(click on table for larger image)


The top 10 stocks on the NYSE and NASDAQ with the largest short position are as follows:


Source:

Once Again, Earnings Prove the Bears Cannot Get It Right
SmartMoney.com
By: Donald Luskin
Trend Macrolytics
April 27, 2007
http://www.smartmoney.com/aheadofthecurve/index.cfm?story=20070427&pgnum=1


Thursday, April 26, 2007

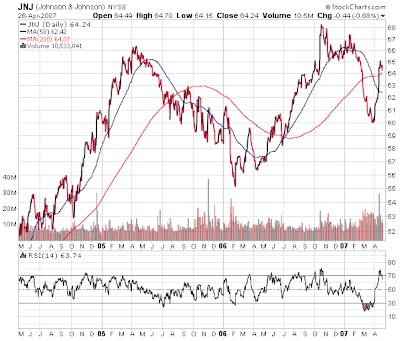
Johnson & Johnson and Microchip Technology Raise Dividend

Both Johnson & Johnson (JNJ) and Microchip Technology (MCHP) announced dividend increases today.

Johnson & Johnson:
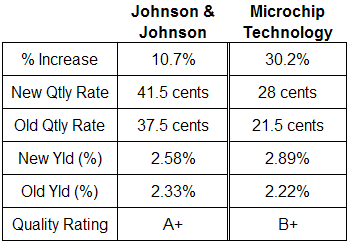
  • JNJ announced a YOY 10.7% increase in its quarterly dividend to 41.5 cents per share versus 37.5 cents per share in the same quarter last year.
  • The increase is lower than the 5-year historical dividend growth rate of 16%.
  • The projected dividend payout ratio based on estimated 2007 earnings of $4.05 is 37%. This is in line with the 5-year average payout ratio of 36%.
  • Of note, the 10.7% increase compares to an increase of 16% in the 2006 dividend and a 19% increase in the 2005 dividend.
Microchip Technology:
  • MCHP announced a YOY 30.2% increase in its quarterly dividend to 28 cents per share versus 21.5 cents per share in the same quarter last year.
  • The company has increased its dividend every quarter since the 4th quarter of 2003 increase.
  • The company first paid a dividend in the 4th quarter of 2002.
  • The projected dividend payout ratio based on estimated calendar year 2007 earnings of $1.43 is 78.3%. This compares to the payout ratio of 14% in 2003.

dividend analysis Johnson & Johnson and Microchip Technology
stock chart Johnson & Johnson, April 26, 2007
stock chart Microchip Technology, April 26, 2007


Increase In Bearishness From The Sentiment Survey

This week's sentiment survey from the American Association of Individual Investors shows an increase in bearishness. The level of bullishness declined to 39.24% versus last week's 46.94%. The survey at Ticker Sense also saw an increase in bearishness this week. Keep in mind, these surveys tend to be contrarian indicators.

sentiment survey 4/26/2007


Wednesday, April 25, 2007

Exxon Mobil and W.W. Grainger Increase Dividend

Both Exxon Mobil (XOM) and W.W. Grainger (GWW) announced dividend increases today.

Exxon Mobil:

  • Exxon Mobil increased its quarterly dividend 9.4% to 35 cents per share versus 32 cents per share in the same quarter last year. Although XOM tends to increase its dividend on a calendar year over year basis, it does not have a track record of increasing the dividend every fifth quarter. Exxon last increased its dividend in the 1st quarter of 2006.
  • The increase of 9.4% is slightly higher than the 5-year average dividend growth rate of 8%.
  • The estimated payout ratio is approximately 22% based on 2007 estimated earnings of $6.23. The 5-year average payout ratio is about 32%.
W.W. Grainger:
  • Grainger increased its quarterly dividend 20.7% to 35 cents per share versus 29 cents per share in the same quarter last year.
  • The increase of 20.7% compares to the 5-year average dividend growth rate of 11%.
  • The estimated payout ratio is approximately 24% based on 2007 estimated earnings of $4.82. The 5-year average payout ratio is about 27%.
(click on table/chart or larger image)


Tuesday, April 24, 2007

Aflac, Marshall & Illsley and Legg Mason Announce Dividend Increases

Today Aflac (AFL), Marshall & Illsley (MI) and Legg Mason (LM) all announced dividend increases.

Aflac:
  • AFL made it three in a row, that is, the third straight quarter Aflac has increased its quarterly dividend. The 57.7% YOY increase compares to AFL's 5-year average dividend growth rate of 22%.
  • AFL's dividend in the 1st quarter of 2006 equaled 6 cents per share versus the recently announced quarterly dividend of 20.5 cents per share.
  • In today's the earnings release Aflac reported that operating earnings in the first quarter of 2007 were $407 million versus $364 million in the first quarter of 2006. Per diluted share operating earnings rose 13.9% in the quarter to 82 cents versus 72 cents a year ago. The weaker yen/dollar exchange rate lowered operating earnings per diluted share by 1 cent during the quarter. Excluding the currency impact operating earnings per share increased 15.3%.
  • The 5-Year average payout ratio is approximately 17%.
  • The company repurchased 5.1 million shares of its stock in the first quarter. The company still has 32 million shares available to be repurchased under a share repurchase program approved by AFL's board.
Marshall & Illsley:
  • MI increased its quarterly dividend 14.8% to 31 cents per share versus 27 cents per share in the same quarter last year.
  • The 5-year historical dividend growth rate is 14%.
  • MI's 5-year average payout ratio equals 30%. The estimated 2007 payout ratio is approximately 36% based on 2007 estimated earnings of $3.42.
Legg Mason:
  • LM increased its quarterly dividend 33.3% to 24 cents per share versus 18 cents per share in the same quarter last year. This increase came one quarter early. Legg Mason typically increases its dividend in the 3rd quarter of a calendar year.
  • LM's 5-year historical dividend growth rate is approximately 29%
  • LM's 5-year average payout ratio equals 18%. The estimated 2007 payout ratio is approximately 18% based on 2007 estimated calendar year earnings of $5.20.
(click on table/charts for larger image)

dividend analysis Aflac, Marshall & Illsley and Legg Mason 2007
stock chart Aflac, Marshall & Illsley and Legg Mason


Sunday, April 22, 2007

Utility Stocks: Ready For a Short Circuit?

The best performing sector over the last 12-months has been utility stocks. The utility sector is up 32.48% versus the next best performing sector, telecommunications, up 30.83%. Is the low level of indicated dividend yield an indication utility stocks are overvalued? One factor driving utility share prices higher has been the flow of private equity dollars into this sector. Specifically, Texas Utilities (TXU)) is involved in a deal to go private led by Kohlberg Kravis Roberts & Co. and TPG Inc., formerly known as Texas Pacific Group.

In an article today by Daniel Hauck and Michael Tsang of Bloomberg, they cite some data that might suggest utility shares are approaching an overbought level.
  • The average yield for power companies worldwide last month fell below both U.S. and European interest rates for the first time since September 2001.
  • Some investors are taking notice: firms overseeing about $12.3 trillion were net sellers of utility stocks in April, State Street Corp. says.
  • The drop in dividend yields may signal utility stocks are overvalued, if history is any guide. The last time the yield on the S&P 500 Utilities Index fell below the current level was in 2000. The gauge climbed to a record on the second-to-last trading day of the year, before a two-year slide.
  • They've defied history since the current bull market began in 2002. The group has been the second-best performer among 10 industries in the S&P 500, in part because U.S. interest rates tumbled to four-decade lows, increasing the attractiveness of shares that pay the highest dividends.
  • The utilities index gained 13 percent this year, extending its advance since October 2002 to 173 percent. That's better than every industry group except energy stocks and almost double the S&P 500's 91 percent increase.
  • The dividend yield on the U.S. utilities gauge has slipped to 2.86 percent from 6.31 percent at the start of the bull market. It's now 0.46 percentage points above the level reached in April 2001, and that was the lowest since at least 1989, according to Bloomberg data.
  • Endowments, pension funds and other institutions became net sellers of utilities at the end of 2006, according to the brokerage arm of Boston-based State Street, the world's third- largest custodian of assets. This month, selling of U.S. utilities was the second-highest among 10 industry groups, behind only industrial companies, according to State Street.
  • Institutions ``haven't been the ones driving the price up recently,'' said Sam Burns, senior U.S. equity strategist at State Street Global Markets. ``They may think that if there's all this deal activity going on, that's the time to sell.''
  • SAC Capital, a $12 billion hedge fund run by Steven Cohen in Stamford, Connecticut, increased its holdings of utility stocks among its assets by 1.6 percentage points in the fourth quarter, according to data compiled by Bloomberg. Jonathan Gasthalter, a spokesman for SAC, declined to comment.

  • D.E. Shaw founder David Shaw, who advised former President Bill Clinton on science and technology, boosted his holding in Mirant more than sixfold to 2.33 million shares in the fourth quarter. The New York-based fund manages $29 billion. Kari Elassal, spokeswoman for D.E. Shaw, declined to comment.

  • Bruce Kovner's Caxton, a New York-based fund that oversees more than $14 billion, almost doubled its stake in Mirant in the fourth quarter.

  • Caxton, D.E. Shaw and Kenneth Griffin's Citadel Investment Group LLC, a $13.4 billion hedge fund based in Chicago, all held stakes in Houston-based power producer Dynegy Inc., according to filings as of Dec. 31 compiled by Bloomberg.

The interesting fact in the Bloomberg article is many institutional investors have trimmed their weighting in utility shares. At this time it appears the main driver of the flow of funds into utilities is coming from hedge funds. Hedge funds can be thought of as hot money and can change their investment position in a very short period of time; thus creating volatility in the price of utility stocks.

Source:

Utility Stocks Captivating Hedge Funds Incite Industry Bears
Bloomberg.com
By: Daniel Hauck & Michael Tsang
April 23, 2007
http://www.bloomberg.com/apps/news?pid=20601109&sid=aTlj2JTj8usI&refer=home


Dogs Of The Dow Update

The Dogs of the Dow is a strategy where one invests in the top ten yielding Dow Jones Industrial Average stocks based on the stocks yield at the end of the prior year. Year to date through 4.20.2007, the Dogs of the Dow are outperforming the DJIA Index: 4.7% versus 4.0% for the DJIA. Following is a summary of the performance.

(click on tables for larger image)

Dogs of the Dow as of April 20, 2007
Dogs of the Dow performance summary April 20, 2007
Note 1: YTD % change figures do not include dividends, commissions, or taxes.

Source: Dogs of the Dow


Saturday, April 21, 2007

Dividend Aristocrats Yet To Raise Dividend In 2007

As of April 18, 2007, the following is a list of the Dividend Aristocrats yet to announce dividend increase actions in 2007. First Horizon (FHN) has gone seven quarters without a dividend increase. In order for FHN to maintain an increase on a calendar YOY basis, the company would need to announce an increase at their July declaration date.

(click on table for larger image)

Dividend Aristocrats yet to raise dividend in 2007


Thursday, April 19, 2007

Sentiment And Asset Allocation

The American Association of Individual Investors reports bullish sentiment rose this week to 46.94% from 40.85%. Bearishness declined to 29.59% from 38.03%. As noted in the graph below, the current bullishness is far below the high of 75% that was recorded in 2000.

In March, AAII's asset allocation survey showed investors had reduced their allocation to stocks at a time when the market had corrected. The asset allocation survey reported a nearly 7% reduction in equity exposure with 5% going to cash and 2% going to bond mutual funds. Since that time the S&P 500 Index is up about 50 points or 3.5%.

(click on table/graph for larger image)
sentiment survey and asset allocation survey


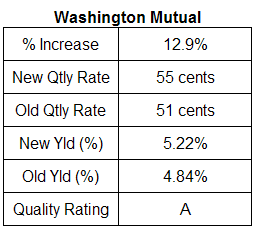
Washington Mutual: Another Penny Increase

Washington Mutual (WM) announced another 1 cent increase in its quarterly dividend. WM has increased its quarterly dividend by 1 cent in each quarter since the 3rd quarter of 2000. The second quarter dividend increases to 55 cents per share versus 51 cents per share in the same quarter last year. The payout ratio increases to 58% based on 2007 estimated earnings of $3.79. The payout ratio in 2002 was only 27%.

Washington Mutual Dividend Table
Washington Mutual Stock Chart


Monday, April 16, 2007

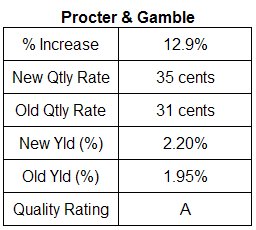
Procter & Gamble Increases Dividend 12.9%

Today Procter & Gamble (PG) announced it was increasing its quarterly dividend 12.9%. The quarterly dividend increases to 35 cents per share versus the prior year's quarterly dividend of 31 cents.
  • PG's 12.9% dividend increase exceeds the 5-year historical growth rate of 11%.
  • The projected dividend payout ratio, based on forward four quarters earnings, equals 42%. This payout rate is in line with PG's historical dividend payout ratio.
  • PG has an S&P Earnings and Dividend Quality Ranking of A.
(click on table/graph for larger image)
Procter & Gamble dividend analysis table
Procter & Gamble stock chart April 2007


Sunday, April 15, 2007

Baby Boomers: They Just Might Impact The Equity Markets As They Move Into Retirement

An important aspect to investing is determining where the markets might be headed based on macro factors. This is certainly why investment strategists parse the continual flow of economic data in an effort to determine the future course of the economy and the market. One potentially significant event is the aging of the baby boomers (individuals born between 1946-1964) and the decisions they will make regarding their investments.

Thomas Partners Investment Management (TPIM) recently analyzed market returns from 1986-2005. The strategy article notes:
It is interesting to note, however, that despite all the attention given to corporate earnings growth, well less than one half of the increase in portfolio values over that period can be attributed to the underlying earnings per share growth of the S&P 500 component companies! The balance, to the surprise of many investors, was due to increased Price/Earnings ratios ("P/E" ratios) and the reinvestment of dividend income.
The article contains a number of graphs depicting the breakdown of the equity market returns since 1986. During the 1980s and 1990s investment managers attributed some of the strong equity market advances to P/E expansion that was supported by declining interest rates and low inflation. TPIM opines the other influence on P/E expansion was due to the fact baby boomers had moved into their prime wealth accumulation phase. This wealth accumulation resulted in a higher demand for equities as the boomers invested their wealth into the equity market; thus pushing up equity prices and expanding multiples.

As the baby boomers have aged, they have impacted society and the economy in various ways. In boomers pre-teen years, communities had to build more schools to accommodate the influx of students. Every kid wanted to own a Schwinn, once a popular bicycle brand. As the boomers moved onto SUVs and mini-vans, Schwinn ended up in bankruptcy. Given the fact 10,000 baby boomers will turn 60 every day (started in 2006) over the course of the next 17 years, what impact will this have on investment markets, specifically equities?

Thomas Partners theorizes:
If "growth-hungry" boomers drove P/E’s higher in the past, it is logical to assume that "income-hungry" boomers will drive P/E’s lower in the future. First, growth will not be the dominant investment goal; income will likely dominate. Second, higher current yields (caused in part by lower P/E’s) will be needed to support boomer retirement lifestyles. As such, the P/E ratio expansion that contributed so handsomely to equity returns in 1986 to 2005 will likely reverse and inhibit price appreciation for years to come.
TPIM believes equity market returns will average in the high single digits over the next 20 years. In an environment of single digit equity returns and multiple contraction, dividend income becomes a more important component of an investor's return. Additionally, it is believed boomers will desire, and companies will accommodate, higher dividend payments.

As noted in a prior post, up to this point, companies have favored stock buybacks to dividend payments. With the payout ratio on the S&P 500 at a historical low of 30%, companies have the capability to increase dividends that are paid to shareholders. It is believed as boomers move into their retirement years, they will prefer owning less volatile dividend paying stocks and will demand higher dividends in return.

Finally, as TPIM notes and I have mentioned in prior posts:
Dividends make a difference in any portfolio and more current yield, earlier, plus more dividend growth, later, can significantly enhance long-term total returns.
Lastly, Stephen Crowe of Eons interviewed Greg Thomas of Thomas Partners.

Before I touch on the interview, who or what is Eons. Eons is a site devoted to boomers. The site was started in mid 2006 by Jeff Taylor, the founder of Monster.com. Eons' mission statement:
Eons is a 50+ media company inspiring a generation of boomers and seniors to live the biggest life possible.
I mention Eons because this company is a reality because of the aging baby boomer population.

The site contains an interview with Greg Thomas of Thomas Partners expounding on the benefits of a dividend growth portfolio. In Part III of the interview, Thomas responds to why more investors do not follow a dividend growth approach. His response:
"One is that income is very difficult to get excited about in any sort of a short-term measurement period," Thomas says. A dividend is too small to have much impact on total returns.

"Even if you have stock that is yielding 4 percent, the dividend in one quarter is only returning 1 percent," he notes. In the same time period, the price of a stock can change 5, 10 or 15 percent in any direction - far more noticeable.

A second reason why the dividend growth strategy is not widely practiced is the nature of the stocks themselves.

"The kinds of stocks that pay dividends, and particularly those that pay increasing dividends, rarely capture the excitement of the short-term marketplace," says Thomas.

The dividend growth companies are the "steady eddies" of Wall Street - GE, MDU Resources, Procter & Gamble, McGraw Hill, to name a few.

"The market is a popularity contest in the short term," Thomas says. "And the last thing we want to be doing is always be buying the most popular kid on the block, because those things have a way of changing."

As the steady flow of boomers moves closer to retirement, I do believe one impact the aging baby boomers will have on equity markets is that of a greater demand for dividend growth equities. Additionally, those companies that are able to pay a higher dividend rate will see their stock prices likely increase at a faster pace than the market.


Sources:

Equity Markets: 1986-2025
Thomas Partners Investment Management
https://www.thomaspartnersinc.com/SHOREY/WEB/me.get?WEB.websections.show&SCH3490_274

Dividend Growth Portfolio: 'Steady Eddies' of Wall Street Drive Investment Strategy
Eons
By: Stephen Crowe
http://www.eons.com/money/feature/growthenestegg/11352


Saturday, April 14, 2007

Top Yielding Dividend Aristocrats

Following are the top 15 yielding dividend aristocrats as of the market close on April 13,2007.

(click on table for larger image)

top yielding dividend aristocrats as of April 13, 2007


Thursday, April 12, 2007

Positive Market Reflected In Bullish Sentiment Increase

The American Association of Individual Investors Sentiment Survey reflects an increase in bullish sentiment as of 4.11.2007. Bullishness increased to 40.85% from last week's 32.26%.


Laszlo Birinyi's Tickersense site also maintains a Ticker Sense Blogger Sentiment Poll. His poll surveys the web's most prominent investment bloggers, asking "What is your outlook on the S&P 500 for the next 30 days?" His poll (with chart) shows bullishness has been on the increase since mid-March.


Monday, April 09, 2007

TJX Cos. Increases Dividend 28.6%

Today, TJX Cos. (TJX) announced it was increasing its quarterly dividend by 28.6% on a year over year basis. The new quarterly dividend payable May 31st increases to 9 cents per share versus 7 cents per share in the second quarter of 2006. TJX's 5-year average annual dividend growth rate is approximately 24%. In addition to the dividend increase, the company announced it was resuming its stock repurchase program. The company stated it would repurchase $900 million of stock or about 7% of the current shares outstanding based on today's closing price of $28.07.

(click on table/graph for larger image)
TJX Cos. dividend table
TJX Cos. stock chart


Saturday, April 07, 2007

Dividends Determine Value In The Long Run

The newsletter Investment Quality Trends, published twice monthly, analyzes a list of stocks rated from undervalued to overvalued based on a company's yield. The newsletter's foundation of a stock investment is based on quality and value. Stocks rated below B+ by Standard and Poor's Earnings and Dividend Ranking measure are not include in IQ Trends' recommendations. The publisher notes:
When all other factors which rate analytical consideration have been digested, the underlying value of dividends, which determines yield, will in the long run also determine price. The key to value, therefore, lies in yield as reflected by the dividend trend. Individual stock prices fluctuate between repetitive extremes of high dividend yield and low dividend yield. These recurring extremes of yield establish Undervalue and Overvalue price levels. When a dividend is raised, the Undervalue and Overvalue price levels are raised automatically so they will continue to reflect the historically established yield extremes. Each stock has its own distinctive high and low yield characteristics and must be evaluated individually.
The chart for the Dow is detailed below:

(click on chart for larger image)

Dow Jones Industrial Average Dividend Yield Chart
Source:
Investment Quality Trends
First-April 2007
Kelley Wright, Managing Editor
www.iqtrends.com


Thursday, April 05, 2007

Bullish Sentiment Declines

The American Association of Individual Investors Sentiment Survey recorded a drop in bullish sentiment this week. The level of bullishness declined to 32.26% from last week's 42.68%. The level of bearishness increased to 39.78% versus last week's 25.61%. This contrarian indicator is a volatile one; however, the decline in bullishness could be an indication for further advances in the market.


Wednesday, April 04, 2007

Total Aggregate Cash Dividend Payments Increase in 1st Quarter 2007

Today, Standard & Poor's announced:

  • total aggregate cash payments increased substantially, with total cash payments to common issues on the ASE, NYSE and NASD increasing 16%.
  • 621 of the approximately 7,000 publicly owned companies that report dividend information to Standard & Poor's Dividend Record increased their dividend for the first quarter of 2007. This represented a 0.8% decline from the 626 issues raising their dividend in 2006.
"The improvement in dividends has slowed down its pace since the 2003 start, with companies remaining cautious about committing future funding and preferring to increase their stock buyback programs instead," says Howard Silverblatt, Senior Index Analyst at Standard & Poor's. "Dividend reductions continue to be low, reflecting the more assured approach to payments once the commitment is made."
Interestingly, Silverblatt notes,
"The companies that have a long history of annual dividend increases have kept up their end of the bargain; however, the issues that increase their rate every few years appear to be lagging. The importance of history is now playing a greater role in current policy," concludes Silverblatt.
The importance of history comment by Silverblatt is an indication that consistent dividend growers are more committed to future increases than the companies that periodically increase the dividend.

Source:

S&P: Companies Cautious with Dividends During First Quarter 2007
PR Newswire
April 2, 2007
http://news.moneycentral.msn.com/category/topicarticle.aspx?feed=PR&Date=
20070402&ID=6697549&topic=TOPIC_DIVIDENDS&isub=2


Double Digit Earnings Growth For S&P 500 Comes To An End

Standard & Poor's reports that the double digit earnings growth for the S&P 500 Index came to an end in the 4th quarter of 2007. This break in double digit earnings growth follows 18-months (4.5 years) of S&P 500 companies reporting double digit growth in earnings. Earnings for the 4th quarter of 2007 increased 8.9% on a year of year basis compared to the 4th quarter 2005.


This break in double digit growth has potential implications on the type of companies that may outperform going forward. According to Richard Golod, Director, Global Investment Strategies for Van Kampen Investments, higher quality large cap stocks offer compelling value in this environment.
Against the current backdrop of higher interest rates and declining S&P 500 earnings growth rates, it would seem larger-cap stocks may outperform small-cap stocks in the near future, favoring sectors such as consumer staples, utilities, financials, and health care. If history is any guide, I believe the following factors support an overweight position in large-cap, high-quality stocks with predictable earnings (emphasis added):
  • A decelerating earnings growth rate
  • A flattening yield curve
  • A wide valuation spread between large- and small-cap stocks
  • Potentially higher market volatility and an increased equity risk premium
As detailed in S&P's release, two sectors saw a decrease in operating EPS: energy at -3.21% and consumer discretionary at -2.39%.

Source:

18 Consecutive Quarters of Double-Digit Earnings
Growth for the S&P 500 Comes to an End

Standard & Poor's
By: David Guarino, Communications and
Howard Silverblatt, Senior Index Analyst
April 3, 2007
http://www2.standardandpoors.com/spf/pdf/index/040307_500earnings.pdf

Global Earnings Set to Surprise on the Upside
Van Kampen Investments
By: Richard Golod
Director, Global Investment Strategies
April 2006
http://www.vankampen.com/vksite/news/commentary/golod0406.asp


Monday, April 02, 2007

Dividend Payers versus Non-Payers: March 30, 2007

For the month of March and on a year to date basis, the dividend payers are underperforming the non-payers. However, on a 12-month basis, the payers continue to outperform: 13.57% versus 7.11%, respectively.

(click on table for larger image)


Buybacks Can Reduce EPS and Still Add Value To Firm Shareholders

As noted in an earlier post titled, Stock Buybacks and Dividends Remain Strong, companies have returned a large amount of funds to shareholders in either dividends or stock buybacks. It is important to note that buybacks can reduce EPS, but still add value to remaining shareholders. An article titled "Clear Thinking about Share Repurchase", dated January 10, 2006 by Michael Mauboussin, of Legg Mason Capital Management, provides analysis on how to evaluate share repurchases. One excerpt of the article notes:
"Corporate America is in an unusual position today: even after returning a record one-half trillion dollars to shareholders in 2005, companies remain flush. Cash balances are high, debt levels are low, and free cash flow has never been stronger. Delivering superior shareholder returns in upcoming years may require companies to show the same savviness in capital markets as they do in product markets.

How did we get to this situation? The events of this century’s first six years encouraged companies to focus internally, leading to today’s financial position. These include a brutal three year bear market in equities (2000-2002), a number of high-profile corporate scandals, terrorism, a tight U.S. presidential election, heightened perceived geopolitical risk, a recession, and increased regulation. Companies responded by honing their operations, limiting capital spending,hiring sparingly, and hoarding capital. A recent report noted that companies in major economies went from using over $500 billion in capital to fund their operations in 2000 to generating close to $600 billion in free cash flow in 2004, nearly a $1.1 trillion swing in just four years."
The reason an investor values corporate actions around dividends as more important is because of the longer term commitment a company makes regarding future dividend payments. Mauboussin's strategy article notes corporate executives view dividends and buybacks differently.
"Similarly, executives deem buybacks much more flexible than dividends, reinforcing the sense that dividends are a quasi-contract while buybacks are more discretionary (emphasis added). Finally, even though corporate finance relies heavily on the role of taxes in judging the relative virtue of dividends versus buybacks, surveys of executives suggest taxes are a second-order concern in setting payout policy."
Mauboussin goes on to note:
"a recent study suggests a number of repurchase programs are announced with the intention of misleading investors. The researchers focus on companies that aggressively deploy discretionary tools—a means to manipulate earnings—and find the companies suffer from poor operating performance over the long term. The analysis suggests these companies announce buybacks to boost the stock price in the short term. This risk adds ambiguity to the buyback signal, especially for open market programs."
One last point to highlight, and highlighted by Mauboussin is buybacks that result in a reduction in earnings per share can still add value for ongoing shareholders:
"earnings per share accretion or dilution has nothing to do with whether a buyback makes economic sense. The relationship between price and expected value dictates a stock buyback's economic merits...Nevertheless, managements persist in their efforts to maximize earnings per share—sometimes, we will see, at the expense of maximizing value. Why? First, they often believe the investment community mechanically and uncritically applies a multiple to current earnings to establish value. (As disturbing, many investors believe this, as well.) Second, many executive compensation schemes are partially tied to earnings targets.

The EPS management motivation has no sound financial basis. Whether a buyback program increases or decreases earnings per share is a function of the price/earnings multiple and either the company’s forgone after-tax interest income or the after-tax cost of new debt the company uses to finance the buyback. More concretely, when the inverse of the price/earnings multiple—often called the earnings yield—is higher than the after-tax interest rate, a buyback adds to earnings per share. When the earnings yield is less than the after-tax interest rate, a buyback reduces earnings per share. The relationship between the earnings yield and the after-tax interest rate has little or nothing to say about value."


Source:
Clear Thinking about Share Repurchase
Legg Mason Capital Management
By: Michael J. Mauboussin
January 10,2006
http://www.leggmason.com/funds/knowledge/mauboussin/Mauboussin_on_Strategy_011006.pdf