Wednesday, July 31, 2013

Equity Valuation by Country

Thomson Reuters (TRI) prepared  a chart that displays the equity valuation by country. Most country equity valuations are trading at their 10-year average valuation or lower. However, a few countries like Mexico, Sweden and Switzerland are trading at levels above their respective 10-year valuations.

From The Blog of HORAN Capital Advisors

Disclosure: Our firm holds a long position in TRI


Sunday, July 28, 2013

Mutual Fund Cash Levels Are Increasing

In my earlier post this week I noted investor money market assets as a percentage of all mutual fund assets were at a low level on a historical basis. If investor cash levels are at a low level, then where will the funds come from to propel equities to higher levels?

Interestingly, as the below charts indicate, various types of mutual funds have seen their cash levels increase. Either the cash is coming into mutual funds at a faster pace than fund managers can get it invested or fund managers are making a conscious decision to hold higher levels of cash. At the end of the day fund managers are evaluated on how their fund's performance compares with other funds and the fund's stated benchmark. As a result, it is likely this cash will find its way into investment assets other than cash. Although individual investors may have lower cash levels, it does appear, from a technical perspective, mutual fund cash levels are such that deployment of the cash can push equity prices higher. At a minimum, this cash may act as support for equities in the near term.

From The Blog of HORAN Capital Advisors

From The Blog of HORAN Capital Advisors

The coming week is loaded with potential market moving data.
  • Consumer Confidence on Tuesday
  • GDP reported Tuesday
  • Chicago PMI on Wednesday
  • FOMC interest rate decision on Wednesday. Additionally, the ECB and Bank of England are meeting as well.
  • Jobless claims reported on Thursday
  • ISM Manufacturing PMI on Thursday
  • A lot of earnings reports too. During the week of July 29th,  131 S&P 500 companies are expected to report earnings.


Wednesday, July 24, 2013

Investors Running Out Of Cash Available For Investments

With investors being paid virtually zero percent interest on money market cash for what seems an eternity, data suggests investors are buying almost any investment asset. Broadly speaking, all the talk has been how poorly emerging market investments have performed over the past few years. At HORAN Capital Advisors we even discuss the weak emerging market performance in our just released Investor Letter. Looking at fund flows though, the all equity, all bond and emerging markets mutual funds have been the beneficiaries of fund inflows this year.

From The Blog of HORAN Capital Advisors

The question often arises about mutual fund flow data not being comprehensive enough given the popularity of exchange traded products. Below are a couple of links to recent comments from Lipper about ETF flows.
The strong buying interest exhibited by investors during this bull market run since the end of the recession in 2009 is confirmed by the declining percentage of cash assets in money market mutual funds dividend by equity mutual fund assets. This declining trend is detailed in the below chart.

From The Blog of HORAN Capital Advisors

Investment Company Institute flow data also confirms flows out of money market mutual funds.

From The Blog of HORAN Capital Advisors

A curious question then is where will the additional investment dollars come from that can find away into equity investments? Avondale Asset Management posted a summary of the conference call notes from TD Ameritrade (AMTD). During the call TD Ameritrade mentions a number of details about the individual investor, one of which is the firm is seeing the start of a "mini" rotation out of bonds. Maybe this will be that source of cash that supports higher equity prices. On the other hand, the equity market does seem in need of rest, if only a brief one so one maybe does not need to be in a rush at the moment.

Disclosure: No position in AMTD


Tuesday, July 23, 2013

Investor Letter: Thoughts On The Second Half

Our firm's Second Quarter 2013 Investor Letter provides a review for the first half of the year. In our Letter we discuss our current investment position, as well as recent changes to our client portfolios. Our recent investment biases have served our clients well. Strategically we have favored U.S. equities and shorter maturity bonds while at the same time avoiding gold (broad commodities for that matter), preferred stocks and long-term bonds. The table below details the returns for various asset classes as of June 30, 2013.

Our contention for some time has been U.S. equities looked favorable relative to other equity investments due to valuation, strong balance sheets and the largest stimulus program in U.S. history. Our overweight bias in U.S. equities and underweight in foreign equity has been rewarded with significant outperformance of U.S. stocks over multiple time periods as illustrated above.

The complete Letter can be accessed directly from our website at this link: 2nd Quarter Investor Letter.

From The Blog of HORAN Capital Advisors


Friday, July 19, 2013

Warren Buffett On The Markets

In the below video Warren Buffett provides his take on stocks and the market. A couple of key points he mentions are:

  • A stock doesn't know you own it, and
  • Ones feeling about the market is not reciprocated by the market.


H/T: Abnormal Returns


Dow Rally Following Prior Market Contractions

The Chart of the Day charting service's recent report on Dow rallies following market declines of at least 30% shows the current rally is below average in both magnitude and duration. The report notes,
"The Dow just made another post-financial crisis rally high. To provide some further perspective to the current Dow rally, all major market rallies of the last 112 years are plotted on today's chart. Each dot represents a major stock market rally as measured by the Dow with the majority of rallies referred to by a label which states the year in which the rally began. For today's chart, a rally is being defined as an advance that follows a 30% decline (i.e. a major bear market). As today's chart illustrates, the Dow has begun a major rally 13 times over the past 112 years which equates to an average of one rally every 8.6 years. It is also interesting to note that the duration and magnitude of each rally correlated fairly well with the linear regression line (gray upward sloping line). As it stands right now, the current Dow rally that began in March 2009 (blue dot labeled you are here) would be classified as well below average in both duration and magnitude. However, when compared to the most recent post-major bear market rally (i.e. the rally that began in 2002), the current rally is significantly greater in magnitude and accomplished this feat in less time."

From The Blog of HORAN Capital Advisors


Thursday, July 18, 2013

Foreign Sales Increase For S&P 500 Companies

S&P Dow Jones Indices recently reported foreign sales data for S&P 500 companies for 2012. In the report, S&P 500 Foreign Sales Edge Up, it is noted there is some difficulty in obtaining foreign sales data since companies are not required to provide a breakdown when providing financial reports. Nonetheless, S&P explains the procedure used in reporting the information. In the final analysis the data shows foreign sales increased to 46.6% in 2012 versus 46.1% in 2011. Some highlights of the foreign sales breakdown are as follows:
  • In 2012, European sales represented 9.2% of all S&P 500 sales, down from 11.1% in 2011 and 13.5% in 2010.
  • The U.K. represented 1.7%, down from 2.4% in 2011, which had risen from 1.4% in 2010. The result is that European ex-U.K. sales represented 7.5% of all S&P 500 sales in 2012, down from 8.7% in 2011 and 12.0% in 2010.
  • Asian sales increased to 7.7% from 7.2% in 2011 and 6.1% in 2010.
  • Canadian sales continued to be volatile, even as Canada boasted a larger portion of sales than any other single country. Accounting for 4.0% of S&P 500 sales, Canadian sales are down from 4.3% in 2011, but up from 1.9% in 2010.
  • Information technology continued to be the most successful (and exposed) sector in terms of foreign sales. In 2012, 58.6% of its declared sales were foreign.
The breakdown by sector is displayed in the below table.

From The Blog of HORAN Capital Advisors

Given the large percentage of foreign sales by S&P 500 companies, investor should be mindful of the impact of currency exchange rates as the foreign sales are converted back to the U.S. Dollar. The country with the largest portion of foreign sales is Canada at 4.0%. Regionally, Europe accounts for 9.19%, Asia 7.66%, North America 4.73% and Africa 3.71%.

Source:

S&P 500® Foreign Sales Edge Up (page 15)
S&P Dow Jones Indices Insight Newsletter
By: Howard Silverblatt
Summer 2013
http://us.spindices.com/documents/education/insights-newsletter-201307.pdf?force_download=true


Wednesday, July 17, 2013

Dividend Payers Underperforming Non-Payers For First Six Months Of The Year

It seems much of the focus around the stock market this year has centered around investors chasing the dividend paying stocks. The theme of the discussion has been bond investors have been buying "bond like" stocks in an attempt to enhance the yield on their investments. The thinking has been bond yields are so low, one can buy dividend paying stocks with higher yields than a bond of the same company.

The downside to this investment approach is equities are more volatile than bonds. The other downside is dividend paying stocks have underperformed the non payers for the first six months of the year through June 30th. Some of the higher yielding stocks in the S&P 500 Index fall into the materials (metals and coal), utility and telecumminucations sectors of the market and these stocks have been weak performers year to date. As the below chart from S&P Dow Jones Indices shows, the average return of the non payers has exceeded the payers for the time periods listed below during the past twelve months.

From The Blog of HORAN Capital Advisors

A list of the company yields and returns can be found at this link: Return and Yield File.

In spite of the payers underperformance, investors in dividend paying stocks have enjoyed nice growth in the income generated through the growth in a company's dividend. Howard Silverblatt, Senior Index Analyst at S&P Dow Jones Indices, noted recently of the approximately 10,000 U.S. traded issues,
“Dividends continued to increase in the second quarter with actual cash payments increasing 15.5% and the forward indicated dividend setting another all-time high. Payout rates, which historically average 52%, continue to remain near their lows at 36%. At this point, year-to-date dividend payments are up 13.9%, with 2013 easily expected to surpass the 2012 record dividend payment.”


Saturday, July 13, 2013

End Of Low Interest Rate Environment: Where To Invest

The recent market focus has been centered on Ben Bernanke's comment that the end is near for a very accommodating Federal Reserve, i.e., quantitative easing (QE) tapering is near. The market's reaction was one where the 10-year Treasury rate shot higher (prices declined) as evidenced in the below chart. This rise in rates also influenced mortgage rates as detailed in the second chart below.

From The Blog of HORAN Capital Advisors

From The Blog of HORAN Capital Advisors

Consuelo Mack of WealthTrack noted prior to her interview (link below) with Richard Bernstein and Dan Fuss that investors pulled $60 billion out of bond mutual funds. As a point of reference, in the four years (2009 - 2012) investors poured $1.1 trillion into the fixed income or bond asset class. Trim Tabs reports investors are now putting these funds into stock or equity funds. As an aside Trim Tabs notes historically the individual investor has been extraordinarily bad at market timing.

In Consuelo Mack's recent interview with Richard Bernstein, a top-ranked strategist, turned portfolio manager, and Dan Fuss, a Loomis Sayles’ bond fund manager, both provide their contrarian views as to whether the 30-plus years of falling interest rates may be winding down. Bernstein favors the US domestic equity market and particularly mid-cycle companies. Mid cycle firms tend to be industrials, manufacturing, some technology companies and some financials. They are not commodity and energy related companies.

As it relates to manufacturing in the U.S., WealthTrack has provided a report prepared by Nancy Lazar's new firm, Cornerstone Macro. Lazar was a co-founder of her former firm, the highly rated ISI Group, one of the top economic/strategy firms on Wall Street. This new report notes that Cornerstone's favorite emerging market is Middle America. Cornerstone believes a decoupling is taking place between the US and emerging market economies due to competitive labor cost in the US and favorable energy costs in the US.


Monday, July 08, 2013

Equal Weighted S&P 500 Outperforming Cap Weighted S&P 500 Index

The equal weighted S&P 500 Index ETF, RSP, continues to outperform the capitalization weighted S&P 500 Index on a year to date basis. The equal weighted index maintains a higher weighting in the smaller cap companies in the S&P 500 Index and small cap stocks (IWM) have been outperforming the larger cap issues this year.

A part of this outperformance may be attributable to the fact small cap companies have less exposure to the international markets, both developing and emerging. Developed and emerging markets have been weaker performers this year as the economic growth rates in emerging markets is slowing. Developed market economies are dealing with the ongoing effects of eurozone issues.

From The Blog of HORAN Capital Advisors


Sunday, July 07, 2013

Women And Investing

Consuelo Mack of WealthTrack recently aired two interview segments that focused on women and their investing and retirement needs. American women control $8 trillion in assets and this figure is expected to grow to $22 trillion by the end of the decade. Yet the traditional wealth management approach doesn’t necessarily work for women’s needs. In the first video Consuelo Mack's guests, Morgan Stanley’s Ami Forte, and GenSpring’s Senior Strategist, Jewelle Bickford, discuss how women can start taking ownership of their financial power.

Importantly, only 1 in 5 women have determined how much money they will need in order to maintain their lifestyle in retirement. From a longevity perspective, on average women will live 5 years longer than a man. Today, 75% of the population age 85 years old or over is comprised of women.

In the second video below (Part II), Consuelo Mack notes, "Women worry about becoming bag ladies in their old age and men focus too much on performance numbers, which isn’t always the best way to plan for the future."  Her guests are Mary Beth Franklin, a contributing editor for InvestmentNews as well as an expert on social security, and Erin Botsford, founder and CEO of the Botsford Group, where they explain why women are so different from men in their approach in planning for the so-called “Golden Years”.


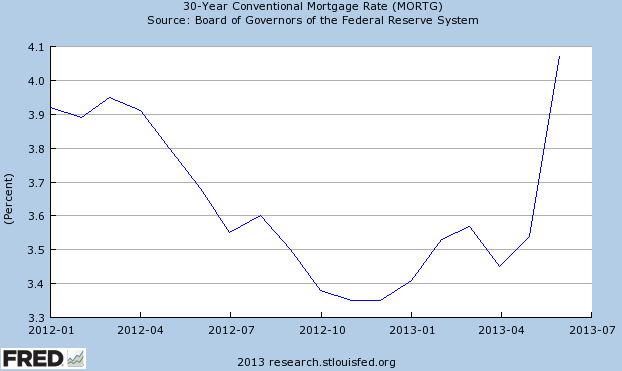
In the first video the guests note investments today are more than simply allocating ones investment funds between stocks, bonds and cash. At HORAN our investment approach incorporates other asset classes as well. Our alternative allocation is an effort to enhance a client's investment returns without taking the same level of risk as equities, but generate a return better than fixed income or bonds. As Ami Forte notes in the first video, bonds were traditionally known as safe asset class, however, the recent rise in interest rates has exposed just how risky the bond asset class can be.


Friday, July 05, 2013

Elevated Number Of Part Time Workers

Today's release of the non-farm payroll report noted one troubling aspect of this recovery following the recession that ending mid year 2009. The job market strength during this recovery seems more centered in part time employment.

From The Blog of HORAN Capital Advisors

From The Blog of HORAN Capital Advisors

There are a number of reason for why this might be the case, but the impact on economic growth is not generally positive. Part time workers are less likely to feel secure in their jobs so may limit their personal expenditures. And with consumers accounting for nearly 70% of economic growth (GDP), this tighter reign on spending is likely keeping the economy from growing at a potentially higher rate that is more typical following recessionary periods. Additionally, this low rate of employment growth has kept the job market from recovering to levels reached prior to the beginning of the recession as noted in this chart from the Calculated Risk website.