Showing posts with label Valuation. Show all posts

Thursday, December 13, 2018

Trend In Index Earnings More Important Then A Slowing Rate Of Earnings Growth

One issue strategists are highlighting of late is the fact the earnings growth rate for the S&P 500 Index in 2019 is expected to decelerate from the mid to high 20+% level this year to the mid single digit percentage level in 2019. Some have indicated this slowing earnings growth rate may negatively impact U.S. equity returns next year. Of course the strong rate of earnings growth this year is due in part to the benefit companies have received from the tax cut. In addition to the tax cut benefit though, companies are seeing top line revenue growth in the high single digit percentage level. Although earnings will remain at a higher level due to the lower tax rate, the year over year growth rate in earnings will fall back to a more normalized level next year as the earlier year comparison is a higher number.


Sunday, July 01, 2018

If Earnings Matter, Equity Valuation Looks Attractive

With last week's final reading on first quarter GDP, the Bureau of Economic Analysis provides a final review of the National Income and Product Accounts (NIPA). One category worth evaluating is the corporate profits figures. Corporate profits from the NIPA tables are true economic profits from IRS data and not simply profits based on GAAP. In the final GDP report last week, corporate profits with IVA & CCAdj totaled $1.92 trillion at a seasonally adjusted annual rate versus $1.64 trillion in the same period a year earlier. This represents a nearly 17% increase in profits from a year earlier.


Thursday, March 15, 2018

Improved Earnings Growth Expectations Broadly Reduce PEG Ratios

Before passage of The Tax Cuts and Jobs Act in December, earnings growth for the S&P 500 was expected to be low double digits in calendar year 2018. Since passage of tax reform, a significant improvement in earnings growth expectations has occurred. The below table shows I/B/E/S earnings growth expectations in October by sector and for the S&P 500 Index compared to expectations as of the end of last week.


Sunday, March 11, 2018

Individual Investors Favoring Technology Stocks

Periodically I review the most active stocks individual members of Better Investing indicate they are purchasing. A notable feature on the current list is the fact technology related stocks are dominating member purchases.


Additionally, after the market's close on Friday, I posted a tweet noting Fidelity customers' top purchases. Again, technology stocks are gaining the interest of Fidelity's individual investors.


With both the technology sector SPDR (XLK) and the Nasdaq Index both achieving record highs on Friday, one might believe the technology sector is getting over heated. The interest in technology has led to acronyms for various groups of stocks, with the most familiar being the FAANGs, representing Facebook (FB), Amazon (AMZN), Apple (AAPL), Netflix (NFLX) and Google (GOOGL), now known as Alphabet. As the below chart shows, the technology sector in the S&P 500 Index accounts for 25.2% of the index weighting and is approaching the technology bubble peak of 32.9%. One major difference today though is the fact the valuation of the technology sector holdings is not even close to the bubble peak valuation. At the height of the technology bubble in 2000, the technology sector P/E equaled 82 times trailing earnings. Today, the trailing technology sector P/E is 23 times earnings.


In spite of the fact a few technology or technology related stocks trade at higher P/E multiples, the valuations are far from bubble levels seen in 2000.


Tuesday, December 19, 2017

Companies Begin Highlighting Earnings Benefit From Tax Reform

It seems a day does not go by where the market's valuation is a front and center topic of discussion. Suffice it to say that I believe, and have written as such recently, that the market does not correct simply because it may be trading at an elevated valuation. Although market declines or pullbacks have been few and far between, when the next pullback occurs, a factor in the the magnitude of the decline will likely center on the market's valuation.

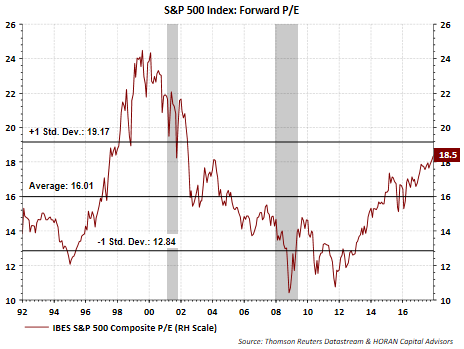
The below chart shows the current market P/E where the earnings are based on the 12-month forward earnings estimate supplied by I/B/E/S. Certainly the P/E is elevated at near a +1 standard deviation level, still the current P/E is quite a bit lower than the technology bubble valuation peak of near 25 times earnings.


Overall earnings growth will be important for the equity market to generate respectable returns in 2018. With passage of a tax reform package nearing realization, companies will benefit from the decline in the maximum corporate tax rate. As an example, tonight FedEx (FDX) reported earnings and noted in the conference call that a lower tax rate will add $.85 to $1.00 to per share earnings. This represents an earnings boost of 8% based on currently expected May 2018 earnings of $12.45 per share. What the tax bill does for many companies is provide an earnings benefit that will result in a reset of the market's valuation to a lower level. The result is the market's valuation is closer to its long run average of 16 to 17 times earnings.

Disclosure: Long FDX


Wednesday, November 29, 2017

Strong Corporate Profit Picture A Key Component In Today's GDP Report

Included with today's second estimate GDP report by the Bureau of Economic Analysis is the preliminary estimate for third quarter corporate profits. The corporate profit measure is reported in several different formats, i.e. with and without inventory valuation and capital consumption adjustments. As I noted in a June post, more information on the adjustments can be found can be found in this BEA Briefing Paper (PDF).

The profit growth before tax and with the inventory valuation and capital consumption adjustments equaled 5.4% on a year over year basis. Without the adjustments, year over year profit growth equaled 10%. Importantly, NIPA profits have a nearly 1.0 correlation to IBES S&P 500 forward earnings and historically peak four quarters, or a year before the IBES forward earnings estimate. This preliminary corporate profit report is not signalling a peak in IBES S&P 500 forward earnings.


Also, with the preliminary corporate profit growth figure one can evaluate the NIPA P/E. The growth in NIPA corporate profits has resulted in a slight decline in the NIPA P/E as can be seen in the below chart. As I noted in the June post referenced above, what is useful with the NIPA profit measure is the fact it covers a larger earnings base for the U.S and covers more industries as it is not limited to public companies. Additionally, the NIPA figure makes an effort to adjust for the differing accounting measures being utilized by companies.


By reviewing some of my posts written over the past few months, the lack of any meaningful market pullback has been one recurring theme. However, with the continued strength exhibited in corporate profit growth, the market's path is certainly warranted as stock prices follow earnings. Also, the strong profit picture is beginning to result in a downtrend in the market's NIPA valuation, without a significant correction taking place. That does not mean high valuation equities will not correct more significantly, like what occurred in some technology stocks today. All in all, today's revision higher in Q3 GDP and the prelimnary profit report are both tailwinds for the economy and equity markets, all else being equal.


Monday, November 06, 2017

Investment Opportunities Outside The U.S.

In a post yesterday I somewhat rhetorically titled the post wondering if the equity market was at a top. In short, I do not know, but offered suggestions for investors about reviewing their asset allocation vis-à-vis their spending needs.

Not all markets have traveled the same path as the S&P 500 Index though. A number of markets outside the U.S have lagged the U.S. since the end of the financial crisis. The below chart compares the cumulative performance of the S&P 500 Index (SPY) versus the MSCI ACWI ex U.S Index (ACWX). The chart goes back to the beginning of 1992 and clearly the S&P 500 has a performance advantage with a widening gap beginning to develop around 2011.


Sunday, July 30, 2017

Equity Valuations No Longer Matter?

One benefit to writing blog content is it serves as a record of ones past thinking and the results of any decisions made from the prior analysis. With that in mind I reviewed some of the topics written over a year ago, that is, in June/July of 2016. A few of the topics at that time had to do with valuations, PEG ratios and the fact the market was trading at an all time record high. In fact one article was titled, Is It Right To Be Bullish Near A Record Market High? The conclusion at that time was to stay invested in equities as I wrote then,


Saturday, October 08, 2016

Why We Sold Tyson Foods In September

At the end of September our research led us to sell Tyson Foods (TSN) common stock in our client accounts. Our firm relies heavily on fundamental research in our stock research in order to uncover buy and sell opportunities for our clients' portfolios. What led us to our sell decision was not the direct reason TSN was down nearly 9% on Friday, but an indirect one.

As background, our firm added TSN to client accounts in May of 2015 following the stock's decline as a result of bird flu showing up in poultry in Arkansas where Tyson has poultry operations. In short, we felt the bird flu issue was a temporary one and that TSN would recover from this issue. Additionally, we expected TSN to benefit from its acquisition of Hillshire Foods that had closed in August 2014. The acquisition benefits materialized, the bird flu situation passed, and TSN's stock price recovered nicely. After our initial decision to purchase TSN on May 14, 2015 at $41.76, we trimmed the holding on May 19, 2016 at $64.88, a 55% gain after one year. One of our risk control disciplines takes into account position size and this was one of the reasons for trimming the holding in May. We sold the remaining TSN position on September 30 at a price of $74.52 and the sell was made for fundamental reasons.

Tyson's stock is not necessarily trading at an extended valuation, 18 times earnings at the time of our sell, when compared to the overall market. Additionally, the earnings growth rate for Tyson in the later part of 2015 and through September of 2016 has been strong. As the below snapshot of earnings shows, YOY growth ranged from 49.4% to 51.3% in Q3 2016. Fourth quarter (9/30/2016) is expected to see YOY growth of 33.5%.


Beginning in the December quarter though, YOY earnings growth is expected to decline to single digits, 7.1%. Further, without share buybacks, the YOY earnings growth rate would equal only 2.6%. Therein lies our issue with the stock. Tyson is a good company, but the company's stock price seems to have gotten ahead of earnings growth fundamentals at least near term. One factor that tends to serve as a headwind for stocks is when the growth rate of earnings is slowing over time, especially after being strong for an extended period of time historically. In this slowing earnings growth environment, often times a stock's valuation will adjust to account for the slowing earnings growth rate. This adjustment can occur either over time by trading sideways or can adjust in price be some decline in the stock's price.

This leads me back to the 9% decline in TSN's stock price on Friday. The decline was in response to a research report released by Pivotal Research Group. In the report Pivotal indicated there might be price fixing issues related to broiler chickens. The report's conclusion is related to a class action complaint filed on September 2nd, Maplevale Farms, Inc. v. Koch Foods, Inc. et al, According to Pivotal, "The complaint alleges that Tyson, together with Koch Foods and multiple other players in the broiler chicken business, systematically colluded to reduce production of broilers since about 2008. The mechanism for collusion is not a shady meeting in a hotel room, as was once done by players in the lysine market. Rather, the complaint alleges supply collusion occurred through nonpublic data exchange; detailed industry reports compiled on a daily or weekly basis by Agri Stats, Inc., a subsidiary of Eli Lilly and Co., and then sold back to industry participants."

In conclusion, all else being equal, at the time of our last sell of TSN, we believed the company's stock valuation needed to decline to a mid to low double digit P/E multiple given the slowing earnings growth rate. With Pivotal highlighting the recent class action lawsuit, this to could have a negative impact on TSN margins and future earnings growth. As a result TSN's stock price has and is adjusting to a P/E multiple that is more in line with the anticipated growth rate of TSN earnings. For investors, when earnings growth of a company slows from over a 40% growth rate to single digits, a stock's price will often adjust downward to account for this slowdown. On top of this, when secondary news like the above noted class action lawsuit comes out, a stock priced for perfection can decline sharply, as was the case for TSN Friday.


Sunday, July 03, 2016

An In Depth Look At The Extended Valuation Of Defensive And Income Yielding Equity Sectors

Early last week I highlighted the extended valuation of the utility sector in part due to investor demand for income yielding stocks. Not only are the income sectors attracting investor dollars, defensive sectors like consumer staples are as well. A result of this investor demand for defensive and income producing equities is these sectors have produced market beating returns so far in 2016. As the below sector return chart shows, the defensive consumer staples sector and the income yielding sectors like utilities and telecommunications have generated strong returns this year.


However, the strong return in these sectors has pushed the sector valuation beyond the average longer term valuation for each respective sector itself. The better performing sectors, utilities and staples are some of the most extended compared to the other sectors. Energy sector valuations are at extremes, largely due to earnings headwinds resulting from lower oil prices.


Monday, June 27, 2016

Income Yielding Equity Sector Valuations Near Historical Highs

Towards the end of 2015 and far ahead of the BREXIT induced market downturn, investors began to seek the apparent safety of income yielding equities. The initial motivation for this seems to have been investors seeking yield outside of fixed income where yield seems hard to find in this low interest rate environment. The consequence of this pursuit of yield is the valuation of some of the defensive, income yielding sectors has been pushed to extremes. This move towards higher valuations has been exacerbated by the BREXIT outcome. One example of this is the utility sector.

The below chart displays the performance of the S&P 500 Index sectors for the year to date period through June 27, 2016. Three of the top performing sectors are viewed as defensive ones and tend to be comprised of companies that pay and grow their dividends, i.e., utilities, telecom and consumer staples sectors. The top performing sector is utilities garnering a return of 19.8% so far this year.


Of importance, investors should keep in mind the utility sector is trading at a near record valuation based on the sector's forward price to earnings ratio of 17.8 times (blue line.)


Other sectors such as consumer staples and energy also trade at higher valuations or P/E multiples as well. Yardeni Research ($$) updates sector valuations on a periodic basis and their most recent report can be read here. Sectors, and for that matter specific stocks, can remain elevated from a valuation perspective for an extended period of time. However, when rates rise and/or a more risk on equity environment returns, these defensive sectors are likely to underperform.

S&P Dow Jones Indices and Factset recently highlighted the continued growth in cash balances for S&P 500 companies. A part of this cash growth has gone towards dividend payments and stock buybacks as I noted in a post yesterday, Stock Buybacks Up Double Digits In First Quarter, In Factset's report released today, they acknowledge the growth in cash levels; however, they also note the Cash to Debt Ratio for S&P 500 companies (ex-financials) has fallen to its lowest level since the second quarter of 2009. And back to utilities, six of the top ten companies with the lowest cash to debt ratios are utilities as can be seen in the below table.


There is more to valuation than simply looking at cash/debt ratios, and utility rates are regulated and maybe more sustainable from that point of view, but higher demands on cash due to debt payments can become an issue for utility companies. Just last month Moody's downgraded the long-term senior unsecured rating of The Southern Company (SO)to Baa2 from Baa1 due to increased debt levels and lower cash flow coverage resulting from an acquisition.

For investors pursuing investments in higher dividend yielding equity sectors, paying attention to valuations and coverage ratios is important. Additionally, not if, but when a risk on equity environment returns, these defensive, income yielding stocks could come under pressure.


Sunday, March 08, 2015

Additional P/E Multiple Expansion Possible Until The First Fed Rate Hike

A common occurrence in equity bull market cycles is the fact that a company's valuation, or P/E multiple, expands. This so called multiple expansion is one factor that contributes to overall equity returns during bull market phases. The downside to multiple expansion is it does not occur ad infinitum. As the below chart shows, the P/E multiple for the S&P 500 Index has expanded by 64% by increasing to 17.3x earnings versus 10.6x earnings at the start of the current bull market.

From The Blog of HORAN Capital Advisors

One factor that will cause multiple expansion to come to an end, and ultimately revert to contraction, is an increase in interest rates. The reason for this is investors will value future earnings less when a higher discount rate is used to value those earnings in equity valuation models.

The market took Friday's job report as another sign the Fed is nearing a time where it will increase short term interest rates. The job report showed 295,000 jobs were generated in February. The report also noted the unemployment rate declined to 5.5%, which is the lowest level since May 2008. One data point that continues to generate differing points of view is the labor force participation rate. This part of the report noted the participation rate fell slightly to 62.8% from 62.9%. Many market strategists are viewing the jobs report as another sign the Fed is nearing an end to easy monetary policy and a rate hike in June or at the latest by the end of summer.

So with a rate hike nearing, will market forces result in a P/E multiple that begins to contract? Historical data shows; however, market multiples have broadly expanded up until the time of the first rate increase. A report by Sam Stovall, U.S. Equity Strategist for S&P Capital IQ, notes, "After examining the 16 times since 1946 that the Federal Reserve started a rate tightening program, the median multiple on trailing 12-month GAAP (or “As Reported”) EPS rose from 17.7X six months before to 17.9X three months before and 18.5X on the date of the first rate increase. Only in the three and six months after the Fed started raising rates did the P/E median decline to 18.1X and 16.7X, respectively." In a recent report from Goldman Sachs, they include a table comparing S&P 500 returns along with the impact on valuations before and after Fed rate increases. As can be seen in the below table, P/E multiples and returns are positive up to the first rate increase.

From The Blog of HORAN Capital Advisors

Also, given the near zero level of interest rates along with the low level of inflation, equity valuations are not as stretch as they may appear in nominal terms.

From The Blog of HORAN Capital Advisors

The Fed does appear to be in a position where an interest rate increase is likely to occur this year. One could surmise the Fed is in a position where they need to get rates back to a more normalized level. At this near zero interest rate level, the Fed has fewer monetary options to implement in the event an economic shock where to occur. Additionally, because rates are at artificially low levels, history has shown there is a positive correlation between stock prices and interest rates when rates rise from levels below 5%.

From The Blog of HORAN Capital Advisors

A part of the reason for this is when rates are at such extreme lows, initial rate increases are instituted simply to get rates back to a more normal level. When rate increases occur at levels higher than 5%, this can be a sign of an overheating economy with the Fed's intention to slow down the economy. As the economy slows, corporate earnings are likely to slow, resulting in equity prices declining as well.

For investors then, as a rate hike does seem near,  positive equity market returns can be achieved up until the time the first rate increase occurs. Also, a portion of the returns can be generated from a continued expansion of P/E multiples.


Tuesday, March 25, 2014

Further Multiple Expansion Possible

In a recent white paper by Fidelity Investments the authors show that valuation in and of itself is a poor predictor of future short term market returns. The report evaluates a number of valuation indicators, including the Shiller CAPE, and points to some shortcomings with the CAPE calculation. In addition to Fidelity, Jeremy Siegel has highlighted issues with the CAPE calculation. Nonetheless, valuation is certainly important for investors to pay attention to as they allocate investment dollars to equity. The Fidelity report does show that valuations are a much better predictor of longer term market returns.

As we noted in yesterday's post, Equity Market Continues To Track Like the 1990s, one characteristic over the past two years similar to the mid 1990s is the fact multiple expansion has enhanced recent equity market returns. Like Fidelity, at HORAN Capital Advisors, we to believe multiple expansion is likely to continue to enhance returns over the near term. The below chart shows the role multiple expansion had in the mid 1990s compared to the  returns in 2012 and 2013.

From The Blog of HORAN Capital Advisors

The Fidelity report includes commentary on valuation measures beyond CAPE and trailing and forward PEs. We have written about the importance of looking at alternative measures of valuation like P/NIPA (price to national income and product account corporate profits) and P/CF (price to cash flow.) Both of these measures have benefits and disadvantages; however, they do make an effort to look at a more comprehensive economic earnings picture or evaluate earnings excluding one time write-offs.

No one measure is a panacea in determining the "right" valuation for the market. However, there is enough data provided by these alternative measures that gives some confirmation that multiple expansion can continue to have a positive impact on large cap equity market reurns in the near term.

Source:

U.S. Equity Valuations Not an Obstacle in 2014
Fidelity Investments
by: Jordan Alexiev, CFA, Senior Analyst; Austin Litvak, Senior Analyst
March 2014
http://www.pyramis.com/fileadmin/templates/pyramis_public/downloads/us/TL_EQ_US-Equity-Valuations-Not-an-Obstacle-in-2014__Pyramis.pdf


Thursday, November 07, 2013

Are Small Cap Valuations Getting Extended?

Since the beginning of November, small cap stocks have been underperforming large caps. This recent underperformance has strategist questioning whether the small cap outperformance, since the end of the financial crisis in 2009, is coming to an end. As the below chart shows, since February 2009, small caps have significantly outperformed large capitalization equities.

From The Blog of HORAN Capital Advisors

This outperformance has caused the valuation of small caps to reach a premium relative to large caps. T. Rowe Price recently highlighted this valuation premium in their Fall 2013 T. Rowe Price Report newsletter. The below chart that accompanied the article, Leading Market Recovery, Small-Caps Face New Challenges, notes small caps are selling at a 14% premium to large caps.

From The Blog of HORAN Capital Advisors

Preston Athey, manager of T. Rowe Price's Small Cap Value Fund, states, "It’s harder finding attractive opportunities today than two to three years ago, so a value investor tends to be cautious. We’re paying 15 times earnings today for companies that were selling at 11 times earnings three years ago."

I believe investors should take to heart Athey's cautionary comment of, "But if we get a major correction or a mild recession, the market will go down and small-caps will do worse because this sector is more volatile. After a long period of good performance and outperformance, the caution light should be on now rather than flashing green."


Saturday, April 27, 2013

Sector Rotation May Be Underway

One aspect of the strong performance for the S&P 500 Index so far this year has been the outperformance of the defensive market sectors. As the below chart details, the top performing sectors this year are health care (20.5%), utilities (18.8%), consumer staples (17.8%) and telecommunications (15.3%). A notable characteristic of the defensive sectors is their higher dividend yields. With the near zero interest rate environment being perpetuated by the Federal Reserve, investors seem to be allocating some of their investment dollars to these higher yielding stocks and sectors.

From The Blog of HORAN Capital Advisors

Last week though saw a shift in which sectors were contributing to the market moving higher. As the below chart shows, the previously mentioned sectors that contributed to the positive market move on YTD basis were the worst performing sectors last week. Telecommunications, consumer staples, health care and utilities all were the worst performers. The more cyclically sensitive sectors performed the best: financials, materials, technology and industrials.

From The Blog of HORAN Capital Advisors

A characteristic of the defensive sectors at this point in time is they are trading at higher P/E multiples relative to the S&P 500 Index. The utilities, staples and health care sectors are each trading at multiples of near twenty times earnings or higher.

From The Blog of HORAN Capital Advisors

For investors, keep in mind that stocks/sectors will trade on future earnings growth prospects. Factset's earnings summary report released on Friday does show the sectors with the best anticipated earnings growth in 2014 are the more cyclically exposed sectors and not the defensive sectors that have worked so well for investors this year.

From The Blog of HORAN Capital Advisors


Monday, December 10, 2012

The Arithmetic Of Equities

The research paper noted below, a good read, has been making the rounds over the weekend. The report discusses bond valuations relative to stocks and when one asset class appears more attractive than the other. The paper's author, Andrew J. Redleaf of The White Box Advisor, states he is really a "bond guy" but notes the following:
"Basically I am a bond guy. I like fat coupons. And I like return of principal. But I take my bonds where I can find them. And these days the place to find fat coupons and return of principal is among blue chip equities."
Arithmetic-of-Equities

h/t: Market Folly


Monday, January 02, 2012

Equity Risk Premium Near An Extreme

The equity risk premium recently reached levels last seen at the height of the financial crisis in 2008. The high risk premium level suggests equities are attractive at this point in the market cycle. One key is whether corporate earnings can continue to make new record highs in 2012. Earnings growth is expected albeit at a slower rate than achieved in 2011. Given the level of stock buybacks and more importantly, company dividend increases, it seems equities could do well looking forward. The buyback and dividend actions by companies provide some level of favorable insight into company earnings expectations. As is typically the case, unforeseen events can derail a favorable market environment. The known risks are numerous and will continue to result in somewhat volatile price action (sovereign debt issues, political rhetoric in the U.S., dealing with the U.S. budget deficit and debt levels, just to name a few), but our forecast suggests equity prices should end 2012 higher.

From The Blog of HORAN Capital Advisors


Saturday, June 25, 2011

Mid Cap Relative Valuations At Historically High Levels

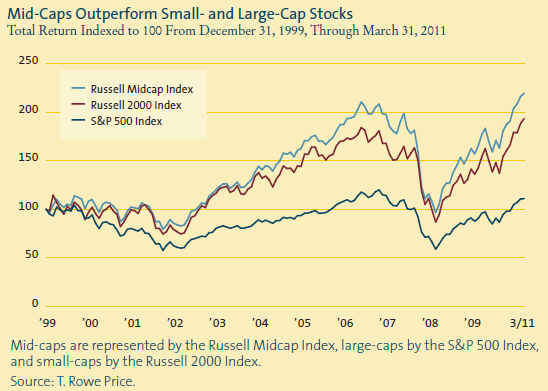
Since January 1, 2000 small cap and mid cap stocks have significantly outperformed large cap U.S. equities.

From The Blog of HORAN Capital Advisors

From a valuation perspective, since the beginning of 1992, mid cap equities are trading at historically high valuations compared to large cap stocks on a relative basis. Absolute valuations of mid cap stocks still look reasonable; however, if there is a reversion to the mean, large cap equities are likely to gain the upper hand on performance as one looks forward. Maintaining some exposure to mid caps will likely be beneficial though as merger activity often times targets the mid cap companies.

From The Blog of HORAN Capital Advisors


Sunday, May 22, 2011

Small Cap Valuations Getting Extended

On a relative basis, small cap stock stocks are trading at near record levels from a valuation perspective since 1990.

From HORAN Capital Advisors

A part of the valuation difference is a result of the strong performance achieved by small cap stocks versus large cap stocks. As the below chart details, the 10-year return of the Russel 2000 small cap index has far outpaced the return of the S&P 500 index, 70.8% versus 6.7%, respectively.

From The Blog of HORAN Capital Advisors


Sunday, May 01, 2011

Strong Earnings Growth Supporting Market Advance

Strong earnings growth so far in the first quarter for companies in the S&P 500 Index is an important factor that explains the strength of the recent advance in the market. As the below chart shows, Q1 earnings expectations for S&P 500 companies has increased significantly.

From The Blog of HORAN Capital Advisors
  • The estimated growth rate for earnings in Q1 for S&P 500 companies is 18%.
  • The forward four quarter P/E ratio for the S&P 500 Index stands at 12.9.
  • Through the end of April, 324 companies have reported earnings, with 84% either exceeding or meeting expectations.
  • Companies are reporting earnings that are 7% above estimates which is greater than the 2% longer term average surprise factor.
Source: Thomson Reuters