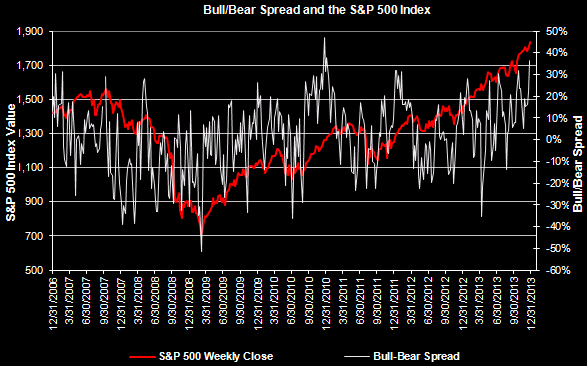
It is always difficult for investors to guess the bottom of a market correction (or pullback) or time the turning point with pin point accuracy. The difficulty is more clouded today given the Fed's quantitative easing activities and now the timing of the Fed's so called tapering. In the long run economic and company fundamentals are the driving force behind the market's performance and the performance of individual companies for sure. With the strong equity market performance so far in 2013 investors might be enticed to lock in their paper gains. The recent selling pressure experienced by the equity markets might be just that, locking in some gains or tax loss selling.
It seems so long ago, but on the first page of our
first quarter investor letter we discussed the calendar year returns for the S&P 500 Index going back to 1980 and included a graph with the maximum correction in each of those years. Interestingly, we believe we may be in a period today that resembles the mid 1990's where multiple expansion was a critical factor in the strong equity market returns achieved at that time. We discussed
multiple expansion in our third quarter investor letter. The point in repeating this commentary is what is different today than at the beginning of 2013?
The above are just a few favorable economic data points. At HORAN we continue to believe the economy is improving but at a slow "bounce off the bottom" pace.
Correction: 12/17/2013
Following the posting of this article last week a reader noticed a difference in the put/call ratio reported above and a graph in the original post and that reported by the CBOE. Our original commentary and graph was CBOE data received from a third party and the reported p/c ratio was incorrect. The correct ratio at the close on Friday was .53. The below graph is an update with the corrected data. (Our practice is to strike through the original commentary and replace with the updated data if we make the change more than a 2 hours after the post.)
As we noted in our November 2012 article,
"the equity P/C ratio tends to measure the sentiment of the individual investor by dividing put volume by call volume. At the extremes, this particular measure is a contrarian one; hence, P/C ratios above 1.0 signal overly bearish sentiment from the individual investor. This indicator's average over the last 5-years is approximately .7 .64..."
Additionally, the below chart shows a few more technical indicators that may indicate the market is approaching oversold levels. Specifically, the fast component of the
stochastic oscillator has reached oversold levels. The slow calculation has not, however, as noted above, it is difficult to time the exact bottom of the market. Also, the
money flow indicator (MFI) is nearing a level indicative of an oversold market as well. Key market support for the S&P 500 Index is the 1775 level and bullish investors have been able to hold this level.
At the end of the day, economic and company fundamentals are improving albeit at a slow pace. Recent selling activity may have more to do with tax loss selling and some investors locking in gains achieved so far this year. Technically, some indicators indicate the market is near an oversold level (and difficult to predict the bottom) with one wild card being the Fed's tapering impact and timing as the market is focused on the negative consequences of tapering. Lastly, the debt ceiling debt will be top of mind as we approach an early February 2014 deadline for that.


