Friday, November 25, 2011

Investor Sentiment Not As Bad As I Expected

Given all the negative news one is hearing and reading about, I expected investor bullish sentiment to be much worse than actually reported by AAII. Much of the European news is negative and today, at the close of trading, the Dow Jones Industrial Average reported its worst Thanksgiving week performance (-4.8%) since the markets began observing the Thanksgiving holiday in 19421.

As the below chart details, the bullish sentiment declined to 32.7% this week versus last week's reading of 41.9%. Bearish sentiment rose to 38.3% versus the prior week's level of 31.0%. This results in a bull/bear spread of -5.6%. Market bottoms have generally occurred when the bullish sentiment reading falls into the 20%+ range and the bull/bear spread widens to a negative 20+%.

From The Blog of HORAN Capital Advisors

Additionally, the CBOE Equity Put/Call Ratio, although elevated, was reported at .72 on Wednesday. In the case of the equity/put call ratio, a level above 1.0 is a pretty good sentiment level suggesting the market may be oversold.

From The Blog of HORAN Capital Advisors

Lastly, the percent of S&P 500 stocks trading above their 50 day moving average has declined from over 90% at the beginning of November to 21% on Wednesday. The market appears oversold by this measure, however, not significantly.

From The Blog of HORAN Capital Advisors

1The Wall Street Journal


The Euro Crisis: Revisiting Pitfalls Of The Gold Standard

The current issues impacting the Eurozone countries harkens back to the problems with the gold standard in the 1930s. Many believe the U.S. depression in the 1930s was worsened by the fact the U.S. and many other countries were on the gold standard. With the gold standard exchange rates were fixed i.e., depreciating ones currency was not an option. The gold standard did not create the depression; however, it most likely pushed the country into a depression. For more on this, one can read, "The Gold Standard and the Great Depression" in Contemporary European History by Barry Eichengreen and Peter Temin.

With the Euro, currency depreciation is not available to countries like Greece. As a recent Bloomberg BusinessWeek article noted, the option available to these stressed countries is cutting wages and government benefits. Now I am not saying this is a bad idea; however, significant economic contraction occurs. BusinessWeek notes,
"The most unfortunate difference between then and now is that the euro, unlike the gold standard, is a raccoon trap: Its designers deliberately left out an exit procedure. That means you can get in, but you can’t get out without leaving a part of yourself behind. Eichengreen points out that Britain was growing again by the end of 1932, just over a year after abandoning gold under duress. Today a country—say, Greece—that quit the euro would take far longer to right itself. That’s because unlike Britain, to get relief Greece would have to default on its euro-denominated debts and damage its credit rating. "The Greek government," Eichengreen says, 'will be hard-pressed to find funds to recapitalize the banking system. Greek companies won’t be able to get credit lines. The new Greek government is going to have to print money hand over fist. At some point they would be able to push down the drachma and become more competitive. But the balance is different now.'"
In the end, the worst part of the Euro union was the fact it was/is a monetary union and not a fiscal union. The decisions in Europe will be difficult; however, in order to prevent a contagion, the ECB will likely need to structure a facility not too dissimilar than the unpopular TARP program in the U.S. For the ECB though, they would be making loans to countries like Greece and Italy. The alternative is kicking out profligate countries and this would be economically difficult for Europe.

Source:

The Euro: As Good (and Bad) as Gold
Bloomberg BusinessWeek
By: Peter Coy
November 17, 2011
http://www.businessweek.com/magazine/the-euro-as-good-and-bad-as-gold-11172011.html


Thursday, November 24, 2011

Tom Gallagher Interview: Fiscal Policy Currently Has More Influence Than Monetary Policy

Consuelo Mack interviews Tom Gallagher on this week's WealthTrack. Tom was formally with ISI Group until retiring recently and is now a principal at The Scowcroft Group. While at the ISI Group, Tom was voted the #1 analyst on Washington matters by Institutional Investor from 2001-2010. In the interview, Tom notes government policies have rarely been this important or influential in the economy and markets. He discusses what to expect from the White House, Congress and the Federal Reserve and what it means for your investments in this deleveraging environment. He notes where investors focus in the run up to the technology bubble was on capital gains, in this environment, income return from ones investments is where ones focus should be at this point in time.


Tuesday, November 22, 2011

Fearful Investors

One index measure investors review to gauge the level of fear in the market is the VIX Index. Currently, the VIX is trading at 31.78, down a little over 1 point today. High levels in the VIX translate into a fearful market and can be indicative of a short term market bottoms. In the early part of 2010, the market's first encounter with the Euro crisis, the VIX hit 48. The S&P 500 Index bottomed shortly after this. In other words, the VIX can be viewed as a contrarian indicator.

Another variation of the VIX is to look at the VIX Index divided by the 10-year Treasury Index. Again, high levels in the VIX show investor fear in the equity markets. A low level in the 10-year Treasury indicates bond investors generally have an anemic growth and inflation outlook over the longer term. Consequently, a high ratio number is a contrarian investment measure. The below chart contains a graph (blue line) of this ratio along with a graph of the S&P 500 Index (red line).

From The Blog of HORAN Capital Advisors

h/t: Calafia Beach Pundit


Sunday, November 20, 2011

Job Openings Continue To Rise (JOLTS)

At the end of September, the Bureau of Labor Statistics reported (PDF) there were 3.4 million job openings. This compares to 2.2 million job openings at the end of the most recent recession or a 54% increase.

From The Blog of HORAN Capital Advisors

This improvement in job openings is certainly a positive sign economically; however, companies indicate they are having a difficult time finding qualified employees as noted in this Cincinnati Enquirer article: Wanted: Anyone who can qualify.


Tuesday, November 15, 2011

Dividend Growth Equities Attractive At This Point In The Market Cycle

For dividend investors, one of the keys is to invest in those companies that have a sufficiently high dividend yield that is sustainable and that have high dividend growth rates. Investors focusing only on high yielding stocks run the risk of investing in a company that can not sustain its dividend and then face a dividend cut. Dividend cuts most often have a negative impact on a company's stock price.

As noted by Sudhir Nanda, head of quantitative equity research at T. Rowe Price, "This makes intuitive sense. Companies with growing dividends are signaling confidence about their future earnings. They tend to be stable businesses, well positioned in their markets, and able to perform throughout market cycles, which make them good candidates for long-term growth." The below table details the extra performance gained by those companies that have these dividend characteristics.

From The Blog of HORAN Capital Advisors

Over the long run, dividend growth stocks have outperformed non-growth payers, non-dividend payers and dividend cutters as I have noted in several past posts. Below is a chart separating the stocks by dividend policy for equities in the Russell 1000 Index.

From The Blog of HORAN Capital Advisors

For investors, one factor to keep in mind is dividend paying stocks tend to underperform the overall market in volatile upward market spikes. However, in volatile down market periods, the higher quality dividend growers generally hold up better; and thus tend to outperform over a complete market cycle.

There are many reasons why dividend growth stocks appear attractive in this market environment, not the least of which is they tend to be less volatile. Companies are sitting on record levels of cash and are likely to use some of this cash for increased dividend payments.

The obvious is stocks are not bonds; however, investors looking to increase their allocation to equities should consider dividend paying stocks. On a year over year basis through September 30th, S&P 500 dividend payments are up over 14%. Year to date through November 8th, for companies that have increased their dividend, S&P reports the median increase is 14.55% and the average increase is 27.82%; 27 companies have at least doubled their dividend. This is an attractive growth rate of income investors aren't likely to find in bonds. More on this strategy can be found in my article, Dividends As An Alternative To Low Bond Interest Rates.

Source:

Dividend Growth Stocks May Be Timely As Economy Sputters (PDF)
T. Rowe Price Report
Fall 2011
http://individual.troweprice.com/public/Retail/xStaticFiles/Fall2011PriceReport.pdf


Sunday, November 13, 2011

Third Quarter Earnings Strong, But Q4 Growth Revised Lower

For the third quarter of 2011, 454 companies in the S&P 500 have reported results with 70% reporting earnings above expectations. The estimated earnings growth rate for Q3 is 17.7% according to Thomson Reuters.

From The Blog of HORAN Capital Advisors
 Source: Thomson Reuters

Companies are expressing less optimism about fourth quarter earnings though. Thomson Reuters reports there have been 70 negative EPS announcements for Q4 compared to 22 positive announcements. This equates to a 3.2 negative to positive ratio. This is the highest level of N/P since Q4 2008 when the ratio stood at 3.4. The long term average N/P for the S&P 500 Index is 2.3. Below is a breakdown of the  revised earnings growth rates for Q4 by S&P 500 sector.

From The Blog of HORAN Capital Advisors


Saturday, November 12, 2011

Could The Debt Crisis Come To The U.S.?

italian bond yieldMuch of the volatility impacting global markets of late is the result of the European sovereign debt issues. Italy is the latest country to see its bond rates soar.

According to a recent article in the Wall Street Journal, Italy has €1.9 trillion ($2.6 trillion) in government debt or nearly one-quarter of all euro-zone public debt. Over the course of the next year, Italy must refinance over 15% of its outstanding debt obligations. Given the magnitude of Italy's budget deficit and the recent rise in Italian bond yields, suggests investors are not confident of Italy's ability to deal with these maturities. The size of these debt obligations could be overwhelming for the EU on top of dealing with the debt issues in Greece. This is the type of contagion the EU is trying to prevent.

If history is any guide, past debt defaults by countries have occurred at levels where country debt to revenue levels were much lower. In a November report by Absolute Return Partners they highlighted the debt to revenue ratios of countries today versus these prior country defaults.

From The Blog of HORAN Capital Advisors

One might ask why Japan is not experiencing a crisis. For one, it has a more diverse economy and more importantly, its interest rates remain at very low levels. However, if Greece and Italy are an example, rates can rise very quickly. As noted in Absolute Return Partners' November report, "'A country is bust when the markets decide,'" as stated by Albert Edwards, Societe Generale Cross Asset Research.

So how does the U.S. debt structure compare with countries in Europe that are encountering refinancing risk. If one looks at the country debt level, both on and off balance sheet debt, the U.S. is only behind France in terms of liabilities.

From The Blog of HORAN Capital Advisors

Of potential concern for the U.S. is the level of debt maturing over the course of the next five years.

From The Blog of HORAN Capital Advisors

Compared to many other countries, the percentage of short term debt maturing in less than five years is largest for the U.S.

From The Blog of HORAN Capital Advisors

Of particular concern for the U.S. is the level of its budget deficit in spite of the fact 
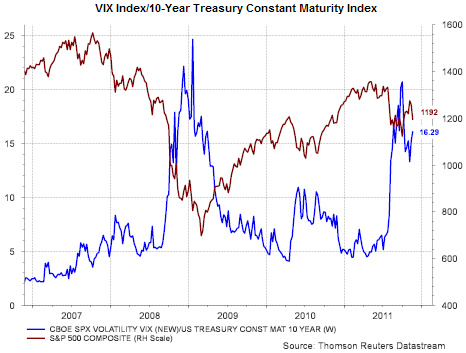
revenues into the treasury continue to grow. The U.S. currently borrows nearly 39 cents for every dollar it spends. Additionally, interest expense is $241 billion or 6% of the government's budget. Given the low level of interest rates on the Treasury's debt, the 10-year Bond is just over 2%, it would not take much of an interest rate spike in the U.S. to negatively impact the government's budget.

Absolute Return Partners highlighted comments from the Fed's summer Jackson Hole Wyoming meeting where the Bank for International Settlements concluded,
"...the debt problems facing advanced economies are even worse than we thought. Given the benefits that governments have promised to their populations, ageing will sharply raise public debt to much higher levels in the next few decades. At the same time, ageing may reduce future growth and may also raise interest rates, further undermining debt sustainability. So, as public debt rises and populations age, growth will fall. As growth falls, debt rises even more, reinforcing the downward impact on an already low growth rate. The only possible conclusion is that advanced countries with high debt must act quickly and decisively to address their looming fiscal problems. The longer they wait, the bigger the negative impact will be on growth, and the harder it will be to adjust."
For the U.S. then, they must address their deficit issues sooner versus later. One significant component will be to create an environment that has a positive influence on economic growth. Additionally, the growth rate in entitlement expenditures must be curtailed. The solutions offered by the ill conceived deficit committee in Washington will certainly be important.


Sunday, November 06, 2011

High Unemployment Is Becoming A Long Term Structural Issue

It appears the high level of unemployment and the underemployment level (U-6) are becoming a long term structural issue. The U-6 has trended somewhat lower; however, seems stubbornly stuck above 16%. Additionally, the unemployment rate seems stuck above 9%.

From The Blog of HORAN Capital Advisors

The mismatch between skills and job openings seems to be more structural as time goes on. As noted by the BLS, the relationship between the unemployment rate and the vacancy rate is known as the Beveridge Curve, named after the British economist William Henry Beveridge (1879-1963). The economy’s position on the downward sloping Beveridge Curve reflects the state of the business cycle. The BLS goes on to note that during an expansion, the unemployment rate is low and the vacancy rate is high. During a contraction, the unemployment rate is high and the vacancy rate is low. The position of the curve is determined by the efficiency of the labor market. For example, a greater mismatch between available jobs and the unemployed in terms of skills or location would cause the curve to shift outward, up and toward the right (emphasis added).

From The Blog of HORAN Capital Advisors

The potential upward shift that may be occurring can be seen in the below chart from July.

From The Blog of HORAN Capital Advisors
Source: Fidelity

This structural change in employment is likely a trend that won't be reversed in a short period of time. Many of the unemployed have been displaced from construction related fields where the unemployment rate is over 20%. Little improvement is seen in construction, both commercial and residential, near term.