Thursday, November 30, 2006

Eaton Vance's 8th Annual Investor Survey Recap

Today, Eaton Vance reported findings from its eighth annual investors' survey. The study revealed interesting results about investor views on dividends. Also, an interesting data point was GenXers views on real estate as an investment (sounds the same as Boomers perception of technology in late 1999).

Following are highlights of the survey results:
  • The great majority of American investors (73%) agree with the statement: "Firms that pay dividends tend to be predictable cash generators, and healthy dividends are a sign of financial strength."

  • Three times as many investors (45%) say they increased investment in dividend-payers over the past three years as say they decreased investment in these stocks (16%).

  • Investors show a strong preference for companies using dividends to return cash to shareholders, with two-thirds (69%) indicating they prefer a company to pay a dividend rather than only buying back stock.

  • More investors (44%) say they prefer a smaller dividend grown annually over a large but unchanged dividend (25%) or share buybacks (19%).

  • Senior investors are more likely to indicate a preference for dividends over buybacks (74%) than Baby Boomers (62%).

  • GenXers also indicated a strong (70%) preference for dividends.

  • The popularity of dividends is reflected in the fact that over half of investors (58%) say they currently invest in dividend-paying stocks.

  • Few investors (3%) knew that nearly two-thirds, or 64%, of the overall return from stocks as measured by the S&P 500 Index has historically come from reinvested dividends (Source: Ned Davis Research).

  • Half of investors (51%) who increased investments in dividend-paying stocks over the past three years say the reduction of the tax rate on dividend income to 15% in 2003 was a factor in their decision to do so.

  • Notably, 52% of GenXers--the most of any generation--say they would start investing or increase their investments in dividend-paying stocks if Congress makes the tax cut permanent.

Regarding asset preferences:

  • Senior investors (34%) and Baby Boomers (31%) choose stocks as the investment they think of first for income generation, while GenXers (34%) say real estate.

  • In fact, as the results of Eaton Vance's study show, investors' perception of real estate as a reliable return generator persists, despite the fact that the housing market has slowed dramatically, with September housing starts down 18% year-over-year (Source: U.S. Census Bureau News). Nearly as many investors predicted real estate would offer the best after-tax returns among major investment categories over the next five years as picked stocks (30% versus 35%).

Details about the survey:

"This summary highlights the major findings of a comprehensive telephone study among 1,209 U.S. residents 25 years and older (about 400 per age cohort: GenXers 40 and younger, Boomers 45 to 60 and seniors 65 years or older), who have over $50,000 invested in both qualified retirement plans and investments outside of qualified retirement plans (stock mutual funds, bond mutual funds, individual stocks, individual bonds, variable annuities and money market funds). This study, which represents a portrait of American investors' attitudes and practices about investing across three generations, was conducted by Penn, Schoen & Berland Associates, Inc. for Eaton Vance Corp.

This representative national study of 1,209 American investors was conducted between October 2 and November 11, 2006. By definition, all investors surveyed have a portfolio of at least $50,000, excluding housing. 71% have investable assets greater than $100,000, while one in seven have a portfolio of $1 million plus"


Source:
MSN Money
September 30, 2006
http://news.moneycentral.msn.com/ticker/article.aspx?Symbol=US:EV&Feed=BW&Date=20061130&ID=6237398

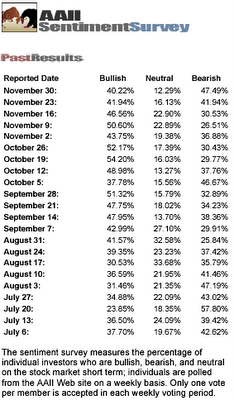
Bearish Sentiment Continues to Move Higher

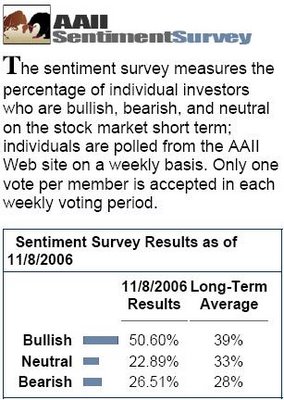
Bearish sentiment as reported by AAII rises again as reported for November 30, 2006. Bullish sentiment stills seems a little high; however, is this contrarian indicator indicating another leg up for the market?

(click on chart for larger image)


Wednesday, November 29, 2006

The Importance of Understanding the Difference between Earnings, Operating Cash Flow and EBITDA

An attractive aspect to using a dividend growth methodology in evaluating stocks is the dividend growth method enables an investor to gauge, indirectly, the cash flow of a company. Because cash is important to a company's survival, changes in a company's dividend practices may signal future cash flow issues for a company.

Dividend growth stocks should not be looked at as simply investments that grow their dividend on an annual basis; but, the methodology leads to investment in companies that are growing their business as evidenced by growth in company cash flow. The other important aspect to successfully investing in dividend growth companies is to focus on the higher quality firms as rated by Standard and Poor's. S&P's Quality Ranking measure attempts to capture the "quality" of earnings issue.

What is cash flow versus earnings? Earnings of a company are essentially a figure derived from accounting rules. The problem with "earnings" or "net income" from an accounting perspective, is the figure has very little to do with evaluating the cash flow stability of a company.

Cash flow comes in two forms: "operating" cash flow and simply cash flow. The latter is commonly referred to as EBITDA (earnings before interest, taxes, depreciation and amortization). The problem with the EBITDA calculation is the number is based largely on earnings. The website stockdiagnostics provides the following interesting definition of EBITDA:
"(EBITDA) is calculated by adding "selected" expense items such as Interest expenses, Income taxes, Depreciation and Amortization back into earnings or net income. By adding "selected" expense items back into to a company's net income "more positive" earnings or cash flow per share numbers can be manufactured. When utilizing EBITDA an analyst or CFO is actually stating, "This is what our earnings would have been if it were not for interest, taxes, depreciation and amortization." Because it is based upon earnings, EBITDA is subject to the same "creative" accounting inherent in many earnings reports. EBITDA frequently does not reflect a company's true cash flow.... EBITDA is a manufactured "creative accounting" interpretation that presents a company in the best possible light. EBITDA's original use was for lenders to determine credit viability. Today these interpretations are used primarily by companies and Wall Street analysts to promote stock to an unwary public. Commonly, when EBITDA or CFPS (cash flow per share) are used in this way they are deceptively called "cash flow" or some form thereof."
Operating cash flow is a measure that incorporates changes from the balance sheet and income statement that have an impact on cash. The operating cash flow information is contained in SEC filings of companies. In the SEC financial filings for companies, firms include an income statement, balance sheet and statement of cash flow. One of the most important financial documents in the filing is the statement of cash flow. This statement reconciles the cash balance on the balance sheet by incorporating changes in categories from the income statement and balance sheet accounts. For example, all else being equal, if inventory increases, this reduces cash flow since cash was used to purchases the inventory. Of course, the inventory could be purchased on credit; then accounts payable would increase and this increases cash flow. The statement of cash flow contains three sections:
  • Cash provided by operating activities,
  • Cash provided by investing activities, and
  • Cash provided by financing activities.
The key section to review on the cash flow statement is the one detailing operating cash flow.

Once the operating cash flow figure is analyzed, it should be converted to a per share number. This figure can be evaluated across quarters to determine any negative or positive trends. Additionally, growth, or lack of growth in operating cash flow per share can be compared to companies within the same industry or across industries. The last step in this analysis is to take the price of the stock divided by the operating cash flow per share to come up with a price to operating cash flow figure. This number can be used to evaluate stocks in the same way one uses the P/E ratio.

Following is an example detailing the difference in a company's net income and operating cash flow:

(click on tables for larger image)


Jos. A. Bank (JOSB) Cash Flow Statement
($ in millions)


As one can see from the above charts, net income has grown nicely, but cash flow has actually declined from year end '05 to '06. Note the large cash usage ($48.9 million) in 2006 attributable to an increase in inventory.


Tuesday, November 28, 2006

McCormick & Company Increases Dividend 11%

Today, McCormick & Co. (MKC) announced a 11% year over year increase in the company's quarterly cash dividend to 20 cents per share versus 18 cents per share in the same quarter last year. MKC maintains an S&P Quality Ranking of A+. In the press release, the company's CEO stated:

"In 2006 we have rebounded from a challenging 2005 fiscal year. Our financial results through the first three quarters have exceeded our expectations and the stock price has risen 20% in the past 12 months."


Dividend Growth versus Stock Buybacks

In today's Ahead of the Tape section of The Wall Street Journal, the column discusses some pros and cons of stock buybacks. The article cautions investors that a company's stock buyback announcement should not be taken at face value.
"Buybacks aren't always what they seem. A company might throw confetti for its share repurchase plan with one hand while issuing shares with the other."
The article further cautions investor not to mistake earnings per share growth from buybacks with actual EPS growth.
"At the same time, investors need to be careful to avoid mistaking earnings-per-share growth from buybacks for actual earnings growth."
One way an investor can obtain insight into the true earnings picture of a company is to review the company's cash flow statement. Additionally, an investor can monitor the dividend growth rate of a company to better gauge what the company's board might be projecting about future business prospects. If the dividend is not growing at a rate equal to or greater than the historical dividend growth rate for the company, maybe the earnings growth of that particular company is being enhanced by other factors such as stock buybacks.


Source:
Self-Serve in the Boardroom
JUSTIN LAHART
AHEAD OF THE TAPE
The Wall Street Journal Online, November 28, 2006 http://online.wsj.com/article/SB116466998414033857.html?mod=mkts_main_featured_stories_hs


Monday, November 27, 2006

Dividend Aristocrats Performance in a Down Market

One of the advantages to investing in higher quality dividend paying stocks is the fact they historically have held their value better in a down market. Standard and Poor's Dividend Aristocrats' performance held up better in today's down market. These higher quality dividend paying stocks also performed substantially better than the Nasdaq index:

(click on chart for larger image)


Determining the Valuation of Dividend Paying Stocks

An important aspect to investing in stocks is attempting to determine the stocks appropriate valuation. Following is information covering the analysis and valuation of dividend paying stocks.

The most common method used in valuing dividend paying stocks is to use the Dividend Discount Model (DDM), commonly referred to as the Gordon Model. The basic tenant of the model is a company's stock is equal to all of that company's expected future cash flow (dividends in this case) discounted back to the present (time value of money concept) using an appropriate discount factor. More information on the DDM approach can be found here.

The following website contains a Dividend Discount Model calculator to assist one in determining an expected fair value of a particular stock: www.dividenddiscountmodel.com.(the dividend discount model site is not active at this time-April 16, 2008)) The site answers the question of why use the DDM:

"The dividend discount model (DDM) is a widely accepted stock valuation tool found in most introductory finance and investment textbooks. The model calculates the present value of the future dividends that a company is expected to pay to its shareholders. It is particularly useful because it allows investors to determine an absolute or "intrinsic" value of a particular company that is not influenced by current stock market conditions. In contrast, most target prices published by analysts are set on a relative basis, based on the valuation of comparable companies. The DDM is also useful because the measurement of future dividends (as opposed to earnings for example) facilitates an "apples-to-apples" comparison of companies across different industries by focusing on the actual cash investors can expect to receive. Although it is conceptually simple, the DDM is not widely used except by some institutional investors because it can be cumbersome to apply without the necessary data and analytical tools. DividendDiscountModel.com makes the DDM accessible to all investors to determine whether they think a particular stock is over or under valued based on its dividend potential.

The Dividend Discount Model is also known as the "Gordon model" named after professor Myron J. Gordon who popularized the model. Professor Gordon wrote about the model in a book he authored in 1962 titled The Investment, Financing and Valuation of the Corporation. Since then the model has appeared in virtually every investments textbook. In his book titled Investment Valuation, Aswath Damodaran, a professor at New York University states: "In the long term, undervalued (overvalued) stocks from the dividend discount model outperform (underperform) the market index on a risk-adjusted basis." Although no investment model works for all stocks all of the time, the dividend discount model has proven to be a reliable way of selecting stocks that on average will perform relatively well on a long-term basis. It should be among the tools that investors use to select at least some of the stocks in their portfolio."
A more flexible and detailed DDM program can be found by clicking here. The Excel file to review is named divginzu.xls in the section of the table titled "All-in-one Valuation Models". A review of the inputs in the Excel file noted previously will provide a more comprehensive understanding of the DDM concept for the investor wanting to analyze their own stock investments.

This brief post does not do justice to the complexity of valuing stocks using the DDM approach. For instance, all stocks do not pay a dividend and the dividend grow rate is not level for companies. There are variations of the DDM to account for these differences and I will cover these topics in future posts. In the interim, if a reader has specific questions on the DDM or topics to focus on in the future, leave me a comment or email.


Sunday, November 26, 2006

Dividend Growth Stocks In A Slowing Economy

A recent BusinessWeek online article titled, Making Dividend Plays Pay, and an excerpt from a Standard Poor's Equity Research report, contained an analysis of the yields, payout ratios, and quality make up by sector for several S&P indices.

(click on chart for larger image)


The article outlines the importance of reinvested dividends:
"Dividends—those steady streams of periodic payments received by equity investors—may seem as unexciting as a Social Security check, but you might think again when you realize that reinvested dividends have actually contributed more than 40% of the S&P 500's total return since 1929 (emphasis added). What's more, the S&P 500 dividend yield averaged nearly 4% in all years since the mid-1930s and averaged nearly 6% during the 1940s. Things look a little different these days, of course. The yield on the "500" has averaged only 1.6% thus far this decade, after averaging only 2.4% during the 1990s..."

S&P believes the economy is entering a slower growth phase. As a result, they believe investors should focus on higher quality dividend paying stocks:

"Due to the expected tepid market performance, S&P recommends that investors gravitate toward sectors and companies that offer relatively high dividend yields and have consistently increased their earnings and dividends over an extended period of time."


Source:
Making Dividend Plays Pay
SAM STOVALL
SAM STOVALL'S SECTOR WATCH
BusinessWeek Online, September 5, 2006 http://www.businessweek.com/investor/content/sep2006/pi20060905_559905.htm


Dividend Paying Stocks-Cash is King

When analyzing dividend growth stocks, reviewing a company's cash flow is an important aspect in the analysis. Companies that generate strong growth in cash flow have the ability to: increase the dividend, buyback stock or pay down debt with the cash, just to name a few uses. An investor should be wary of stocks that trade at too high of a yield though. Stocks paying too high a yield can be a precursor to underlying fundamental problems with a company.

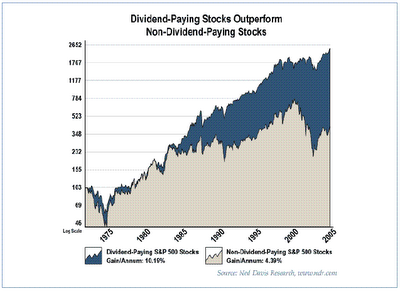
Historically, companies that pay a dividend have outperformed non-dividend payers:

(click on graphs for larger image)


Reinvesting of the dividends is another important component to the growth of dividend paying stocks. In lieu of reinvesting the dividend back into the same stock, an investor can choose to receive the cash dividend and reinvest the proceeds into other attractively valued dividend growth companies within ones portfolio:

The Power of Reinvesting Dividends
    • $10,000 invested in Ibbotson's large cap companies in 1980


Source:
6 Secrets to Finding Dividend "Money Machines"
Motley Fool Income Investor, October 16, 2006 http://aol.fool.com/shop/newsletters/08/index.htm?authed=n


Friday, November 24, 2006

Indices One Can Use To Benchmark Performance of Dividend Paying Stock Portfolios

Following are indices one can use to compare the performance of a dividend growth portfolio versus a dividend index. These indices are maintained by Mergent Inc and the Dividend Achievers Indices are as follows:

  • Mergent Broad Dividend Achievers Index (DAA): The Index is designed to track the performance of dividend paying companies that meet the "Dividend Achievers" requirements. To become eligible for inclusion in the Index, a company must be incorporated in the United States or its territories, trade on the NYSE, NASDAQ or AMEX, and have increased its annual regular dividend payments for the last 10 or more consecutive years. In addition, Mergent requires that a stock's average daily cash volume exceed $500,000 per day for the two month period prior to reconstitution. The Index is calculated using a modified market capitalization weighting methodology and is published by the AMEX under ticker symbol “DAA”.
  • Mergent Dividend Achievers Select Index (DVG): The Index is designed to track the performance of dividend paying companies that meet the "Dividend Achievers Select Index" requirements incorporated in the United States or its territories, trade on the NYSE, NASDAQ or AMEX, and have increased its annual regular dividend payments for the last 10 or more consecutive years. In addition, Mergent requires that a stock's average daily cash volume exceed $500,000 per day for the two month period prior to reconstition. The Dividend Achievers Select Index is calculated using a modified market capitalization weighting methodology. The Index is calculated by the American Stock Exchange under the symbol DVG.
  • KLD Dividend Acheivers Social Index (ESG): Jointly developed using KLD's accepted environmental, social, and goverance (ESG) indexing process and coupled with Mergent, Inc.'s Dividend Achievers™ requirements, the KLD Dividend Achievers Social Index (DASI) is the first Social Index benchmark for equity portfolios subject to ESG screens and dividend criteria. The KLD Dividend Achievers Social Index (DASI) is an equal weighted common stock index comprised of environmental, social and goverance (ESG) screened performers with 10 or more consecutive years of regular dividend growth.
  • Mergent Dividend Achievers50 Index (DAY): The Index, a subset of the Broad Dividend Achievers Index, is designed to track the performance of the top 50 highest yielding dividend paying companies that meet requirements to be classified as "Dividend Achievers". To become eligible for inclusion in the Dividend Achievers Index a stock must be incorporated in the United States, trade on the NYSE, NASDAQ or AMEX, and have increased its annual regular dividend payments for the last 10 or more consecutive years. In addition, Mergent requires that a stock's average daily cash volume exceed $500,000 per day for the two month period prior to reconstitution. The Index is calculated using a yield weighting methodology and is published by the AMEX under ticker symbol DAY.
  • Mergent High Growth Rate Dividend Achievers Index (DAH): The High Growth Rate Dividend Achievers Index, a subset of the Broad Dividend Achievers Index, is designed to track the performance of top 100 Dividend Achievers™ companies by their respective 10 year compound annualized dividend growth rate. To become eligible for inclusion in the High Growth Rate Dividend Achievers Index , a company must be incorporated in the United States or its territories, trade on the New York Stock Exchange, the NASDAQ system or the American Stock Exchange, and have increased its annual regular dividend payments for the last 10 or more consecutive years. In addition, Mergent requires that a stock''s average daily cash volume exceed $500,000 per day in the two month period prior to reconstition. The High Growth Rate Dividend Achievers Index is calculated using a modified market capitalization weighting methodology. The Index is calculated by the American Stock Exchange under the symbol DAH.
  • Mergent NASDAQ Dividend Achievers Index (DVGT): The NASDAQ Dividend Achievers Index, a subset of the Broad Dividend Achievers Index, is designed to track the performance of Dividend Achievers companies that trade on NASDAQ. To become eligible for inclusion in the NASDAQ Dividend Achievers Index, a stock must be incorporated in the United States, trade on NASDAQ and have increased its annual regular dividend payments for the last 10 or more consecutive years. In addition, Mergent requires that a stock''s average daily cash volume exceed $500,000 per day in the two month period prior to reconstitution. The Index is calculated using a market capitalization weighting methodology. The Index is published by NASDAQ with the ticker DIVQ for the price appreciation and DVQT for the total return.

In addition to the U.S. domestic dividend achievers, Mergent maintains three additional indices covering international and Canadian dividend achievers. They consist of:
Source: Mergent's Dividend Achievers


Thursday, November 23, 2006

Bullish Sentiment Falls and Bearish Sentiment Rises

Bearish sentiment is near levels seen at market lows this summer.

(Click on charts for larger images)


Source: AAII


Wednesday, November 22, 2006

Real Estate Investment Trusts (REITs)

Real Estate Investment Trusts or REITs can serve as a diversifying vehicle for investment portfolios. REITs generally invest in various types of real estate properties, for example, apartment buildings, healthcare facilities and industrial properties. REITs are required to payout, in the form of dividends, at least 90% of the companies taxable income in order for the REIT to receive special tax treatment from the IRS.

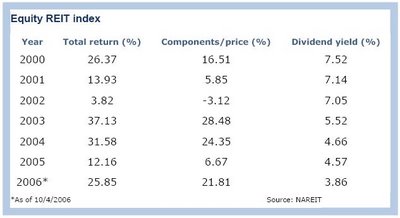
A word of caution at this time is many REIT shares have experienced significant price appreciation over the last few years. A common index that tracks the performance of REITs, the NAREIT Index, has seen its yield decline from over 7% in 2000 to just over 3% currently. This lower yield is due, in large part, to the appreciation of REIT share prices.

(click on chart for larger image)

(source: www.bankrate.com)

In most cases, REITS are best held in tax-deferred accounts as the taxable portion of the dividend does not qualify for special tax treatment and is taxed at the investors ordinary income tax rate.

Source:
REITs can boost yield returns, but buy cautiously
By: Laura Bruce
www.bankrate.com
November 10, 2006


Tuesday, November 21, 2006

Becton Dickinson Increases Dividend

Becton Dickinson (BDX) announced a 14% year over year increase in the company's quarterly cash dividend to 24.5 cents per share versus 21.5 cents per share in the same quarter last year. BDX maintains an S&P Quality Ranking of A+.


Does The Inverted Yield Curve Predict A Recession?

Many economist have focused on the yield curve and its shape to provide clues about future economic growth. One reason economists focus on the yield curve is an inverted yield curve has preceded prior recessions; however, every inverted yield curve has not resulted in a recession. The current shape of the yield curve is an inverted one:

(click on graph for larger image)


A recent Federal Reserve publication noted:
"...Despite the evidence linking the yield curve to economic growth, and even though yield-curve inversions preceded the two most recent recessions, many have suggested that the yield curve no longer reliably predicts economic growth. Noting that the economy is continually evolving, particularly the financial sector, they discount past successes. They point to two recent “near misses” in 1995 and 1998, when a flat yield curve did not presage slow growth. And indeed, evidence since the early 1990s suggests that the relationship between the yield curve and growth has shifted, if not disappeared."
The study concluded:
"Economists do not currently have a well-accepted theory of why the yield curve predicts future economic growth. Given that, speculating on whether or not the yield curve is truly predicting a recession remains exactly that: speculation. Using the yield curve remains an exercise in judgment that requires balancing the long, successful history of the yield curve’s predictive power with some recent evidence of its fading foresight. It also requires judgment because predictions of real activity represent only one facet of the problem facing the FOMC: Inflation is the other. Still, as the Committee becomes more familiar with the risk-management approach to policymaking, it seems that the signal from the yield curve deserves some weight."
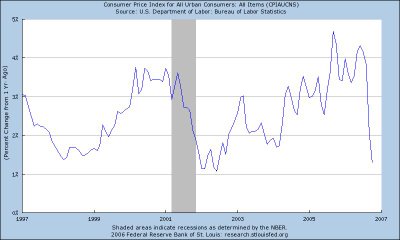
The other variable garnering a large part of the Fed's attention at this time is the level of inflation. As noted by the chart below, data indicate inflation is subsiding.

(click on graph for larger image)

The one caveat from the Federal Reserve article is the author's belief that events may be different this time. Keep in mind, history has a tendency to repeat itself.

At this stage in the economic cycle, an investor should consider focusing their large cap investments on the larger higher quality dividend paying companies. These firms should weather an economic slow down better than smaller, higher valuation companies.


Saturday, November 18, 2006

Asset Allocation: All Bond Portfolio More Risky Than Balanced Portfolio?

The American Association of Individual Investors published an article on the free content portion of their site describing five lessons investors should be aware of when making their asset allocation decision. The entire article can be read clicking here.

The five lessons mentioned in the article are:

  1. Lesson One: Mixing bonds and stocks moderates portfolio risk.
  2. Lesson Two: Portfolio risk rises disproportionately slowly as stocks are added to the portfolio.
  3. Lesson Three: An all-bonds portfolio is not the lowest-risk portfolio.
  4. Lesson Five: An often-overlooked risk for the long-run investor is the risk of having a too-conservative portfolio.
The article also contains the following table detailing risk and return statistics for various portfolio asset allocations


Dividend Increases

  • Nike Inc. (NKE) announced a 19.3% year over year increase in the company's quarterly cash dividend to 37 cents per share from 31 cents per share in the same quarter last year. NKE maintains an S&P Quality Ranking of A+.
  • RLI Corp. (RLI) announced a 17.6% YOY increase in its quarterly cash dividend to 20 cents per share versus 17 cents per share in the same quarter last year. RLI maintains an S&P Quality Ranking of A.


Thursday, November 16, 2006

Notable Dividend Increases

  • Transportation services company C.H. Robinson Worldwide Inc. (CHRW) announced a 125% year over year increase in the company's quarterly cash dividend to 18 cents per share from 8 cents a share. CHRW maintains an S&P Quality Ranking of A.
  • Home Depot (HD) announced a 125% YOY increase in its quarterly cash dividend. The new quarterly dividend amount is 22.5 cents per share. This is HD's second dividend increase this year. HD maintains an S&P Quality Ranking of A+.
  • Intel (INTC) announced a 25% YOY increase in its quarterly cash dividend payable in the first quarter of 2007. The new quarterly dividend amount is 12.5 cents per share. INTC maintains an S&P Quality Ranking of A.


Dividend Increases vs.Stock Buybacks

Last month Standard and Poor's reported dividend increases had slowed while stock buybacks were continuing at a strong pace. Certainly, this is a trend worth watching. Like dividends, stock buybacks do benefit investors. The issue with stock buybacks is this type of action is not a long term commitment by a company; therefore, buybacks should have less weight, by an investor, in determing a dividend growth stock's future price performance, i.e, the company's long term growth prospects.


Wednesday, November 15, 2006

What One Can Uncover Reading SEC Filings

An interesting post on what investment opportunities one uncovers by reading SEC filings - (click here)


Sentiment Survey

This survey is from the American Association of Individual Investors. The survey is a contrarian indicator. If bullishness is too high, the market may be nearing a top. See November 11th comment (click here)


Companies Yet to Announce Dividend Action

The following Dividend Aristocrats have dividend actions yet to be announced in the upcoming three months. The announcement coincides with quarters in which the company would increase their dividend.

  • Becton Dickinson (BDX) - announcement likley in November
  • General Electric (GE) - announcement likely in January
  • Lilly (LLY) - announcement likely in January
  • Pfizer (PFE) - announcement likely in January
  • U.S. Bancorp - announcement likely in early December


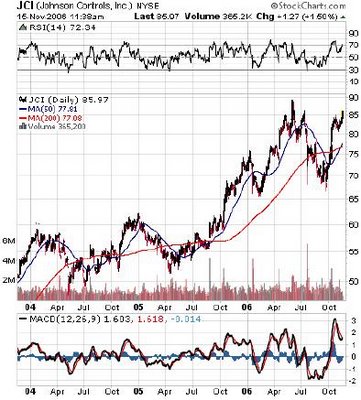
Johnson Controls Increases Dividend 18%

Today, Johnson Controls (JCI) announced an increase in its quarterly dividend to .33 cents per quarter from .28 cents per quarter in the same period last year. This represents a 18% increase in the dividend.

JCI is one of Standard and Poor's Dividend Aristocrats and JCI maintains an S&P Quality Ranking of A+.

  • In the fourth quarter of the company's year ending September 2006, JCI reported earnings that were 24% higher versus the same quarter in the prior year.
  • The fourth quarter earnings totaled $1.86 per share. The fourth quarter earnings were 1 cent higher than analyst estimates.
  • The company's fourth quarter revenues increased 18%.
  • Estimated earnings for JCI's upcoming year total $6.03, a 15% increase over this year's earnings of $5.23.
  • If one annualizes the new 33 cent quarterly dividend, the total estimated dividend for the next 12-months equals $1.32.
  • The projected payout ratio totals 22%. This payout ratio is in line with historical averages.
(click on graph for larger image)


Recognizing a Trend and Signals for When It Might Change

An interesting article on identifying when a trend may end (in this case a stock market uptrend) was posted on the optionetics.com website. Near the end of the article, four points are noted that might assist one in recognizing when a change in market direction may occur. Click here for the article.


Tuesday, November 14, 2006

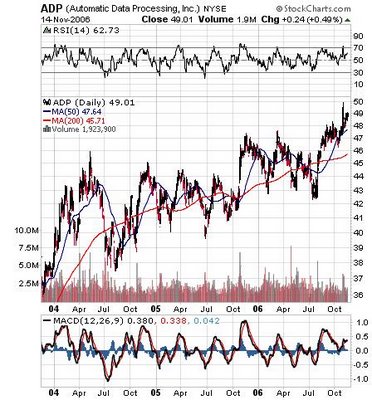
Automatic Data Processing Increases Dividend 24%

Today, Automatic Data Processing (ADP) announced an increase in its quarterly dividend to 23 cents per quarter from 18.5 cents per quarter in the same period last year. This represents a 24% increase in the dividend. What are the implications of the magnitude of this dividend rate increase?

ADP is one of Standard and Poor's Dividend Aristocrats and ADP maintains an S&P Quality Ranking of A+.
  • In the first quarter of the company's year ending June 2007, ADP reported earnings that were 21% higher versus the same quarter in the prior year.
  • The first quarter earnings totaled 46 cents per share. The first quarter earnings were 3 cents higher than analyst estimates.
  • The company's first quarter revenues increased 8%.
  • Estimated earnings for ADP's upcoming year total $2.22.
  • If one annualizes the new 23 cent quarterly dividend, the total estimated dividend for the next 12-months equals 92 cents.
  • The projected payout ratio totals 41%. The payout ratio has trended higher from 25% in 2001 to the estimated 41% in the next 12-months.
The question becomes, is the company expecting revenue and earnings to grow at a higher rate going forward. The company's revenues are estimated to grow 8% into the future while earnings are expected to grow 17% this year and 14% in the fiscal year ending 2008.

An investor should maintain an eye on the company's earnings and revenue growth over the upcoming quarters. It is likely not feasible to maintain a YOY 24% increase in the annual dividend if revenues and earnings are growing at a slower rate than the dividend growth rate. The wild card in projecting the company's growth going forward is the company's recent announcement that it will spin-off its Brokerage and Services Group into a separate publicly traded company to its existing shareholders. ADP will receive $500-$700 million in dividend back to the company.

In conclusion, the company's stock price has increased nicely over the last three years. Maybe this rate of dividend increase is a signal of stronger growth going forward.

(click on graph for larger image)


Stocks and Ex-Dividend Dates

The following information was taken from the SEC's website and explains when an investor is entitled to receive a company dividend. In short, an an investor must own a stock prior to the ex-dividend date. If an investor buys or sells the stock on or after the ex-date, he or she will not receive the next paid dividend.

"Have you ever bought a stock only to find out later that you were not entitled to the next cash or stock dividend paid by the company? To determine whether you should get cash and most stock dividends, you need to look at two important dates. They are the "record date" or "date of record" and the "ex-dividend date" or "ex-date."

When a company declares a dividend, it sets a record date when you must be on the company's books as a shareholder to receive the dividend. Companies also use this date to determine who is sent proxy statements, financial reports, and other information.

Once the company sets the record date, the stock exchanges or the National Association of Securities Dealers, Inc. fix the ex-dividend date. The ex-dividend date is normally set for stocks two business days before the record date. If you purchase a stock on its ex-dividend date or after, you will not receive the next dividend payment. Instead, the seller gets the dividend. If you purchase before the ex-dividend date, you get the dividend.

Here is an example:

Declaration Date Ex-Dividend DateRecord Date Payable Date
7/27/2004 8/6/20048/10/2004 9/10/2004

On July 27, 2004, Company XYZ declares a dividend payable on September 10, 2004 to its shareholders. XYZ also announces that shareholders of record on the company's books on or before August 10, 2004 are entitled to the dividend. The stock would then go ex-dividend two business days before the record date.

In this example, the record date falls on a Tuesday. Excluding weekends and holidays, the ex-dividend is set two business days before the record date or the opening of the market – in this case on the preceding Friday. This means anyone who bought the stock on Friday or after would not get the dividend. At the same time, those who purchase before the ex-dividend date receive the dividend.

With a significant dividend, the price of a stock may move up by the dollar amount of the dividend as the ex-dividend date approaches and then fall by that amount after the ex-dividend date. A stock that has gone ex-dividend is marked with an "x" in newspapers on that day.

Sometimes a company pays a dividend in the form of stock rather than cash. The stock dividend may be additional shares in the company or in a subsidiary being spun off. The procedures for stock dividends may be different from cash dividends. The ex-dividend date is set the first business day after the stock dividend is paid (and is also after the record date).

If you sell your stock before the ex-dividend date, you also are selling away your right to the stock dividend. Your sale includes an obligation to deliver any shares acquired as a result of the dividend to the buyer of your shares, since the seller will receive an I.O.U. or "due bill" from his or her broker for the additional shares. Thus, it is important to remember that the day you can sell your shares without being obligated to deliver the additional shares is not the first business day after the record date, but usually is the first business day after the stock dividend is paid.

If you have questions about specific dividends, you should consult with your financial advisor. You can also get information by going to your library and reading Standard and Poor's Dividend Record Binder."


Monday, November 13, 2006

S&P's Dividend Aristocrats: Part II

In a comment to my Part I post on S&P’s Dividend Aristocrats (November 12, 2006) , the author of the comment notes:

“What's particularly interesting is the number of stocks that have dropped off the list over the years. Excluding mergers, the dominant reason seems to be a large acquisition that is heavily debt funded.” by yielder at www.dividendgrowth.org

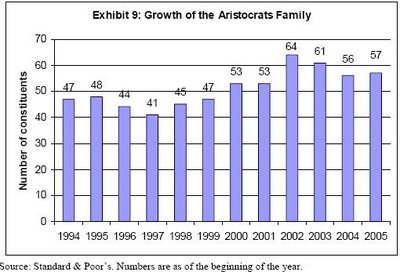
The author of the comment is largely correct. Importantly, the cause for most of the companies dropping off the Aristocrat list was due to merger or acquisition and not a result of going out of business for financial reasons such as a bankruptcy. The number of Aristocrats has actually been on the rise.

(click on graphs for larger image)

Standard and Poor’s produced a paper (link) in May 2005 covering the history of the Aristocrats. The paper noted interesting conclusions about dividend paying stocks.

  • “In 2004 dividend income comprised 4.6% of per capita personal income in the U.S., compared to 2.7% 20 years prior. In terms of year 2000 dollars, total personal dividend income increased from $134 billion to $407 billion. During the same period, the other source of income from capital markets, interest, saw its share in personal income shrink from 15.7% to 9.8%. Exhibits 1 and 2 chart the growing importance of dividend income vis-à-vis interest income. As equity ownership becomes even more ubiquitous, and a growing number of retiring Americans seek income-generating assets, the importance of personal dividend income shall increase.”

  • Although the percent of monthly returns coming from dividends has declined, on average, dividends have accounted for one-third of monthly returns since 1940.

  • The compounding effect of reinvested dividends is significant.
  • Based on the chart labeled Exhibit 7, might payout ratios be on the increase. Given the strength in corporate earnings over the last three plus years, a large part of the rise in the payout ratio is due to the increase in dividends by S&P 500 companies.
Source: Standard and Poor's


Sunday, November 12, 2006

S&P's Dividend Aristocrats: Part I

Standard and Poor's maintains a list of stocks that have exhibited long term dividend growth qualities. The "Dividend Aristocrats" consist "of large cap, blue chip companies within the S&P 500 that have followed a policy of consistently increasing dividends every year for at least 25 consecutive years. The index portfolio has both capital growth and dividend income characteristics, as opposed to portfolios that are pure yield or pure capital appreciation oriented."

Although some of these companies have consistent long term positive dividend characteristics, a few companies may be in industries that are facing unique challenges at this time. For example, the newspaper industry, and companies like Gannett (ticker GCI), is being challenged by the consumer's move to the internet for a great deal of their news. Below is a list of the current dividend aristocrats.

(click tables for larger image)


Saturday, November 11, 2006

Market Technicals

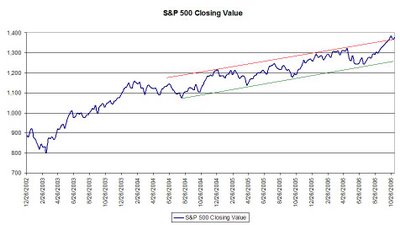
In the long run, a market or a stock's, underlying fundamentals will determine whether an investor makes or loses money on a particular investment. In the short run though, technical factors are important issues to consider when investing. Recently, an interesting set of charts was displayed on The Big Picture web blog. The market chart displayed on the site (click here) focused on the Dow. Below I have displayed similar information for the S&P 500 Index. The Dow recently reached a new all time high, while the S&P 500 Index is still below its 2000 high of 1,527. The S&P continues to trade in a longer term up trend channel; however, the index is trading at the top of the channel's range (red line).

(click graphs for larger image)

From a sentiment standpoint, the better time to invest in the market is when the bullish sentiment percentage is lower. The sentiment figures are provided by The American Association of Individual Investors.

I do not advocate market timing; however, reviewing market technicals will provide insight to overall market trends. Some might say investing in the stock market is like investing in real estate. One makes money in real estate not based on what they sell a property for, but based on the price paid for the property. In other words, buy low and sell high.


Thursday, November 09, 2006

Asset Allocation: Pros and Cons

Financial professionals (FPs) often advise investors the most important aspect to achieving satisfactory investment returns is to determine ones appropriate asset allocation. Financial professionals will tell investors that 92% of ones return is determined by their asset allocation decision.

The 92% figure comes from a study by Brinson, Hood, and Beebower (BHB). BHB studied ninety-one pension plans over the period 1974-1983. The study concluded “investment policy dominates investment strategy (market timing and security selection), explaining an average of 93.6% (later revised to 91.5%) of the variation in total plan returns.”

A number of researchers note FPs have drawn an incorrect conclusion from the BHB study. The 92% figure cited in the study was referring to variation (or volatility) of ones returns and not the total returns themselves. This issue was highlighted in an article by William Jahnke titled Its Time to Dump Static Asset Allocation.

The two most common asset allocation decisions are strategic and tactical. Strategic asset allocation is the determination of the amount of ones investments that are invested in stocks, bonds and cash. The allocation can be broken down further within each category, for example, large cap equities, small cap equities, etc. Tactical asset allocation involves moving ones investments away from the strategic allocation targets in an effort to invest in the asset style that appears to be undervalued or the one an investor believes will provide a higher return in the short run. To some, tactical asset allocation is referred to as market timing.

An investor must ask themselves what is the appropriate asset allocation. There isn’t one correct answer. For an investor whose investment assets are only sufficient to support their lifestyle, that investor should be concerned with losing principal in a down market. On the other hand, the investor needs to achieve a return at least equal to the rate of inflation so purchasing power is maintained. The best chance to achieve this result is to establish a core portfolio of high quality dividend growth stocks. These higher quality dividend paying stocks, historically, have lost less value in down markets. Conversely, in up markets, and over longer term time periods, the higher quality dividend paying equities have outperformed the S&P 500 Index. The investor can then build smaller investment positions around the core portfolio if the investor desires exposure to other equity asset classes.

The goal of a financial advisor should be to focus on an investor’s financial needs and goals over short and long term time horizons. From these goals and objectives, the FP should construct a portfolio that will strive to achieve a rate of return sufficient to grow ones investments to a level that equals or exceeds target asset levels developed in a financial plan. The benchmark for ones returns does not need to be a specific index, but should be the goals and objectives of each investor. If the S&P is down 20% in a specific year and an investor’s portfolio is down 18%, does this result achieve the target asset levels developed in the financial plan-not likely.

In conclusion, an investor should be aware of the fact the BHB study’s conclusion that 93.6% of an investor’s variation in returns is attributable to strategic asset allocation. The BHB study’s focus was on variation, or range of returns between the highs and lows. The BHB study did not address the allocation that would achieve the higher overall rate of return.


Tuesday, November 07, 2006

January Effect Comes in December

Several years ago an article titled Following the Bouncing Market was published at www.smartmoney.com. The article discussed what type of stocks outperform the market in December and why.


Market Update from Novemeber 6, 2006

Standard and Poor's notes "Stocks Stage Pre-Election Rally"

A brace of M&A news lifted major indexes. Analysts think an outright victory by either party could cause a sharp, short-term swing in the market

Stocks finished broadly higher Monday, boosted by some large buyout proposals. The docket for economic data was quiet this session ahead of Tuesday's congressional elections. Big money reportedly flowing in from Europe may also have lifted sentiment, amid indications Republican candidates may be narrowing the gap against their Democratic rivals, says Standard&Poor's Equity Research.

On Monday, the Dow Jones industrial average rose 119.51 points, or 1%, to 12,105.55. The broader Standard&Poor's 500 index added 15.48 points, or 1.13%, to 1,379.78. The tech-heavy Nasdaq composite climbed 35.16 points, or 1.51%, to 2,365.95.

NYSE breadth was decidedly positive, with 25 issues advancing for every 8 declining. Nasdaq breadth was 21-9 positive.

The upcoming election results could impact the markets in the short-term, though fundamentals will ultimately be more important, some analysts say.

"If the Republicans do retain both houses, then the market is likely to have a short-term reaction rally," says Richard Bernstein, chief investment strategist at Merrill Lynch, in a research report. "If the Democrats win both houses, then the market is likely to have a short-term reaction sell off. A split probably has little impact."

A Democratic takeover of one or both chambers of Congress could be good for Treasuries, others say. "As long as the economy continues growing at a reasonable clip, gridlocked government would provide an excellent backdrop for continued improvement in the budget deficit, with any significant new spending programs having little chance of getting past a White House veto and any attempt to extend or make permanent various temporary tax cuts a likely non-starter in a Democratic Congress," note Morgan Stanley economists Ted Wieseman and David Greenlaw. "Gridlock certainly worked wonders in the second half of the 1990s for the budget."

Still, other analysts don't expect the elections to swing the markets much in either direction. "The elections are unlikely to move markets in a big way unless the Republicans manage to maintain control of both Houses of Congress," says Steven Ricchiuto, chief U.S. economist at ABN Amro. "Gridlock will continue to dominate Capitol Hill politics under almost all possible election scenarios, but foreign investor confidence will be shaken if the Republicans hold onto the House." Investors were digesting M&A news Monday. Four Seasons Hotels (FS) received an offer to take the company private for $3.7 billion, or $82 per share in cash.


Monday, November 06, 2006

Election Outcome Impact on Equity Market

The November 8, 2006 edition of Standard & Poor's, The Outlook ($) newsletter contained an analysis of the impact on the equity markets based on which party or parties controlled Congress.

Sam Stovall, S&P Chief Investment Strategist, notes, "...Next year marks the third year of President Bush’s second term in office. Historically, stock prices have posted their best performances in the third year of the presidential cycle, rising an average of 18% since 1945 vs. an average of 9% for all four years. What’s more, third-year advances have been very consistent, as the S&P 500 climbed 93% of the time (the market was flat in 1947). The last time the “500” declined in the third year was 1939. The fourth year’s 8.6% average increase is second highest..."

(click on table for larger image)

Standard & Poor's, The Outlook, November 8, 2006

"...The S&P 500 posted better returns (and frequency of advance) during periods of political unity, but surprisingly strong results under the total gridlock scenario. The periods of partial gridlock, which were relatively rare, saw the weakest market returns on average..."

The analysis concludes, "...Since the stock market has performed well during periods of both political unity and total gridlock, the conclusion we draw is that either Wall Street doesn’t care who is running the government, instead focusing more on the Fed and fundamentals, or it dislikes disunity and would prefer to see a unified Congress — regardless of the party."


Sunday, November 05, 2006

Links to Sites/Articles on Dividend Paying Stocks


Friday, November 03, 2006

Canadian Income Trusts-Canadian Government Announces Plan to Tax Income Trusts and the Reason for Decline in Share Prices

After the market closed on Tuesday, the Canadian Finance minister announced the government had plans to tax income trusts in line with corporations. The tax would go into effect in 2007 for new trusts. Existing trusts would have a four year grace period before the tax would hit those companies. The announcement resulted in significant declines in the price of the shares of Canadian Income Trusts.

(click on graphs for larger image)

The reason for the share price decline is directly related to the fact the Canadian trust will have less “cash flow” to pay out as a dividend, repurchase stock or reinvest in the business because of the increase in tax on the company's earnings. The next significant event that could impact these shares is dividend cuts. I would caution an investor that desires to purchase shares in these trusts based solely on the trust's current yields.

If Congress in the U.S. were to eliminate or let expire the 15% tax on qualified dividends, it would be highly unlikely that U.S. dividend paying stocks experience a similar price decline like that of the Canadian Income trusts. The reason being cash flow for the U.S companies would not be impacted by a higher tax on individuals that receive the dividends. Certainly, the U.S company may reduce the dividend growth rate; however, the U.S company would still have access to the cash flow and the company may use the cash to either repurchase shares or reinvest in the business.


Should an Investor Worry about the 2010 Expiration of the Reduced Tax Rate on Dividends?

Congress has extended the 15% tax rate on qualified dividends to 2010. Would its expiration impact the market performance of dividend paying stocks?

First one needs to look at the impact on equity performance with the initial passage of the 15% tax rate on dividends contained in the Jobs and Growth Tax Relief Act of 2003. The Federal Reserve publish a paper in 2005 reviewing the impact on equity prices leading up to and following passage of the tax reduction act. In short, some state equity prices do not seem to have been greatly impacted by the reduced tax on dividends. This would seem a surprise since investors should be attracted to stocks paying a larger after tax dividend.

(click on graphs for larger image)

It is rare that one can point to a single factor when determining the movement of stock prices. The Federal Reserve paper notes President Bush’s Iraq ultimatum occurred on March 17, 2003. This was just two months after the President’s announcement of his tax cut proposal. The President signed the bill on May 28, 2003 and many articles discussed the favorable impact this bill would have on dividend paying stocks. A stock market rally did ensue in January 2004, but was short lived when Alcoa reported disappointing 4th quarter results.

In a Department of Treasury report dated March 14, 2006, it is noted “while numerous factors contributed to the rise in stock prices during the past three years, the dividend and capital gains tax cuts likely played an important role. One study estimated that the likely increase in aggregate equity values due to capitalizing the annual flow of permanent dividend and capital gains tax cuts would be 6 percent. Given the forward looking nature of the markets, it is not clear exactly when the effects of the dividend tax cut were capitalized into share prices or what the expected duration of the tax cut was. Assuming that the increase in equity values due to the tax cut occurred entirely in 2003, then as much as one-quarter of the 26 percent increase in the S&P 500 index for 2003 could be attributed to the capitalized value of the dividend and capital gains tax cut. This estimate is rough and ignores the influence of the tax cut on future investment behavior.”

The data is mixed on what has contributed to the strong market performance since the tax cut. What is certain is economic growth did improve subsequent to the passage of the tax reduction act.

Percentage Change in Real GDP over the Previous Period


Additionally, more companies began paying a dividend subsequent to the passage of the reduced tax rate on dividends.

Percent of Firms in the S&P 500 Paying Dividends: 1980-2005


So the question of whether a change in the tax paid on dividend distributions is an important one; however, the fundamental cash flow of companies has a larger impact on stock prices. With a change in the tax rate on dividends, the operating cash flow of a particular company remains unchanged, unless economic growth slows. The benefit of using a dividend growth discipline in selecting equity investments by an investor is this procedure enables the investor to gauge the operating stability of a company. Focusing ones investment analysis on companies that have ten or more years of consistent dividend growth likely mitigates the potential impact of dividend tax changes.


Thursday, November 02, 2006

October Performance of Dividend Payers versus Non Payers

Following is an update on the performance of dividend paying versus non-dividend paying stocks in the S&P 500 Index for the month of October. This information is compiled by Standard and Poors.

Total Return Performance as of October 31, 2006:


S&P 500

Average Average S&P 500 Weighted

S&P 500 S&P 500 Weighted Total

Payers Non-payers Change Return
Month - average change 3.72% 3.12% 3.15% 3.26%
YTD 13.24% 9.14% 10.39% 12.06%
12-months 19.35% 14.11% 14.16% 16.34%
Issues 384 116 500 500
Average yield
1.89%
1.81%