Showing posts with label Asset Allocation. Show all posts

Saturday, January 09, 2021

Broadening Participation In Equity Market Asset Classes

One favorable aspect of the recent equity market performance is the broadening participation of asset classes other than the large cap FANGMA stocks, Facebook (FB), Amazon (AMZN), Netflix (NFLX), Google (GOOGL), Microsoft (MSFT) and Apple (AAPL). As the below chart shows, during the first eight months of 2020, the average return of this basket of stocks significantly outpaced the other asset classes shown on the chart.


Saturday, March 28, 2020

Market Volatility May Create Opportunity

My blogging has been rather light the past few weeks as most of my effort has been focused on our clients' and reaching out to them during these uncertain times. I mostly write blog articles during the evenings and on the weekends and my wife has been hearing me say, "I want to get a blog post done."  So much to write about, but so much going on. With Ohio continuing under a 'stay at home' order, I am writing today.

The government's mandated shutdown that is in place in an effort to slow the spread of the COVID-19 virus has created an unusual economic and market environment.  Our firm's leadership, marketing, technology and human resource staff, have done yeoman's work on assisting in our client communication efforts. Our dedicated website landing page on the COVID-19 topic is just a small example of everyone's effort.


Monday, April 08, 2019

Tactical Asset Allocation Can Add Value To Portfolio Return

A potential downside for investors employing a strict longer term strategic investment allocation based on a specific benchmark or index is that the strategy fails to incorporate shorter term tactical changes. It certainly can go without saying but indexing strategies are popular ones for investors. In fact we utilize some index products in our investment approach with our clients. The downside for investors is many investment approaches may only utilize an index approach and construct an investment portfolio based on a longer term strategic asset allocation. In other words, a benchmark is selected and the client portfolio is allocated or invested in the same weightings that comprise that benchmark.


Sunday, January 17, 2016

Ed Hyman And Dennis Stattman On Their International Outlook

Earlier this week Consuelo Mack of WealthTrack conducted Part II  of her interview (Part I highlighted last week) with legendary economist Ed Hyman, Chairman of Evercore ISI, and Dennis Stattman, fund manager on BlackRock's Global Allocation Fund. This interview occurred after the market weakness experienced during the first week of January so both guests were aware of the early year market contraction.

Ed Hyman believes the global issues facing economies are a result of growing too slowly and attributes this to the slowdown in China. This below potential growth rate leads to potential deflation and he cites the issues within the commodity sectors. His favored international market is Europe, but does acknowledge the benefits taking place in Japan after nearly 25 years of no growth in that country. He does believe China is the key for the broader emerging market arena and does think China's economic policies are moving in the right direction, i.e., getting growth in consumer demand and moving away from fixed asset investment. He cites good China sales data from Apple and Alibaba. His biggest worry is the issues in the Middle East as a result of the decline in oil prices and the negative impact this has on revenues for those countries.

Dennis Stattman is a pound the table bull on Japan. He notes that earnings growth and dividend growth for Japanese firms has left price earnings ratios for Japanese companies nearly unchanged. He cites Japan is the only major area where earnings revisions are positive. He does worry about the debt growth in China and the slowing of GDP growth in the country. Dennis' biggest worry is China experiences a large decline in tts currency and that adjustment negatively impacts other emerging markets. He believes a world of quantitative easing, asset prices in the QE countries inflate and economies do benefit. Hedging the currency exposure is an important factor for individuals investing in Japan though.

As with the Part I interview, this is a worthwhile viewing for readers.


Sunday, January 10, 2016

Ed Hyman: Halfway Through Current Expansion Cycle

Ed Hyman, Chairman of Evercore ISI, and rated the number one economist for 35 consecutive years by Institutional Investor, recently sat for Part One of a two part interview with Conseulo Mack of WealthTrack, which was aired a few days ago. Also participating in the interview was Dennis Stattman, the Portfolio Manager of Blackrock Global Allocation Fund.

Hyman pointed out many positives he has witnessed in his travels around the country and gleaned from Evercore ISI's business surveys. In short, Ed Hyman believes the U.S. economy is only halfway through its current expansion. He believes the consumer, employment and now broadly rising wages are some factors that continue to support slow but steady U.S. economic growth. The interview does point out his concerns as well.

Dennis Stattman on the other hand, believes greater opportunities for investors can be found in non-U.S. markets. His concern is the U.S. economy and market growth have been largely supported by the Fed's quantitative easing programs. The U.S. market began to stumble last year once the Fed pulled back on its QE endeavors. Additionally, Dennis Stattman believes U.S. firms will find it difficult to grow profits in an environment where corporate profits as a percentage of GDP are at historically high levels. Dennis did not say this, but if one believes QE inflated U.S. equity prices, the European Central Bank and Bank of Japan continue to implement QE strategies.

The interview runs about 30 minutes and is a worthwhile viewing for readers. I will post Part Two when available, likely next weekend.


Monday, May 25, 2015

Incurring Investment Risk Near A Market Correction

One issue on the minds of a number of investors is the near term potential for an equity market correction. One's thinking is framed by the fact the S&P 500 Index has not incurred a 10+% correction in three and a half years or 916 trading days. This is the third longest streak as can be seen in the below chart. Include the fact first quarter 2015 earnings were not that great from a growth perspective, the economy (GDP) is growing at a snails pace and euro zone issues (Greece and now maybe Spain), it is not surprising investors are a little on edge.

From Blog of HORAN Capital Advisors 5 2015


Saturday, February 07, 2015

A Strong Dollar Does Not Mean Large Cap U.S. Multinationals Underperfom Small Cap Equities

The US Dollar has been on a strengthening trajectory since early 2011 and more so since mid year last year. This move in the Dollar has been a headwind for U.S. domiciled multinational companies earnings, with many firms citing this as a reason for earnings disappointment during this earnings reporting season.

From The Blog of HORAN Capital Advisors

One belief is investors can avoid this negative currency impact within their investment portfolio by focusing more on small company stocks since small caps are less exposed to this exchange rate risk. The thinking is small cap companies generate a larger percentage of their overall business from domestic sources versus the larger multinationals that generate a larger portion of their revenue from overseas. In fact this seems to be the case during the earlier phase of the Dollar's strengthening as the above chart shows small cap outperformance from 2010 through most of 2013. However, as the Dollar continues to strengthen, larger cap companies actually outperform small caps as occurred in the mid 1990s. This can be seen in the below chart that compares the relative return of large caps versus small caps (orange line) to the U.S. Dollar Index.

From The Blog of HORAN Capital Advisors

S&P Capital IQ provided additional analysis in a report released in late January titled, Don't Duck A Rising Buck. In the report S&P analyzed the performance of large cap stocks versus small cap stocks during bear markets and bull markets and compared the results to the trend of the U.S. Dollar. The report is a worthwhile read for investors. In short, the data suggests large cap companies actually outperform small cap companies in a rising Dollar environment when the overall equity market is in a bull market phase. This outperformance occurs when the Dollar Index rises above 95 (closed Friday just below 95.) The report contains a sector performance comparison as well.

From The Blog of HORAN Capital Advisors

There are several reasons this outperformance by large caps may occur when the Dollar Index is above 95 and when the equity market is in a bull phase. Foreign investors likely see the U.S. economy growing at a faster pace than other economies, and this is the case today. With this thinking, foreign investors will allocate investment funds to U.S. equities. In doing so, they tend to focus on larger multinational firms that are more broadly know. Additionally, larger equities are more likely to be more liquid. This additional investment flow into the U.S. and the investment in Dollar denominated assets further pushes the U.S. Dollar Index higher. For non U.S. investors then, they receive an additional return benefit from a positive currency exchange when Dollar's are converted back into their home currency.

Just one comment on small caps. At HORAN, we have been out of small cap equities since late 2013. A reason we chose to eliminate the category from our client allocations was partially due to the valuation of small cap stocks broadly. In a Reuters report today, Valuations May Hurt Small Caps, Despite Job Growth, the article cites the apparent overvaluation of small cap stocks. Specifically, the article notes,
"The trailing price-to-earnings ratio of the index is at 22.7, which is 40 percent more than its long-term average of 16.2. Its price-to-sales ratio of 1.6 is nearly 67 percent higher than its long-term average."
In summary, even though small caps are less exposed to overseas business, there are several factors that indicate large cap U.S. equities outperform in spite of the currency headwind. Additionally, the valuation of small cap stocks are likely to be a headwind for the small cap equity asset class.


Sunday, May 04, 2014

Are Mutual Funds Preparing For A Correction?

From an asset allocation perspective individual investors' equity weighting has reached a level last seen in mid 2007. According to the American Association of Individual Investors monthly asset allocation survey, the equity weighting at the end of April equaled 67%. This is down slightly from the 67.2% in the prior month; however, the prior high in the equity weighting level was 68.6% reach in June of 2007.

From The Blog of HORAN Capital Advisors
Source: AAII

Certainly the strong equity market advance since the end of the Great Recession has contributed to this higher equity weighting. Also, in spite of the fact investor fund flow data shows investors were cautious on allocating funds to equity until the beginning of 2013, equity flows continue to be positive. A bit surprising is the fact investor fixed income flows were positive in February and March as can be seen in the below chart.

From The Blog of HORAN Capital Advisors

So given the strong equity advance since 2009 and the individual investor's desire to increase equity exposure, generally late in a market cycle, are mutual fund companies preparing for an equity correction? The market has not experienced a 10% plus correction since late 2011.

From The Blog of HORAN Capital Advisors
Source: MarketWatch

The below chart compares liquid assets of mutual funds to the trend in the S&P 500 Index. The chart would seem to indicate fund managers are having more difficulty finding attractive investments and, maybe at the same time, preparing for investors to reduce equity exposure at the first sign of a market pullback.

From The Blog of HORAN Capital Advisors

In reviewing several sentiment indicators like the AAII Sentiment Survey and the Commitment of Traders Report, excessive bullishness by individuals or small investors does not seem present at the moment. These sentiment indicators can change fairly quickly though.


Sunday, June 30, 2013

A Look At The Emerging Markets Asset Class

One area of the global equity markets that has experienced a significant correction this year is the emerging markets. As the below charts of one, five and ten year returns indicate, the emerging market space (EEM, VWO) has significantly underperformed the U.S. market (S&P 500 Index) for one and five years, but maintains a large performance edge for ten years. Importantly for investors then is determining whether this recent correction is an opportunity to increase exposure to the emerging market space or not.

From The Blog of HORAN Capital Advisors

A recent research report published by Fidelity Investments, Secular Outlook for Global Growth: Challenges and Opportunities, outlines some key factors for investors to evaluate for various countries. A large part of the long term future growth potential within a particular market is based on a country's GDP growth expectations.

From The Blog of HORAN Capital Advisors

Population growth and productivity growth are key factors that contribute to a country's overall GDP growth potential. With respect to population growth, the report notes difficulties in comparing one country to another due to differing life expectancies. In summary though, Fidelity notes:
"Working-age populations have risen rapidly for several decades, but almost all countries will experience slower growth and receive less of a direct demographic benefit over the next 20 years. Mature countries such as Japan and parts of Europe—with the U.S. as a notable exception—will experience outright declines in working-age population. In general, growth will be faster in the developing world—Latin America, Africa, emerging Asia, and the Middle East—although China’s demographics are not as constructive (emphasis added)."

From a productivity standpoint the report notes three categories that are key drivers of productivity growth: people, structure and catch-up potential.
  • People: "The greater the human capital, the more productive the economy. According to our human capital index, which incorporates measures of educational and scientific achievement as key drivers of future innovation and adoption of new technologies, human capital accumulation over the past two decades should boost global growth in the next 20 years. Human capital tends to be higher in the world’s wealthiest regions, such as the U.S., Japan, and northern Europe. South Korea has the highest human capital ranking, and several emerging economies—including China, Turkey, Thailand, and Vietnam—have also made great strides..."

    "On balance, young populations in the developing world—such as Mexico, Colombia, and the Philippines—will benefit from a maturing phase. Formerly maturing countries—such as China, South Korea, and Thailand—will be disadvantaged as their populations enter the aging phase. Already aging societies—such as Russia, Germany, and Japan—will feel the most negative effects on productivity as their demographics deteriorate further (as noted in the below chart)."
From The Blog of HORAN Capital Advisors
  • Structure: "Complex economies tend to be more competitive, use technology more effectively, and have better business climates and more nurturing institutions (source: Hausmann, Hidalgo, et al.). As a result, higher complexity typically means higher productivity. Greater variety and more sophisticated products in a country’s output signal a more complex economic structure. For example, Japan has the highest complexity ranking, while a number of African countries rank very low. Complexity should contribute slightly to higher global growth over the next 20 years as increasingly complex emerging economies—such as South Korea, China, Hungary, and Thailand—offset stagnating complexity in the most advanced economies."
  • Catch-up Potential: "In theory, less advanced economies should grow faster than more mature economies, thanks to their ability to grow off a lower base, adopt existing technologies, and catch up or converge to the higher income levels of developed countries. In practice, however, this convergence does not occur automatically but is conditional on other factors, such as the people and structure of an economy."

    "Once we account for these other growth determinants, catch-up potential has been—and will continue to be—a positive contributor to global GDP growth. After the rapid growth in recent decades of larger developing economies, such as China, India, and South Korea, higher per capita incomes now leave less catch-up potential for the next 20 years. While smaller poor economies in Africa and other regions will still benefit, catch-up potential will generally contribute much less to global growth."
    If an investor's time horizon is three to five years (or longer), data would seem to support that some emerging or developing economies will be leaders in global growth. As with individual stocks, the direction of the growth rate plays a key role in a country's potential return as well. As the GDP charts earlier in the post show, GDP growth in countries like China and India having been slowing recently. This decrease in the growth rate can cause short term market disruptions. Also, as the ten year performance chart above shows, emerging markets have done quite well relative to U.S. equities, but are emerging market indices mean reverting?If so, the dangers of catching a falling knife are certainly present.

    From The Blog of HORAN Capital Advisors

    There are many additional factors one most consider, such as financial data quality, the political stability or lack there of, etc. However, it does appear some of the emerging economies do offer return opportunities for investors, albeit, these markets are likely to remain more volatile than developed market equities. It is estimated that the emerging markets will continue to capture a larger share of the world's GDP and at some point this will likely have a positive impact on emerging equities.

    From The Blog of HORAN Capital Advisors

    Source:

    Secular Outlook for Global Growth:
    Challenges and Opportunities

    Fidelity Investments
    By: Irina Tytell, PhD, Senior Research Analyst
    Lisa Emsbo-Mattingly, Director of Asset Allocation Research
    Dirk Hofschire, CFA, SVP, Asset Allocation Research
    June 2013
    http://tinyurl.com/ka9gqvx


    Saturday, February 23, 2013

    Most Investors Remain Cautious On Stocks

    In a recent survey by the Investment Company Institute (ICI) it was noted fund investors are less likely to assume "above average" or "substantial risks" within their investment portfolios. The survey noted,
    • "Since 2000, the share of baby boomers investing more than 80 percent in stocks in their retirement plans has dropped in half, to about 25 percent for 50-somethings and 21 percent for 60-somethings in 2011, the most recent data available."
    • "But boomers nearing retirement and current retirees burned in the 2008 market collapse keep paring back their risk profiles. Older investors are moving “from capital appreciation to capital preservation,” said Shelly Antoniewicz, an ICI senior economist. Even 35-49 year olds, who still have two to three decades of investing ahead of them, are not quite back to where they were earlier in the decade when they were more willing to take risks in the stock market."
    • "The exception is the under-35 crowd: 26 percent identified themselves as being in these higher-risk categories, slightly more than the 24 percent who did back in 2007."
    From The Blog of HORAN Capital Advisors

    Antoniewicz attributes the strong January flows to individuals investing year end bonuses as well as reinvestment of year end gains taken by investors to get ahead of potentially higher tax rates associated with the fiscal cliff.

    In mid January investor sentiment as reported by the American Association of Individual Investors did spike above the average level plus one standard deviation, i.e., 52. Since this elevated bullish sentiment level in January sentiment has declined to 41.8 for the week of February 21, 2013. Investors do not seem to be overly bullish on equities at this point in time and sentiment is a contrary indicator.

    From The Blog of HORAN Capital Advisors

    Source:

    Boomers Still Cautious About Stocks
    By: Financial Security Project at Boston College
    February 19, 2013
    http://fsp.bc.edu/boomers-still-cautious-about-stocks/


    Monday, February 04, 2013

    A Look At Our Firm's Fixed Income Exposure

    Since mid November interest rates have made a fairly strong move to the upside. Since the principal value of fixed investments moves inversely to rates, longer term fixed income investments have experienced principal declines. Recent treasury rate moves are noted as follows:
    • 10-year treasury has increased to 2.01% (2/1) from 1.57 (11/16)
    • 5-year treasury has increased to .87% (2/1) from .61 (11/16)
    In many of our client accounts we have attempted to get in front of this rise in rates by structuring our fixed income portfolio in a barbell type approach by focusing on shorter maturity investments on the one hand and focusing on lower quality credit on the other. It should be noted that late last year we did trim our high yield exposure in client accounts overweighted in this segment of the fixed income market.

    A couple of the short term investments we have utilized are Vanguard’s short term investment grade fund (VFSTX) and the iShares 1-3 year Credit Bond ETF (CSJ). We continue to like floating rate exposure and recently added to Fidelity's Floating Rate Fund (FFRHX). In a rising interest rate environment, floating rate investments should hold up better as the rates on the underlying fund investments adjust higher as rates rise. In the very short term, in a rapid spike higher in rates, the floating rate note principal can decline. In a gradual rise in rates that has occurred since late last year, the investments noted above, CSJ, VFSTX and FFRHX, have held up well and in fact have increased in value. Conversely, investments that have longer maturities, for example, Barclay’s Aggregate Bond Index (AGG) and 20-year Treasury Index (TLT) have both experienced principal declines from 2% to over 8% since mid November.

    The other area we maintain exposure is to credit via a high yield bond fund: Principal High Yield Fund (PHYTX) and the floating rate fund, both credit sensitive. Both of these have done well on a relative basis since November. We are sensitive to the fact treasury rates are rising and this is forcing the spreads on high yield bonds to narrow to low levels. The last area of fixed income we have allocated fixed dollars is in global bonds which we continue to be cautiously optimistic about. The global bond investment we utilize for clients is the Templeton Global Total Return Fund (TTRZX).

    From The Blog of HORAN Capital Advisors

    The top three lines on the above chart are fixed investments held in our client accounts. These three investment have held up well in this increasing rate environment. The treasury investment (TLT) and aggregate bond investment (AGG) have performed decidedly worse in the short run. The lines display the performance since 11/16/2012. As we noted in our recent Investor Letter, as a firm, we favor equity over fixed income tactically and would look to increase equity allocations with an equity market pullback.


    Saturday, January 19, 2013

    Now Fund Managers Turn Positive On Equity Markets

    The past two years certainly provided investors and fund managers with a sufficient amount of news headlines that could move the equity markets to the downside. The debt ceiling debate in 2011 (now being repeated in 2013), the election, the fiscal cliff and budget sequestration (kicked to early March 2013.) During this time period individual and professional investors remained cautious on the equity markets. Bond investments have been favored over stocks as the mood was "risk off".

    From The Blog of HORAN Capital Advisors

    With the calendar turning to a new year what is the mood of investors? In a recently released survey of fund managers by BofA Merrill Lynch, they find,
    "The new year sees asset allocators assigning more funds to equities than at any time since February 2011, while their confidence in the world’s economic outlook has reached its most positive level since April 2010. Investors’ appetite for risk in their portfolios is now at its highest in nine years..."
    During this period from April 2010 through early 2013, when the appetite for risk was low, the equity markets found a way to generate strong returns for investors. As the below chart shows, the S&P 500 Index and the Dow Jones Industrial Average generated price returns of 27% and 25%, respectively.

    From The Blog of HORAN Capital Advisors

    During the first few weeks of 2013, the equity markets continue to move higher.

    From The Blog of HORAN Capital Advisors

    Investor behavior biases have likely played a role in avoiding equities over the last few years while finding them attractive now. Investors are rightfully concerned about large losses as losses can do damage to one's retirement assets. Positive sentiment can also be attributed to the fact that last year the S&P 500 was positive for the entire year, i.e., it did not close in the red on a year to date basis on any single day, and so far in 2013 the streak continues.  According to an article by Avondale Asset Management,
     "While there was little mention of the S&P 500's perfectly positive year, the occurrence is actually pretty rare. Data for the S&P 500 since 1957 produced only three other years where the index started the year positive and never closed negative on a YTD basis during the year."
    As the longer term market chart above shows, a sell in May strategy certainly did not work in 2012. Might this be a year this seasonal approach works? These types of allocation moves are tactical ones and there is a downside if one is wrong. Barry Ritholtz, Director of Equity Research at Fusion IQ, discusses some of his mea culpas in 2012 and one of them was some of his tactical calls.

    At Dorsey Wright's Systematic Relative Strength blog he comments on a Time Magazine article that highlighted research that shows "the more hands Texas Hold'em poker players win, the more money they lose." Wright surmises "investors will often prefer a system with 65% winning trades over a system with 45% winning trades, even if the latter method results in much greater overall profits." The study author, Kyle Siler of Cornell University concludes, "People overweigh their frequent small gains vis-à-vis occasional large losses."

    For investors then, removing emotion from one's decisions is important in order to attain returns that meet retirement goals and objectives. Investors should develop an investment policy that can be used as a beneficial road map to follow in times of difficult markets. Difficult markets are not only ones that are declining, but also, feeling left behind in strongly rising markets as well.


    Sunday, December 02, 2012

    Implications Of An Elevated Equity Risk Premium For Asset Allocation

    Assessing the equity risk premium (ERP) is an important factor for investment professionals and corporate finance officers. I will forgo discussing the importance to a CFO in assessing the ERP and focus on investment professionals. Given the importance of the ERP one will find a surprising amount of disagreement around how to determine the appropriate ERP level. One can perform a "Google search" on "equity risk premium" and find an inordinate amount of research on the topic.

    For investors though, determining the appropriate ERP level should play a part in ones asset allocation decision. In short, the equity risk premium quantifies the additional rate of return an investor requires to compensate for the risk of investing in stocks versus a risk free asset, the 10-year treasury bond in this case. If an investor has a view that the market is under valued and likely to go higher, then one's view is the ERP will decline in the future. Conversely, if the investor has a view that the market is over valued and likely to go lower, then the investor believes the ERP will increase in the future. As can be seen with the green line in the below chart, the ERP is trading at near a historically high level. The basis for the calculation of the ERP is the earnings yield for the S&P 500, that is, the inverse of the index's P/E ratio.

    From The Blog of HORAN Capital Advisors

    As I noted, the ERP calculation used in the above chart is based on the market's earnings yield. Essentially, this is an ex post calculation and what is most important for an investor is the prospective expected market returns or ERP. For readers that are interested in a more detailed discussion of the ERP, Aswath Damodaran, a professor at Stern School of Business at New York University, published a paper (and is frequently updated) on the various methods utilized in calculating the ERP.

    Based on the current ERP level, the high excess return expected for the market, an investor should consider allocating a larger percentage of their assets to equities versus the risk free treasury bond asset. However, I have discussed several times about the fact investors continue to seek out bond investments versus equity investments based on fund flow data. The recent fund flow release from ICI continues to note the flow of funds out of equities and into bonds. Given the relatively high ERP, why are investors not allocating more investment dollars to stocks versus bonds?

    Although investors my not allocate larger dollars to equities, this doesn't mean stocks won't generate returns in excess of bonds. From a behavioral perspective investors tend to fear losses more than missing out on gains. With the number of negative market shocks investors have experienced since the year 2000, tech bubble, financial market crisis and the real estate bubble, this fear of loss is not surprising. Additionally, the markets hate uncertainty and events in Washington, D.C. have done anything but create more uncertainty.

    The below chart of the U.S. Economic Uncertainty Index is at its highest level other than the level reported at the height of the debt ceiling debate in August last year. The on again off again fiscal cliff discussions in Washington also include approval to raise the U.S.'s debt ceiling. The debt ceiling debate in 2011 was not a positive for the equity markets.
    From The Blog of HORAN Capital Advisors

    At the end of the day, investors not only need to have a longer term horizon to invest in equities, but they need to have tools to help evaluate the potential direction of the ERP. There are several variables investors can utilize, like the Index of Leading Economic Indicators. This is important as it provides insight into the direction of the economy and hence the impact on corporate earnings. Also, investors can look at the consumer confidence index due to its inverse correlation to the ERP.

    From The Blog of HORAN Capital Advisors

    An article in the Journal of Investment Consulting, Does the Stock Market's Equity Risk Premium Respond to Consumer Confidence or Is It the Other Way Around?, provides support that so long as consumer confidence does not remain at near historical lows, long term investors can find the current risk/reward of the equity market attractive. The cited research in the article indicates satisfactory equity returns can be achieved with relatively low downside risk.


    Monday, October 08, 2012

    More Weakness Seen With Modern Portfolio Theory

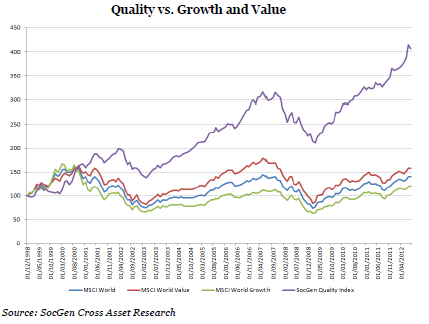
    Niels Jensen's, of Absolute Return Partners, market letter to investors notes how Modern Portfolio Theory (MPT) has become less effective over time. Over the past few years we have written several posts (here and here) on the problems with MPT. One chart in the Jensen's market letter displays the increasing correlation between asset classes that has developed since 2000 thus limiting the effectiveness of diversification as outlined in Modern Portfolio Theory.

    From The Blog of HORAN Capital Advisors

    Additionally, the market letter notes the outperformance of "quality" stocks versus say growth or value. As the letter states, quality refers to the strength of a company's balance sheet as well as the sustainability of its dividend policy.

    From The Blog of HORAN Capital Advisors

    A key for investors is to understand the approach taken by their investment manager in constructing their investment portfolio.

    Source:

    When Career Risk Reigns (PDF)
    Absolute Return Partners LLP
    By: Niels J. Jensen
    October 2012
    http://www.arpllp.com/core_files/The_Absolute_Return_Letter_1012.pdf


    Monday, September 03, 2012

    Recession Risk In U.S. Rising But Still Low

    From a business cycle perspective, Fidelity recently released a report that indicated the risk of a recession in the U.S. was rising. Although the rising recession risk is low, the report cited weak "external" factors as the cause. Also, these weak external factors may be impacting company earnings expectations as noted in yesterday's post: Companies Lowering Earnings Guidance For Third Quarter.
    From The Blog of HORAN Capital Advisors

    In spite of this higher risk, the U.S. and Japan remain in the mid-cycle expansion phase, while China is contracting.
    From The Blog of HORAN Capital Advisors

    Importantly for investors, one question being ask is where should investment dollars be allocated if the economy is nearing a slowdown.  Our post, Sector Rotation and The Economic Cycle, will provide some insight. Clearly, the U.S. economy is slowing. The Bureau of Economic Analysis released the second revision of GDP last Wednesday and it estimates GDP growth in the second quarter came in at 1.7%. This compares to 2.0% real GDP growth in the first quarter.

    Source:

    Business cycle update: recession risks rose
    Fidelity Viewpoints
    By: Dirk Hofschire, CFA, SVP, Asset Allocation Research, and Lisa Emsbo-Mattingly, Director of Asset Allocation Research
    August 24, 2012
    https://www.fidelity.com/viewpoints/market-and-economic-insights/august-business-cycle-update


    Wednesday, September 01, 2010

    Alternative Investments: Navigating Volatile Markets

    The world has changed. Market volatility is here to stay and increased correlations are making investors less reliant on modern portfolio theory. These higher correlations are likely the result of the globalization of trade, the introduction and adoption of new investment vehicles, and quantitative trading programs. The lack of diversifying properties within asset classes, particularly equity, has caused serious reservations among investors about future prospects. A recent Barron’s article commented that mutual fund flows from January 2008 to June 2010 has nearly $600 billion dollars moving into bond mutual funds while nearly $250 billion has exited equity funds (chart below).

    From Horan Capital Advisors Blog

    Ramblings about bubbles forming in the bond market may have investors spooked but data would not suggest any near term outflows. Investors have opted for fixed income securities as more and more people become frustrated and disenchanted with equity returns. However, those same investors are starved for yield and now frequently reach to uncharted territory to satisfy income needs. Is lower quality or longer duration better? Which camp are we in, deflation or inflation? Is the double dip going to become a reality or is extended slow growth the next step? The common investor asks every day, “Where should I direct my investments?” Maybe he or she should be asking, “How do I invest to reduce overall market risks?”

    Investors need strategy specific solutions which can provide consistent returns and hedge systemic risk. The environment for the past decade calls for such. The investment management community has heard those cries and responded quickly by providing alternatives in various wrappers: ETFs, ETNs, alternative mutual funds, structured products, and hedge funds. Clearly the adoption of these various vehicles has added to market variability but nevertheless, their intent is often times to provide hedged market returns within specific or multiple asset classes. These vehicles attempt to set predetermined return expectations. Some managers focus on absolute returns while others position for hedged but directionally long exposures. Regardless of which strategy, both intend to provide consistent and more predictable return streams.

    Alternative investments, in their truest form, are unencumbered from trading constraints and provide intellectual freedom far beyond traditional money manager constraints. Example strategies: capital structure arbitrage, special situation events, long/short exposure, discretionary and systemic market trading. The global opportunity set truly becomes utilized as alternative investment managers act to expose market dislocations without traditional market boundaries. Alternatives are simply an expansion of an existing asset class or an investment intermediary between traditional asset classes to help facilitate acceptable balances between risk and return. Investors move between equity and fixed in a blurred or complimentary fashion via alternative investments. Managers must evaluate the means in which they assess market volatility relative to the fees they pay for risk-adjusted returns. For example, hedged equity has mostly long equity properties and should perform like long equity over a full market cycle but with significantly less market variability. Fixed income arbitrage and equity market neutral strategies should exhibit standard deviations equivalent to conservative fixed income securities as they hedge most market risk in an effort to achieve absolute returns conservatively higher than the risk free rate. A liquid alternative with compelling numbers in this category is the TFS Market Neutral Fund (TFSMX).

    From Horan Capital Advisors Blog

    In this type of economic environment, investors should be setting allocations to investment vehicles that answer the questions regarding how they will generate better risk-adjusted returns rather than where they will necessarily find them.


    Saturday, April 10, 2010

    Investors Continue Piling Into Bond Funds

    One thing investors have a tendency to do is chase returns. Market technicians look at investor fund flow data as a contrarian signal. Given the poor long term return of many stock related investments and the strong bond returns one would think investors might be more attracted to equity investments at the moment. In fact bonds have outperformed stocks over the last 10 and 20 year period and given the low level of interest rates can this possibly continue? In a recent research piece by Fidelity titled, Stocks Anyone? (PDF), it is noted,
    "investors actually took money out of stock funds on a net basis during the past year. Meanwhile, the $385 billion of net flows investors put instead into bond funds is more than they ever put into stock funds during a 12-month period—even during the technology bubble of the late 1990s."
    Although investors are investing some of their funds into equities, a majority of the inflows are going into bond funds as outlined in the below table.


    Additionally, the below charts indicate graphically that investors do have a tendency to chase returns; however, that has not been the case over the course of this past year. Although stocks are outperforming bonds significantly, net flows continue to favor bond funds.


    Maybe the significant equity shocks of the last decade (technology bubble and real estate bubble) have resulted in investors taking a longer perspective on equity returns. The below chart compares the 10-year rolling relative performance to fund flows.


    This lack of investor interest in stocks is a contrarian sign that suggest equity investors might have a performance advantage compared to bond investors on a forward looking basis.

    Source:

    Stocks Anyone? (PDF)
    Market Analysis, Research & Education
    Fidelity
    By: Dirk Hofschire, CFA
    March 25, 2010
    http://personal.fidelity.com/products/pdf/stocks-anyone.pdf


    Sunday, March 28, 2010

    Misconception Surrounding The Importance Of The Asset Allocation Decision

    Many investment advisers will indicate that one of the most important variables an investor needs to determine is their asset allocation. The reason behind this has to do with a study completed over 20 years ago by Brinson, Hood and Beebower that indicated that 93.6% of an investor's return is attributable to asset allocation. I wrote a post on this study a few years ago titled, Asset Allocation: Pros and Cons.

    In a study reported in the March/April 2010 Financial Analyst Journal titled, The Equal Importance of Asset Allocation and Active Management and written by James Xiong, CFA, Roger Ibbotson, Thomas Idzorek, CFA and Peng Chen, CFA, it is shown that asset allocation is not nearly as important as many believe. In another article in the March/April 2010 FAJ, The Importance of Asset Allocation (PDF), Roger Ibbotson provides a summary of the aforementioned study.

    In the summary several important conclusions are noted:
    • many investors mistakenly believe that the BHB (1986) result (that asset allocation policy explains more than 90 percent of performance) applies to the return level (the 100 percent answer). BHB, however, wrote only about the variation of returns, so they likely never encouraged this misrepresentation.
    • In general (after controlling for interaction effects), about three-quarters of a typical fund’s variation in time-series returns comes from general market movement, with the remaining portion split roughly evenly between the specific asset allocation and active management.
    • Do the BHB (1986) time series have any meaning at all in explaining the incremental importance of a specific asset allocation policy? Not necessarily. Perhaps the simplest illustration was given by Mark Kritzman (2006) in a letter to the editor of this journal titled “‘Determinants of Portfolio Performance—20 Years Later’: A Comment.” Kritzman constructed an example in which stock and bond returns moved up and down perfectly together (i.e., were equal to each other each year) while underlying securities did not. The BHB methodology incorrectly ascribed all 100 percent of the return variation to asset allocation, whereas, in fact, all the variation came from stock selection and general market movement.
    • The time has come for folklore to be replaced with reality. Asset allocation is very important, but nowhere near 90 percent of the variation in returns is caused by the specific asset allocation mix. Instead, most time-series variation comes from general market movement, and Xiong, Ibbotson, Idzorek, and Chen (2010) showed that active management has about the same impact on performance as a fund’s specific asset allocation policy (emphasis added).
    Investors are encouraged to read the Ibbotson summary to get a clearer perspective on asset allocation decisions.


    Tuesday, June 30, 2009

    Investor Sentiment, Cash and the Market

    As noted in some of my prior blog posts, I frequently review various sentiment indicators. At extreme levels, these indicators can highlight turning points in the market. In addition to investor bullish versus bearish sentiment, another indicator gaining quite a bit of attention lately is investor cash levels. I noted in a post over the weekend that money market fund assets remain at a fairly high level.

    The American Association of Individual Investors (AAII) surveys its members on a monthly basis regarding investor asset allocation. These investors indicated they had 42% of their investments allocated to cash in December 2008. In the most recent survey (May 2009) investors indicated they had 35% of assets invested in the cash portion of their allocation. AAII's asset allocation survey goes back to 1987 and the average cash level since the survey began is 25%. Investors continue to be overweight cash versus the historical average.

    The below chart graphs the cash allocation (red line), the S&P 500 Index (green line) and the 3-period moving average of the Bull/Bear Spread (white line). Given the various sentiment indicators, it does appear investors are still skeptical of the market's current level. From a contrarian perspective then, sentiment would indicate the market could continue to grind higher.

    (click to enlarge)

    investor cash levels, bull bear spread and S&P 500 Index chart
    The sentiment data can be difficult to evaluate. The Technical Take website has a different view of the sentiment data that is worth reading as well.

    What is missing in all of the data to this point are truly positive factors and not simply less negative. One potentially positive data point could be company earnings reports in the second half of the year. The market tends to trade on expectations and companies will certainly have an easier time achieving earnings growth compared to the year earlier reported results.


    Wednesday, April 15, 2009

    Diversification and Correlation During Market Crisis Periods

    One factor that has been painfully clear in this market downturn is the high correlation of nearly all asset classes. The result for investors is nearly all the asset classes experienced significant declines during the recent market contraction. So what is the purpose of diversification if it does not minimize the negative portfolio returns during stress market periods? The answer begins with the question as to what are investors trying to diversify.

    During periods of market stress there tends to be two factors that influence the price of investments:
    • there is a flight to quality and
    • a high demand for liquidity
    This flight to quality and demand for liquidity causes investors to flock to the safest investments. For fixed income this tends to be government bonds and for equities it tends to be high quality equities. These high qulaity equities tend to be large cap blue chip dividend growth stocks.

    A recent paper by Barclays Global Investors titled, Is Diversification Dead?, provides more detail on the conundrum for investors as it relates to the diversification issue.

    Is Diversification Dead
    In the end though, it is difficult to predict when the market will experience these significant drawdowns. For investors, building the foundation of the equity portion of their investment portfolio in high quality dividend paying stocks is one way to potentially gain some assurance they will not experience significant market value erosion in market downdrafts.

    As I have written several times before, when the market rallies off of a bottom during these corrective phases, the higher quality equity investments will likely lag the broader market returns though.