Monday, October 31, 2011

Will This Be A Buy The Dip Type Market For Stocks?

October was certainly a good one for the U.S. equity markets in spite of the 276 point decline today. The Dow Jones Industrial Average increased more than 1,000 points in the month returning 9.5%. The S&P 500 Index increased 10.8% in the month and was the best return since December 1991. A 3-5% pullback certainly would not be surprising given the strength of the advance in October. Will investor then buy into this pullback? I believe they will. One key will likely be the ability of the market to find support around the 200 day moving average of 1,274.

From The Blog of HORAN Capital Advisors

From a fundamental perspective, valuations and earnings for companies in the S&P 500 Index in Q3 are coming in at a respectable level. Of the 315 companies that have reported results for Q3, 71% have reported earnings above analyst expectations and this is higher than the long term average. Importantly to, revenue growth has growth has exceeded expectations as well.

Almost two years ago, I wrote a post that focused on indicators investors might evaluate to determine the future direction of the economy. Following is an update on several of those indicators and they do suggest the economy is not going to dip into another recession.

Durable Goods Orders
  • a positive trend continues in durable goods orders since the recession end in 2009.
From The Blog of HORAN Capital Advisors

Jobless Claims
  • jobless claims remain stuck above 400,000; however, they are trending lower. This is indicative of of a slow growth economy. The initial report for Q3 GDP was growth at 2.5%.
From The Blog of HORAN Capital Advisors

Retail Sales
  • strength in retail sales continues to surprise on the upside.
From The Blog of HORAN Capital Advisors

Chicago PMI
  • the Chicago ISM-Purchasing Managers Index came in below expectations today; however, the reading remains above 50 indicating an expansionary environment.
From The Blog of HORAN Capital Advisors

Consumer Confidence
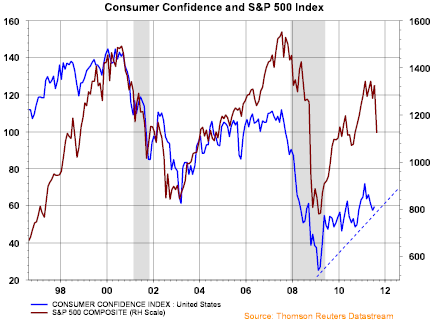
  • an area of concern is the confidence level of consumers and businesses. The lack of business confidence was highlighted in the Chicago Purchasing Managers release today. Businesses have concerns above the strength of the economy going into 2012. As the below chart shows, consumer confidence (blue line) is trending lower as well. This lack of confidence on the part of both businesses and consumers will likely constrain economic growth and result in a slow growth environment through the election in 2012.
From The Blog of HORAN Capital Advisors

Looking to the end of the year, volatility will likely be the norm. Washington, D.C.'s so-called Gang of 12 needs to come up with a "credible" deficit reduction plan. With the U.S. dealing with its debt issues along with the EU's sovereign debt issues, the cure for dealing with over leverage will likely be slower economic growth, but growth nonetheless. These issues alone will influence market action in the short term. Company fundamentals though look to be good and fundamentals tend to drive long term investment returns.


Saturday, October 22, 2011

Is The Steep Contraction In The China 25 Stock Index A Red Flag?

For some perspective on one of the more important global stock markets, today's chart focuses on Chinese stocks and presents the current trend of the iShares FTSE/Xinhua China 25 Index (FXI). As today's chart illustrates, Chinese stocks have endured what amounts to an extremely wild ride since 2005. The FXI trended upward at an ever accelerating rate (i.e. parabolic) from 2005 to Q4 2007. As the credit bubble began to unravel, so too did Chinese stocks with the FXI trending downward at an ever accelerating rate from Q4 2007 to Q4 2008. Beginning in Q4 2008, the FXI surged -- gaining over 155% trough to peak. Since that post-financial crisis peak back in Q4 2010, Chinese stocks initially treaded water but more recently have entered in to a steep downward trend channel. Considering China's increasingly significant contribution to the global economy, this recent stock market action is most definitely a red flag.

From The Blog of HORAN Capital Advisors


Friday, October 21, 2011

Third Quarter 2011 Investor Letter

Correlations were high in the strongly negative performing third quarter for most equity markets. So far in October though, the market has rallied strongly off the lows resulting in one of the best performing Octobers since 2000 with one week remaining. Europe's efforts to come up with a solution to their sovereign debt issues and Washington's Deficit Panel or Gang of 12 outcome could create headwinds for the market. Our 3rd Quarter Investor Letter contains our prospective views on the market for the balance of the year and into 2012.

HORAN Capital Advisors' complete Investor Letter can be accessed at the following link: 3rd Quarter Investor Letter


Wednesday, October 19, 2011

Deficit, Debt And Law Of Large Numbers

This evening I had a conversation with an individual whose career is working as an economist. The discussion topic focused on taxes and the deficit. He was adamant that the risk for the U.S. was centered around the "law of large numbers" as it relates to this countries debt level.

This brought to mind the article post written by Terry Horan, the CEO of our business partner firm HORAN Associates, on his blog today, Parties in the Park and Dancing in the Dark. In his post he discusses the 99 Percenters argument that they believe the system is rigged, they are not getting a fair shake and it is time for change.

In Terry's post he shows the below table of federal tax receipts, spending and the government deficit, which was detailed in a recent Wall Street Journal article. In the table the deficit is also shown as a percentage of GDP. What stands out is the growth in the deficit due mostly to an increase in spending. Tax receipts for 2011 are higher than 2010 and 2010 is higher than 2009. For 2011 personal income tax collections were higher by 21%!

Also reported by the Wall Street Journal, "revenue rose 6.5% billion to $2.3 trillion, the equivalent of 15.4% of gross domestic product, largely due to higher income-tax receipts in fiscal 2011, the Treasury said. Spending climbed 4.2% to $3.6 trillion, or 24.1% of GDP, largely due to higher spending on interest, Medicare and Social Security. Thirty six cents of every dollar spent by the federal government in fiscal 2011 was borrowed (emphasis added).

The fallacy of showing the deficit as a percentage of GDP is, at some point, the debt grows to a level where it can't be repaid within any reasonable time if at all. Or, in looking at Greece, there are no buyers of the debt. For the U.S., it's buyer is China.

What makes the discussion about our $14 trillion debt difficult for the average person to comprehend is the absolute size of the number where billions and trillions simply do not seem like real numbers--the "law of large numbers". A recent article at the American Thinker website, The National Debt is Beyond Our Comprehension, attempts to put the amount into perspective.

"We can probably get our minds around a million dollars, but beyond that the numbers become mere abstractions. They simply cease to be real. They are not real, because we really cannot visualize them in a meaningful way. We may have gotten used to hearing about billions, but trillions are really beyond our mental grasp. How many of us, for example, can state the number of zeros in a trillion without having to count them? There are twelve. Now try to mentally visualize the number one trillion. Can you do it? Can you really see a "1" followed by twelve zeros in your mind? I can visualize a billion, but that is only nine zeros: three groups of three. It takes some effort to mentally see four groups of three zeros.

Suppose someone was going to give you $1 every second of every minute, of every hour, of every day without stopping. How long would it take them to give you $1 trillion? Well, let's see. There are 60 seconds in a minute, so that is $60 every minute. Then there are 60 minutes in every hour, so that means we would receive $3,600 every hour. Wow! Even my plumber doesn't charge that much. In a single day, therefore, you would receive $86,400. Most people don't get that much in a year.

Since there are 365¼ days in a year, at the rate of $1 per second the pile of dollar bills would amount to only $31,557,600. Now we are talking real money. That is a lottery jackpot most of us would love to win. But that is still just a number in the low millions.

So, at a dollar a second how long would we have to wait before we could see the pile grow to $1 trillion? Are you ready for the answer? Drum roll, please. It would take over 31,688 years. Even at $10 per second they would still have to have started handing you the money more than a thousand years before the birth of Christ! And even at $100 per second none of us could live long enough to get it all.

At $100 per second we are still only talking about $8,640,000 a day. So in a year you would have accumulated only a little over $3 billion. It will take more than 316 years to reach $1 trillion.

A trillion dollars is so much money that you and I would probably not be able to spend that much for ourselves unless we bought a small country somewhere. Most of us would have trouble trying to spend a billion dollars, and a trillion is a thousand billion. So, if the government wants to reduce the deficit by a trillion dollars, it would have to do the equivalent of cutting a billion dollars from each of one thousand government programs...

The frightening truth is that Congress cannot easily cut $1 trillion from the deficit. The reality is that if you gave a new congressman on his first day on the job a copy of the budget, and told him to cut $10,000 from the budget every second of every day nonstop, his term in Congress would be up before he had cut out $1 trillion."
As much as the government would like taxpayers to pay more into the treasury, the real answer is spending cuts need to be the primary focus immediately. This is something the Deficit Panel or so-called Gang of 12 committee in Washington is having difficulty agreeing on.


Wednesday, October 05, 2011

S&P 500 Buybacks Over $100 Billion in 2nd Quarter

Preliminary buyback data released by Standard and Poor's indicates S&P 500 companies bought back $109 billion of their stock in the second quarter. This is the first time buybacks have exceeded $100 billion since the first quarter of 2008 when buybacks totaled $113 billion. On a year over year basis, the Q2 buyback amount was 41% higher than the buyback total in Q2 2010.

Howard Silverblatt of S&P notes,
"At this point, companies are continuing to use buybacks to prevent earnings dilution from employee options, as well as shares used for dividend reinvestment programs. Few companies are venturing outside of the box to purchase additional shares, as was the common practice from late 2005 through mid-2007."
Silverblatt goes on to note,
"Exxon Mobil's buybacks have reduced its share count by 18.5% over the past five years ($129 billion), which may cost it its position as the largest company in the world."
From The Blog of HORAN Capital Advisors
Data source: Standard & Poor's

Interestingly, as the box in the chart details, the cumulative earnings generated by the companies in the S&P 500 Index since 2001 have been returned to shareholders either in the form of a dividend or stock buybacks.


Saturday, October 01, 2011

Companies Buying Back Shares Are Outperforming

It has been some time since I last reported on the performance of companies that buyback their own equity shares. With a number of companies sitting on large amounts of cash and announcing share buybacks, including Berkshire Hathaway (BRK.A), one way to track the performance of companies buying back shares is to review the performance of the PowerShares Buyback Achievers Portfolio (PKW). The PowerShares Buyback Achievers Portfolio will normally invest at least 90% of its total assets in common stocks that comprise the Share BuyBack Achievers™ Index.

The PowerShares Buyback Achievers Portfolio is based on the Share BuyBack Achievers™ Index. To become eligible for inclusion in the Index, a company must be incorporated in the U.S., trade on a U.S. exchange and must have repurchased at least 5% or more of its outstanding shares for the trailing 12 months.The Share Buyback Achievers™ Index is a trademark of Mergent® and currently consists of 142 companies.

As the below chart and table detail, the Buyback Portfolio (PKW) has a recent history of outperforming the broader market S&P 500 Index. Over the last two years ending 9/30/2011, PKW has generated a return of 21.87% versus the broader market S&P 500 Index return of 7.03%.

From The Blog of HORAN Capital Advisors

From The Blog of HORAN Capital Advisors

Investors should be aware of the fact that the Buyback Achievers Portfolio does contain sector concentrations. Additionally, the Portfolio does not contain any energy stocks at this time.

From The Blog of HORAN Capital Advisors
The top 10 holdings in the Index are:

From The Blog of HORAN Capital Advisors


Monday, September 26, 2011

Francois Trahan Interview: Fed No Longer Effective

In Francois Trahan's recent interview with WealthTrack's Consuelo Mack, Francois explains why he believes the Fed has run out of bullets in managing the economy via the Fed Funds rate. In short, he believes the old economic rules do not work and new market drivers should be considered by investors. Francois believes the new Fed Funds rate is actually the consumer price index or CPI.

Francois has been rated the #1 portfolio strategist for the last three years by Institutional Investor. The interview includes Francois' view on the market for Q4 and 2012.


Sunday, September 25, 2011

Dividends As An Alternative To Low Bond Interest Rates

The low level of interest rates on fixed income investments is forcing investors to consider alternative income sources in their investment portfolio. One income source investors have considered as an alternative is dividend paying stocks. A caveat is stocks have historically been more volatile (standard deviation) than bonds as noted in the below table.

From The Blog of HORAN Capital Advisors

However, given the low level of bond interest rates, the yield on dividend paying stocks is now at its highest level relative to bond interest rates in nearly 50 years.

From The Blog of HORAN Capital Advisors

From a return standpoint, dividends have been a stable portion of equity returns. Dividend paying stocks have also been less volatile than the broader equity market as noted in the first table above.

From The Blog of HORAN Capital Advisors

Lastly, given where bonds rates are today, it is hard to envision rates moving lower over the next three to five years given the state of the U.S. federal budget. Printing currency (higher potential inflation) and devaluing the dollar seems to be a likely path that will be pursued in Washington, D.C. Not if, but when rates turn higher, bond investors are likely to get hurt as bond values contract.

For the dividend stock investor, corporate balance sheets are in pretty good shape with high levels of cash. A portion of these cash balances is likely to be used in increasing dividend payments to the company's equity holders. I suspect these low corporate payout ratios are likely to increase over the next three to five years; thus, providing some income growth for investors.

From The Blog of HORAN Capital Advisors


Source:

Generating Income From Stocks
Fidelity Viewpoints
By: Dirk Hofschire, CFA, VP, Asset Allocation Research, and James Morrow, Portfolio Manager, Fidelity Viewpoints
September 21, 2011
https://guidance.fidelity.com/viewpoints/non-bond-income


Wednesday, September 21, 2011

Checking In On The Dogs Of The Dow

As I have noted in the past, one investment strategy that seems to garner press attention from time to time is the "Dogs of the Dow" investment strategy. The strategy consists of selecting the ten stocks that have the highest dividend yield from the stocks in the Dow Jones Industrial Index (DJIA) after the close of business on the last trading day of the year. Once the ten stocks are determined, an investor would invest an equal dollar amount in each of the ten stocks and hold them for a year.

The strategy has generated mixed results over the years; in 2010 and year to date this year, the strategy has been fairly effective. Last year the Dow Dogs returned 20.5% versus the Dow Jones Industrial Index return of 14.1%. Year to date through 9/21/2011 the Dogs of the Dow have returned .8% versus the DJIA return of -3.9%.

From The Blog of HORAN Capital Advisors


Friday, September 16, 2011

Where Is The Cash?

With the recent sell off in the equity markets that began in mid July, one would suspect cash balances would be elevated. As the below chart notes, cash balances as a percentage of all mutual fund assets is near record lows though. Historically, low levels of money market cash have been associated with equity market tops.

From The Blog of HORAN Capital Advisors

On the other hand given the meager interest rates paid on deposits investors might be going elsewhere with their cash. From a strategy perspective, some investors and money managers have moved cash investments to shorter term bond funds in an effort to earn a higher yield. When looking at fund flows into bond funds, this does not seem to be too much of the case though.

From The Blog of HORAN Capital Advisors

Alternatively, maybe investors have moved cash to bank deposits. One reason for doing this would be an effort to at least receive FDIC insurance on their deposits. Also, some investors may be exhibiting cautious behavior due to potential sovereign debt exposure in money market funds. The below chart though doesn't seem to indicate significant deposits have been moved to banks outside of what we would normally expect.

From The Blog of HORAN Capital Advisors

Even margin debt is elevated and stands at pre-Lehman levels.

From The Blog of HORAN Capital Advisors

At the end of the day, it appears the market may be stuck in a trading range. This slow economic growth environment and global deleveraging cycle could be contributing to the lower cash levels. Possibly excess investor cash has been used to paydown debt. Positive technicals do include the MACD and RSI indices as noted below; however, recent market strength has been occurring on lower volume.

From The Blog of HORAN Capital Advisors


Monday, September 12, 2011

HORAN Launches A Blog Focusing On Health.Wealth.Life Issues

Today HORAN Associates, HORAN Capital Advisors' business partner, launched a blog focusing on industry trends and data related to health care and wealth management. The blog, HORAN Health.Wealth.Life, will focus on articles written by HORAN Associates' CEO, Terry Horan, CLU, ChFC, and will focus on two of the greatest challenges Americans are facing today:
  • access to quality, affordable health care; and
  • securing professional counsel to build and sustain wealth for a lifetime
As Terry notes, readers will want to visit the new blog often "to stay informed on the two biggest challenges facing America today? One would certainly be access to great health care for the balance of what will in most cases be a very long life. Two would be making sure individuals and families will have enough accumulated wealth to live out this life with value and meaning. Because life without health is no great life and life without the means to enjoy it, actualize dreams, fulfill wishes and provide for coming generations is no great life either."


Friday, September 02, 2011

Unemployment Rate and U-6: Not Much In This Release Is Positive

In today's release of the unemployment rate, there really isn't much positive data contained in the report. The unemployment rate remains at 9.1% with the non-farm payroll report showing no increase versus expectations of +75,000 increase. The broader measure of labor force utilization is known as the U-6. This measure shows the unemployment/underemployment rate increased to 16.2%. The U-6 measure is one that captures marginally attached workers which are individuals not looking for work although they would like a job and those that are employed in part time positions although they prefer full time employment.

From The Blog of HORAN Capital Advisors


Sunday, August 28, 2011

Weaker Consumer Confidence/Sentiment A Headwind

The sentiment readings released so far this month continue to be reported at levels weaker than those associated with stronger economic growth. The IBD/TIPP Economic Optimism Index is reported near the beginning of each month. In August, the TIPP Economic Optimism Index declined by 5.6 percentage points to a historic low of 35.8 vs. 41.4 in July. The index is 8.6 points below its reading of 44.4 in December 2007 when the economy entered into its last recession. Index readings above 50 indicate optimism; below 50 indicate pessimism. The TIPP Index does a fairly decent job forecasting other sentiment reports released later in the month.

From The Blog of HORAN Capital Advisors

The TIPP Index is comprised of three components, all of which declined in August:
  • The Six-Month Economic Outlook: a measure of how consumers feel about the economy’s prospects in the next six months.
  • The Personal Financial Outlook: a measure of how Americans feel about their own finances in the next six months.
  • Confidence in Federal Economic Policies: a proprietary IBD/TIPP measure of views on how government economic policies are working.
Of the 921 adults/households surveyed nationally this month, 29% of households say that at least one member of the household is looking for a full-time job. The economic policies to date have certainly not created jobs.

From The Blog of HORAN Capital Advisors

The consumer sentiment index released this past Friday was reported at 55.7 which was below expectations of 56, but, higher than the 54.9 reported in July. Tuesday the Conference Board releases its consumer confidence index. Consensus expectations are for the confidence report to come in at 52%. These levels are very depressed and far from an 80% reading that would be consistent with strong economic conditions. The importance of these sentiment and confidence figures is their correlation to consumer spending and more specifically retail sales.

From The Blog of HORAN Capital Advisors
Source: Barron's

Historically consumers have accounted for 70% of GDP and this deleveraging cycle is certainly influencing the consumer.


Sunday, August 21, 2011

Equity Put/Call Ratio Above 1.0 Again

Once again the equity put/call ratio moved above 1.0 at the close on Friday, reaching 1.04. The equity P/C ratio tends to measure the sentiment of the individual investor by dividing put volume by call volume. At the extremes, this particular measure is a contrarian one; hence, P/C ratios above 1.0 signal overly bearish sentiment from the individual investor. This indicator's average over the last 5-years is approximately .7, indicating the individual investor has been generally mostly bullish and more active on the call volume side.

From The Blog of HORAN Capital Advisors

For the institutional investor, technical analyst generally consider the index put/call ratio as a reflection of institutional sentiment. The index P/C ratio is slightly elevated at 1.53 and above its 5-year average of 1.4; however, in August 2007, the index P/C ratio stood at 2.7. Some would consider the current level of the index P/C as neither a bearish or bullish market sign at this time.

At HORAN, we believe business fundamentals are contrasting with equity market actions. This divergence is being driven in large part by the lack of confidence in Europe in dealing with its sovereign debt issues and in Washington's inability to deal with its budget deficit. Additionally, the amount of regulatory uncertainty that includes health care reform and potential income tax reform is a factor in business' ability to commit to longer term expansion plans. All of this also weighs negatively on consumer confidence and sentiment as well.

As the below chart shows, consumer confidence remains in an uptrend since early 2009; however, since February 2011 the confidence trend has been declining.

From The Blog of HORAN Capital Advisors

Lastly, there are some positive economic data points.
  • Industrial production in July was reported at .9% versus expectations of .5%. May and June industrial production were revised higher as well.
  • Leading economic indicators index increased .5% versus expectations of a .2% increase.
  • The Conference Board's coincident economic index (CEI) increased .3% with all four of its components increasing. Industrial production is a component of the CEI.
From The Blog of HORAN Capital Advisors
It is difficult to predict the markets in the short term, but technicals are starting to point to an oversold level as noted in this chart link and fundamentals, corporate and economic, are not decidedly negative. It seems to portend a slow economic growth environment with a focus on deleveraging around the globe.


Friday, August 19, 2011

Philly Fed Report Not A Good Predictor Of Future Stock Market Action

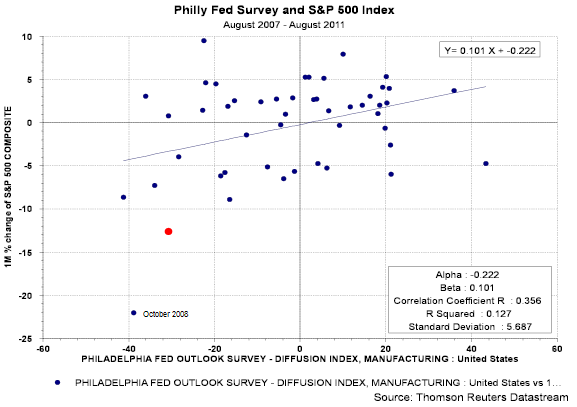
Analyst are extrapolating the weak report for the Philadelphia Fed Outlook on Thursday as a precursor to more stock market weakness. In actuality though, the monthly performance of the S&P 500 Index has a very low correlation to the monthly Philly Fed report. The below chart shows the data from August 2007 through August 2011. The "red" plot point is the August 2011 data.

From The Blog of HORAN Capital Advisors

As the above chart shows, the monthly Philly Fed report and the monthly return for the S&P 500 Index have a low correlation of .356. Additionally, the R-squared is only .127. The t-statistic is very low as well. The flatness of the best fit line is some indication that the market's performance is not very dependent on the monthly Philly Fed data.

In looking at the one year return for the S&P 500 regressed against the one month Philly Fed data does show a higher correlation, .791 and a higher R-squared of .626. If I compare the data back to 1996, the correlation and R-squared are slightly lower than that show in the below chart. Additionally, the one month S&P return versus monthly Philly Fed report has a very low correlation and low R-squared.

From The Blog of HORAN Capital Advisors
In a vacuum and in the short term then, this one Fed report is not a good predictor of future market returns. Certainly, the Fed report deserves investor attention; however, this data needs to be balanced against other fundamental company data and other economic data. We do believe the risk of a recession has risen, maybe 50-50 now versus one in three several weeks ago. Issues in Europe and lack of leadership in Washington in dealing with budget and economic issues is weighing negatively on consumer and business sentiment. This negative influence on sentiment can negatively impact future economic activity.


Monday, August 08, 2011

Certainly Short Term Oversold After Today

After today's market downdraft, the market is certainly oversold on a short term basis. The percentage of stocks trading above their 50 day moving average is now at the same level reached in late 2008, i.e., .40%. The caveat is, historically, the market has had a tendency to trade lower on a prospective basis after these low moving average percentage levels are reached.

From The Blog of HORAN Capital Advisors

Additionally, for those that are superstitious, the S&P 500 Index feel 6.66% today and reached a low of 666 in March 2009. Could it be at least a short term bottom?

From The Blog of HORAN Capital Advisors

A key question will be the impact the recent market action has on consumer and business sentiment. Additionally, if Congress and the administration in Washington would simply stop pointing fingers at S&P and admit and address the budget problem, i.e., reduce federal expenses, the market could find firmer footing. Now the increased risk is the negative impact on sentiment and is the potential impact on sentiment enough to tip the economy into a recession. Lastly, Europe has problems that could ripple through the global economy as well.


Sunday, August 07, 2011

U.S. Government Spending Versus Revenue As % Of GDP

As S&P noted in their downgrade of the U.S. government's credit rating, the rate of growth in the U.S.'s spending is a significant reason for the downgrade.

From The Blog of HORAN Capital Advisors


Saturday, August 06, 2011

Government Regulations Fueling Business Uncertainty

Talk to any owner of a business and they will tell you one of the major issues that inhibits the company's ability to grow is not only the level of regulations, but the proliferation of ongoing new regulations.

A recent report by the Heritage Foundation notes,
  • The spring 2011 Unified Agenda (also known as the Semiannual Regulatory Agenda) lists 2,785 rules (proposed and final) in the pipeline (emphasis added).
  • Of those, 144 were classified as “economically significant.” With each of the 144 pending major rules expected to cost at least $100 million annually, they represent at least $14 billion in new burdens each year.
From The Blog of HORAN Capital Advisors

Another negative impact of increased regulations is it swells the growth of government.
  • ...regulatory staff at federal agencies (full-time equivalents) increased about 3 percent between 2009 and 2010, from 262,241 to 271,235, and is estimated to rise another 4 percent—to 281,832—in 2011.
  • Federal outlays for developing and enforcing regulations are also expected to grow by 4 percent this year, from $46.9 billion in 2010 (in constant 2005 dollars) to $48.9 billion.
Reducing the regulatory burden would be one way Congress and the administration in Washington could relieve some of the uncertainty facing companies in the private sector. Additionally, reducing the growth of regulations would stem the growth of government.

Source:

Red Tape Rising: A 2011 Mid-Year Report

The Heritage Foundation
By: James Gattuso and Diane Katz
July 25, 2011
http://www.heritage.org/research/reports/2011/07/red-tape-rising-a-2011-mid-year-report


Friday, August 05, 2011

U.S. Credit Rating Downgraded From AAA to AA+

For the first time in history, the U.S.'s credit rating was lowered by Standard & Poor's from AAA to AA+. S&P’s action is the most tangible vote of disapproval so far by Wall Street on the deal between President Obama and Congress to cut the deficit by at least $2.1 trillion over 10 years. S&P has said that it wanted at least $4 trillion of deficit reduction. S&P noted the recent debt ceiling hike did not adequately deal with the underlining deficit issues. The federal budget is at a point where Congress and the administration must deal with the growth in the budget's long term annual deficits.

The full S&P downgrade report can be read here.


Uncertainty: A Correction But Not 2008/2009

This morning we sent out a client note covering the recent market action in light of the market's volatility. Much of the recent discussion has centered around the U.S. economy falling into a “double dip” recession. A recent JP Morgan strategy comment to investors noted the following:
“Historically, US recessions were about over expansion (consumer or business) followed by a contraction of liquidity-businesses/consumers have strong balance sheets and while the US bank system is extremely well capitalized today, it is hard to imagine the right impulse exists to create a recession.”
Our market comment titled, Uncertainty: A Correction but not 2008/2009, can be read by clicking the comment title link.

If we can answer any additional questions, please do not hesitate to call on us.