In a post I wrote on July 12, 2009, Economic Indicators That May Signal A Bottom In The Economy, I noted six indicators investors might follow to determine the future direction of the economy. The indicators outlined back in July were excerpted from a Kiplinger's Personal Finance magazine article. The magazine article noted when three of the six below indicators turn in a favorable direction, then an economic recovery is likely unfolding. At this point in time three of the six indicators support the contention an economic recover is unfolding.
The three indicators that are in an improving trend are:
- Jobless Claims
- Retail Sales
- Interest Rate Spread (the TED spread)
- Durable Goods Orders
- Existing home Sales
- Consumer Confidence
- Look for a four-week moving average hitting 550,000 and continuing to decline would signal that companies have stopped slashing jobs. The four week moving average is 473,750.
Durable Goods Orders
- A two- or three-month uptrend in orders -- excluding defense, aircraft and other transportation equipment -- would presage an expanding economy. New orders for manufactured durable goods in October decreased $1.0 billion or 0.6 percent to $166.2 billion according to the latest U.S. Census Bureau report. This was the second monthly decrease in the last three months. This followed a 2.0 percent September increase. Consequently, this indicator's trend falls short of meeting an uptrend requirement.
 Source: Federal Reserve Bank of St. Louis
Retail Sales
- Two to three straight months of increasing sales would mean consumers have more money in their pockets and are willing to spend it. Each of the last two months have seen higher retail sales. Sales have increased from $343.7 billion in September to $352.1 billion in November.
 Source: Federal Reserve Bank of St. Louis
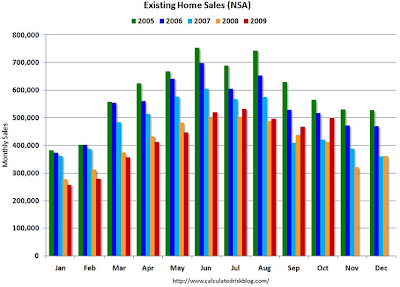
- Two or three consecutive months of growth would be a sign that investors and would-be homeowners are back in the market. Although existing home sales are not showing sequential 2 or 3 months of growth, since May, sales in 2009 have exceeded the monthly sales of the same period in 2008.
Data Source: National Association of Realtors
Consumer Confidence
- An index in the 60s would suggest that consumers will be less tightfisted. The November Index was reported at 49.5 versus the prior months index reading of 48.7. According to the Conference Board, "the moderate improvement in the short-term outlook was the result of a decrease in the percent of consumers expecting business and labor market conditions to worsen, as opposed to an increase in the percent of consumers expecting conditions to improve. Income expectations remain very pessimistic and consumers are entering the holiday season in a very frugal mood."

Interest Rate Spread
- A narrowing of the gap to about one-half of a percentage point would signal improving health in the banking sector. The spread has remained below 50 basis points for the last six months.
 Source: Bloomberg
Also noted in my earlier post, the stock market tends to be a leading indicator. Once a number of the data points become more favorable, the market tends to move higher in advance of the economic data confirming a stronger or improving economic environment. My March 9th post touches on the lagging nature of the consumer confidence data as an example.


1 comment :
I think we may be more than halfway through this thing...but according to Ken Rogoff, that won't mean a quick recovery.
http://www.planbeconomics.com/2009/12/12/aftermath-of-financial-crises/
Post a Comment