The market's performance around the presidential election cycle is one technical data point that seems to garner quite a bit of press-so here we go.
Standard & Poor's recently updated the cycle data through the first quarter of 2010 and going back to 1945. What the data suggests is the worst performing period for the market is Q2 and Q3 of the second year of a president's term. As the below table notes, the second quarter averaged a loss of 2.0% and the third quarter averaged a loss of 1.0%. For the quarter to date period in Q2 of this year, the S&P 500 Index is down 8.61% through the market's close on June 4th. This 8.61% decline is far worst than the average decline of 2.0%. In fact May's return of -8.2% is the worst May return for the market since 1962.
Standard & Poor's recently updated the cycle data through the first quarter of 2010 and going back to 1945. What the data suggests is the worst performing period for the market is Q2 and Q3 of the second year of a president's term. As the below table notes, the second quarter averaged a loss of 2.0% and the third quarter averaged a loss of 1.0%. For the quarter to date period in Q2 of this year, the S&P 500 Index is down 8.61% through the market's close on June 4th. This 8.61% decline is far worst than the average decline of 2.0%. In fact May's return of -8.2% is the worst May return for the market since 1962.
 |
For Q4 of the second year, Q1 of the third year and Q2 of the third year, the frequency of positive returns was over 80%. For a sign that the market might achieve these positive returns investors should look for market leadership in the cyclical sectors like, autos, steel and equipment related firms. So seeing positive momentum from the industrial, materials and some consumer discretionary related companies could be a signal that the market will resume its upward advance.
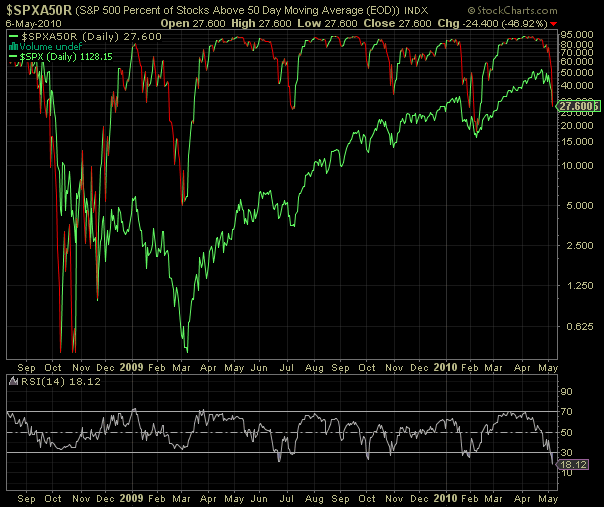
In looking at the chart technicals for the S&P 500 Index, downside volume has been on the decline. One question that jumps out in the chart is whether the red line around the 1,050 level on the S&P is support or whether it is the neckline in a head and shoulder chart pattern. If the market can push through the 1,150 level on the S&P, i.e., break the resistance of the left shoulder of the pattern, technically the market could see additional strength. In the end though, the market will trade on fundamentals.
In looking at the chart technicals for the S&P 500 Index, downside volume has been on the decline. One question that jumps out in the chart is whether the red line around the 1,050 level on the S&P is support or whether it is the neckline in a head and shoulder chart pattern. If the market can push through the 1,150 level on the S&P, i.e., break the resistance of the left shoulder of the pattern, technically the market could see additional strength. In the end though, the market will trade on fundamentals.
 |
We are cautiously optimistic about the market through year end. With this recent pullback, there are a number of high quality companies that are trading at attractive valuations and have decent yields. The market will not move higher on a straight line basis and volatility is likely with us for some time. However, investors are getting an opportunity to begin building positions in attractive high quality companies at this point in time.
Source:
Whistling a New Tune in June?
Standard & Poor's
By: Sam Stovall, Chief Investment Strategist
May 28, 2010
http://tinyurl.com/2eegx46