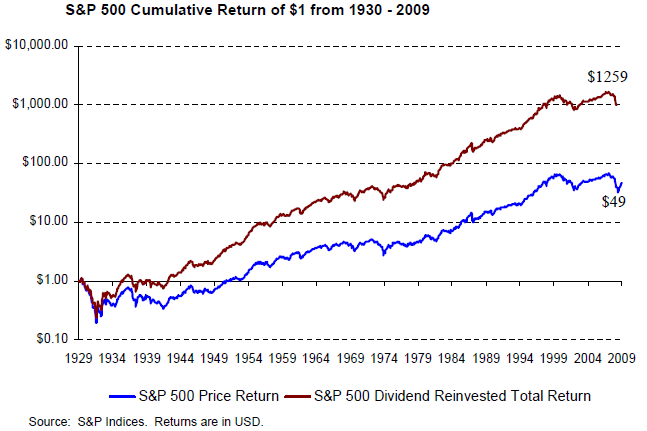
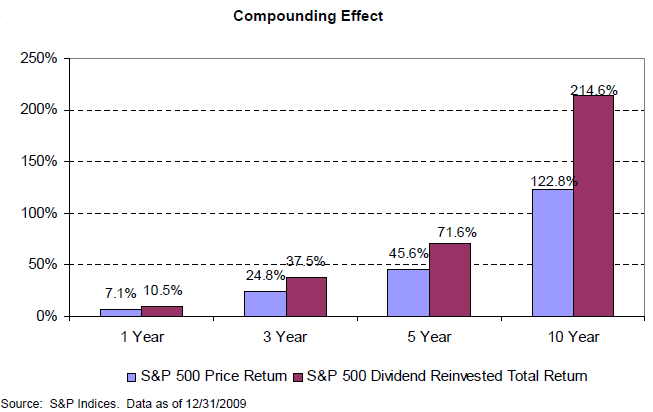
There tends to be much debate on whether dividends are a critical factor in determining the suitability of a particular investment. One fact is clear though and that is since 1926 the dividend component of the S&P 500 has accounted for one-third of the index's total return. As you read further in this post, Dividend Aristocrats have outperformed the S&P 500 Index on both a return basis and with less risk (beta).
 |
The two charts below show the cumulative return of a dollar for the S&P 500 Index on a price only basis and total return that includes reinvested dividends since 1926. The second chart shows the power of compounding on a percentage basis.
 |
 |
An important factor to review in selecting dividend growth stocks is S&P's Quality Ranking. Standard & Poor's states:
The ability of management to maintain stable or increasing dividends indicate the quality of the firm’s earnings and its growth prospects. The S&P Common Stock Ranking systems, for over 40 years, ranks stocks in categories based on growth and stability of earnings and dividends. [The below chart shows] ...the distribution of quality ranks of the constituents of the S&P 500 Dividend Aristocrats against those of the S&P 500 Index.
 |
Given the strong market returns in 2009, one potential advantage to investing in dividend growth equities and specifically the Dividend Aristocrats, is the Aristocrats tend to outperform the market in down markets. Many are calling for a market correction and the past several days are providing support for that line of thinking. As the below table shows the Aristocrats not only outperform the S&P 500 Index over 3, 5, 10 and 15 year time periods, the Aristocrats outperform while exhibiting less risk. That is the standard deviation of returns is lower for the Aristocrats as compared to the S&P 500 Index.
 |
The calendar year returns going back to 1998 are outlined in the chart below. In down markets the Aristocrats achieve significant outperformance relative to the market.
 |
The math behind compounding shows if one losses less in a down market, it takes a lower return to get back to even. In essence, if one losses less in the down market period, the portfolio will have more invested when the market turns around and moves higher.
 |
Finally, one thing investors need to keep in mind as it relates to the Aristocrats is the 43 stocks that comprise the Aristocrats in 2010 result in some sector overweights and underweights. As an example, the technology weighting is a little over 2% for the Aristocrats and the S&P 500 Index weighting is over 19%. For the staples sector, the Aristocrats list is 23% while the S&P 500 Index is 11%. Therefore, investors need to perform their own research before investing in any stock or buying into any particular strategy like a dividend focused one.
Source:
S&P 500 Dividend Aristocrats
Standard & Poor's
By: Aye M. Soe and Dave Guarino
PDF via .docstoc

No comments :
Post a Comment