Disclosure: Long Procter & Gamble
Posted by David Templeton, CFA at 3:46 PM 1 comments
Labels: General Market
Posted by David Templeton, CFA at 7:48 PM 2 comments
Labels: Economy
Posted by David Templeton, CFA at 11:19 PM 0 comments
Labels: Book Review
- 2009 was the year of the beta trade. In 2010 the focus will be on companies that generate free cash flow and pay dividends.
- anticipate upside surprise for companies with exposure to southeast Asia economies.
- Francois believes a contrarian view could be rates actually fall in 2010. On a percentage basis, interest rates have risen as much as the equity markets have moved higher.
Posted by David Templeton, CFA at 3:47 PM 0 comments
Labels: Economy , General Market
Posted by David Templeton, CFA at 12:12 AM 0 comments
Labels: Dividend Return , Investments
"The last challenge that I would like to discuss with you today involves disclosures associated with a fund's yield or its managed distribution plan. Closed-end funds sometimes tout a high, level dividend or a managed distribution plan to investors. Investors may incorrectly believe that the dividend rate is "yield," i.e., earned income or gain. In fact, the dividend rate often includes a return of capital (emphasis added). As directors, you must make sure that the fund's disclosures explain what the distribution yield represents and what it does not represent and that it is not confused with the fund's actual performance. In particular, if a fund with a managed distribution plan does not earn enough income to sustain a distribution, it must be clear that distributions to investors may be paid from a return of capital which has the effect of depleting the fund's assets. Moreover, in exercising your oversight, you should carefully consider whether managed distribution plans continue to be in the best interests of the fund and its shareholders.
Let me highlight one additional managed distribution plan disclosure issue for your consideration. As you know, funds are required under Rule 19a-1 to provide notice when distributions include a return of capital. In reviewing these notices, my staff has found inconsistencies between 19a-1 notices and other information posted on a fund's website. In particular, the 19a-1 notices show the return of capital while other charts on a fund's website show distributions consisting of all income. Funds have indicated to us that the reason for any differences is because the disclosures are prepared under different bases with 19a-1 notices disclosing book values and other disclosures based on tax considerations. However, fund websites do not always include an explanation discussing why the information is inconsistent in different online sections. Accordingly, I suggest that you review your fund's disclosures to make sure that the information is disclosed consistently and, if not, that the reason or reasons for any inconsistencies are adequately explained to investors."
Posted by David Templeton, CFA at 9:23 PM 1 comments
Labels: Dividend Return , Investments
Posted by David Templeton, CFA at 1:17 PM 0 comments
Labels: Investments
Posted by David Templeton, CFA at 9:11 PM 0 comments
Labels: General Market
Posted by David Templeton, CFA at 8:59 PM 0 comments
Labels: Sentiment
Posted by David Templeton, CFA at 11:06 PM 0 comments
Labels: Dividend Analysis
Posted by David Templeton, CFA at 10:00 PM 0 comments
Labels: Dividend Analysis
Posted by David Templeton, CFA at 8:27 PM 0 comments
Labels: Dividend Analysis
Posted by David Templeton, CFA at 6:08 PM 1 comments
Labels: Economy
- Look for a four-week moving average hitting 550,000 and continuing to decline would signal that companies have stopped slashing jobs. The four week moving average is 473,750.
- A two- or three-month uptrend in orders -- excluding defense, aircraft and other transportation equipment -- would presage an expanding economy. New orders for manufactured durable goods in October decreased $1.0 billion or 0.6 percent to $166.2 billion according to the latest U.S. Census Bureau report. This was the second monthly decrease in the last three months. This followed a 2.0 percent September increase. Consequently, this indicator's trend falls short of meeting an uptrend requirement.
- Two to three straight months of increasing sales would mean consumers have more money in their pockets and are willing to spend it. Each of the last two months have seen higher retail sales. Sales have increased from $343.7 billion in September to $352.1 billion in November.
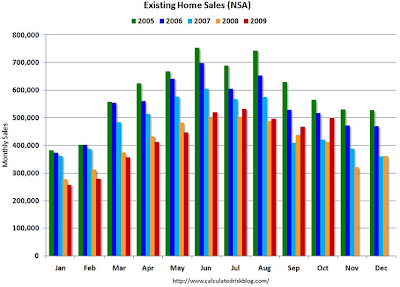
- Two or three consecutive months of growth would be a sign that investors and would-be homeowners are back in the market. Although existing home sales are not showing sequential 2 or 3 months of growth, since May, sales in 2009 have exceeded the monthly sales of the same period in 2008.
- An index in the 60s would suggest that consumers will be less tightfisted. The November Index was reported at 49.5 versus the prior months index reading of 48.7. According to the Conference Board, "the moderate improvement in the short-term outlook was the result of a decrease in the percent of consumers expecting business and labor market conditions to worsen, as opposed to an increase in the percent of consumers expecting conditions to improve. Income expectations remain very pessimistic and consumers are entering the holiday season in a very frugal mood."
- A narrowing of the gap to about one-half of a percentage point would signal improving health in the banking sector. The spread has remained below 50 basis points for the last six months.
Posted by David Templeton, CFA at 4:50 PM 1 comments
Labels: Economy , General Market
"While we do expect additional dividend decreases, Standard & Poor’s believes that improving economic conditions will inspire companies to slowly increase their payouts," notes Howard Silverblatt, Senior Index Analyst at S&P Indices. "We expect dividend rate increases to average in the mid to high single digits, with the second half of the year much better than the first half as companies will need time to reassure themselves of their product and financial position."
Posted by David Templeton, CFA at 10:28 PM 0 comments
Labels: Dividend Analysis
The S&P 500 Dividend Aristocrats Index is designed to measure the performance of S&P 500 constituents that have followed a managed-dividends policy of consistently increasing dividends every year for at least 25 years. The index is equal-weighted, with constituents being re-weighted every quarter. Membership is reviewed each December.
Posted by David Templeton, CFA at 5:27 PM 1 comments
Labels: Dividend Analysis , Dividend Return
Posted by David Templeton, CFA at 7:39 PM 0 comments
Labels: Dividend Analysis
"Nucor has increased its regular, or base, dividend for 37 consecutive years -- every year since it first began paying dividends in 1973. Reflecting the Nucor team's success in building Nucor's long-term earnings power, the base quarterly dividend has more than tripled since the end of 2007. In addition, over the period from 2000 to 2009, Nucor's base dividend has increased approximately ten-fold."
Posted by David Templeton, CFA at 9:16 PM 0 comments
Labels: Dividend Analysis
Posted by David Templeton, CFA at 8:29 PM 0 comments
Labels: Dividend Return
Posted by David Templeton, CFA at 4:11 PM 0 comments
Labels: General Market , Investments
Posted by David Templeton, CFA at 10:59 PM 1 comments
Labels: Economy , General Market
"Roubini states, so what is behind this massive rally? Certainly it has been helped by a wave of liquidity from near-zero interest rates and quantitative easing. But a more important factor fueling this asset bubble is the weakness of the US dollar, driven by the mother of all carry trades. The US dollar has become the major funding currency of carry trades as the Fed has kept interest rates on hold and is expected to do so for a long time. Investors who are shorting the US dollar to buy on a highly leveraged basis higher-yielding assets and other global assets are not just borrowing at zero interest rates in dollar terms; they are borrowing at very negative interest rates – as low as negative 10 or 20 per cent annualised – as the fall in the US dollar leads to massive capital gains on short dollar positions."
"The U.S. dollar has become a huge ‘carry trade’ vehicle for all risky assets. Historically, there is no correlation at all between the DXY index (the U.S. dollar index) and the S&P 500. In the past eight months, that correlation is 90%. Ditto for credit spreads — zero correlation from 1995 to 2008, but now it has surged to 90% since April. There was historically a 70% inverse correlation between the U.S. dollar and emerging markets, such as the Brazilian Bovespa, and that correlation has also increased to 90% since the spring. Even the VIX index, which historically has had no better than a 20% correlation with the U.S. dollar, has now sent that correlation surge to 90%. Amazing. The inverse correlations between the U.S. dollar and gold and the U.S. dollar and commodities were always strong, but these too have strengthened and now stand at over 90%."
"If a ‘speculative bubble' were driving equity prices higher, presumably volumes would reflect the exuberance,” Mr. Hatheway said. “Yet average daily trading volume on the New York Stock Exchange has been declining since 2005, reversing the strong trend growth over the previous decade."
There is one bubble that is worth noting, UBS suggested. As the price of gold has increased, so too has derivative volumes."
"There, soaring prices have coincided with an increase in derivatives volumes. That squares with our view that what is driving gold prices is not a supply-demand imbalance in the physical market, but rather an increase in financial demand, he said.
"Gold prices and derivatives activity, in other words, show signs of a market driven by financial demand, either for hedging or speculative purposes. But what's notable is that gold is unique – equity, credit and even government bond markets do not show evidence of a similar pick up in derivatives activity."
"we (UBS) believe price gains largely reflect improved fundamentals, including signs of global economic recovery, the strength of emerging economies, and a recovery of earnings. Financial market activity—including the size of the financial sector as well as funds flows and derivatives activity—remains subdued by historical standards."
"Until leverage resumes market outcomes will be driven mostly by growth and earnings expectations. Importantly, as well, uncertainty about monetary policy 'exit strategies' is likely to boost market volatility next year. And with many asset classes now close to 'fair value', risk-adjusted returns are likely to be lower in the year to come."
Posted by David Templeton, CFA at 5:06 PM 2 comments
Labels: Economy , General Market , International
Posted by David Templeton, CFA at 2:29 PM 0 comments
Labels: General Market , International
Posted by David Templeton, CFA at 10:22 PM 0 comments
Labels: Sentiment
Posted by David Templeton, CFA at 6:45 PM 0 comments
Labels: Technicals
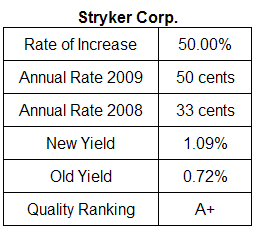
- The estimated payout ratio will equal 48% based on 6/2010 estimated earnings of $1.89. This compares to the 5-year average payout ratio of approximately 53%.
- The company carries an S&P Earnings & Dividend Quality Ranking of A+.
Posted by David Templeton, CFA at 10:26 PM 0 comments
Labels: Dividend Analysis
- The estimated payout ratio will equal 43% based on 12/2010 estimated earnings of $1.46. This compares to the 5-year average payout ratio of approximately 36%.
- The company carries an S&P Earnings & Dividend Quality Ranking of B+.
- The estimated payout ratio will equal 33% based on June 2010 estimated earnings of $3.68. The reported earnings for the year ending June 2009 equaled $3.18.
- The company has an S&P Dividend & Earnings Quality Ranking of B.
Posted by David Templeton, CFA at 9:46 PM 0 comments
Labels: Dividend Analysis
Posted by David Templeton, CFA at 11:00 AM 0 comments
Labels: Sentiment
Posted by David Templeton, CFA at 10:09 AM 0 comments
Labels: Economy , General Market
From Disciplined Approach to Investing |
Posted by David Templeton, CFA at 10:32 PM 0 comments
Labels: General Market , Technicals
Posted by David Templeton, CFA at 1:44 PM 1 comments
Labels: Economy
Posted by David Templeton, CFA at 11:59 PM 1 comments
Labels: Investments
Posted by David Templeton, CFA at 10:15 PM 0 comments
Labels: Sentiment
Posted by David Templeton, CFA at 7:44 PM 0 comments
Labels: Dividend Return
- From March 9th, the 165 trading days produced a 53.16% gain for the S&P 500, which is the best gain since the 53.76% increase in October 1938.
- While the market remains 33.80% off its 2007 high, the gains have mostly stayed with little profit taking and few major selling days.
- Volatility picked up during October and continues to remain higher than historical values, although lower than the first half of 2009. Year-to-date, there have now been more days where the S&P 500 moved less than 1% than more than 1%. However, the swings have also been fewer and less drastic. The last 5% move was on March 23rd (+7.08%), with the last 3% move occurring on June 22nd (-3.06%).
Posted by David Templeton, CFA at 9:26 PM 0 comments
Labels: Dividend Return
Posted by David Templeton, CFA at 11:52 PM 0 comments
Labels: Technicals
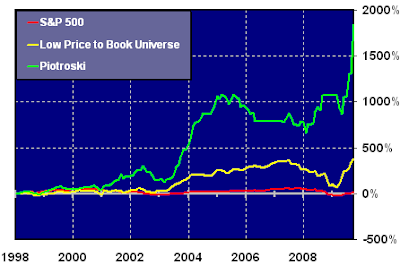
- The price-to-book ratio ranks in the lowest 20% of the entire Stock Investor AAII database.
- The stock does not trade on the over-the-counter exchange.
- The return on assets for the last fiscal year (Y1) is positive.
- Cash from operations for the last fiscal year (Y1) is positive.
- The return on assets ratio for the last fiscal year (Y1) is greater than the return on assets ratio for the fiscal year two years ago (Y2).
- Cash from operations for the last fiscal year (Y1) is greater than income after taxes for the last fiscal year (Y1).
- The long-term debt to assets ratio for the last fiscal year (Y1) is less than the long-term debt to assets ratio for the fiscal year two years ago (Y2).
- The current ratio for the last fiscal year (Y1) is greater than the current ratio for the fiscal year two years ago (Y2).
- The average shares outstanding for the last fiscal year (Y1) is less than or equal to the average number of shares outstanding for the fiscal year two years ago (Y2).
- The gross margin for the last fiscal year (Y1) is greater than the gross margin for the fiscal year two years ago (Y2)
- The asset turnover for the last fiscal year (Y1) is greater than the asset turnover for the fiscal year two years ago (Y2).
Posted by David Templeton, CFA at 11:44 AM 0 comments
Labels: Investments , Valuation
"The error of optimism dies in the crisis but in dying it ‘gives birth to an error of pessimism. This new error is born, not an infant, but a giant; for (the) boom has necessarily been a period of strong emotional excitement, and an excited man passes from one form of excitement to another more rapidly than he passes to quiescence.’"
Posted by David Templeton, CFA at 9:01 AM 0 comments
Labels: Economy , General Market
Posted by David Templeton, CFA at 9:14 AM 0 comments
Labels: Dividend Analysis
Posted by David Templeton, CFA at 10:22 PM 0 comments
Labels: Sentiment
Posted by David Templeton, CFA at 8:14 PM 0 comments
Labels: Dividend Analysis