Wednesday, February 28, 2007

Equity Market Declines: Keep in Perspective

Yesterday the S&P 500 Index was down approximately 3.5%. The market had gone over 900 days (almost four years) without a decline of more than 2%. As large market declines do actually occur from time to time, how would the media "headline" this market event versus prior market pullbacks.

Some of the notable headlines (highlights added):
  • At CNNMoney: Stocks rebound after Market Meltdown. The lead paragraph begins, "Stocks recovered from the previous session's brutal selloff,..."
  • At The Wall Street Journal: Lead quotes on page one of the Journal's website.
    • "The global markets plunge in stocks..."
    • U.S. stocks revived from a major selloff..."
  • At the Cincinnati Enquirer: Dow's worst day in years. China sell-off sparks 416-point plunge.
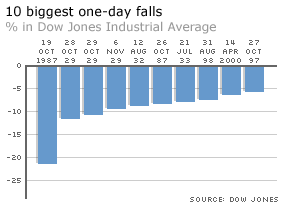
How does Tuesday's decline compare with past market selloffs? Following is a chart of a few of the largest percentage declines for the Dow Jones Industrial Average.

10 biggest Dow Jones percentage declinesSource: BBC News Online

The largest one day percentage decline occurred on Black Monday, October 19, 1987 when the Dow declined 508 points or 22.6%. Today, a similar 22.6% decline in the Dow would equal a decline of 2,772 Dow points.

Some of the headlines after Black Monday:
  • Money Managers Trying to Form New Strategies After Market Rout, Wall Street Journal, 10/20/87
  • How the Bull Crashed Into Reality, BusinessWeek, 11/2/87
It is important to keep the magnitude of market corrections in perspective. Certainly, today a one day market decline of 22.6%, 2,772 points, would appropriately be called a plunge or brutal selloff. But Tuesday's 3% decline hardly qualifies as a "plunge". Additionally, at The Big Picture web site, it is noted "the Dow Industrials have not had a 2% one-day rally in more than 500 trading days, either.”

This market has been one that has moved higher with very little resistance. A pullback or consolidation would be a healthy one. A number of key factors will determine the future direction of the market, the economy being an important one.

The magnitude of the point declines in the Dow may seem large, but it is the percentage movements that really count.


Market Pullback: Now What?

After yesterday's correction the U.S. market indices have the following approximate 12-month returns:

  • Dow Jones Industrial Average = 10.4%
  • S&P 500 Index= 8.5%
  • NASDAQ Index=5.3%
A lot of commentary is being bantered around on the various "technical" market indicators due to the 400+ drop in the DJIA and the 9% decline in the Chinese market. Let me first say it is important to evaluate the various technical indicators, but they should not be the only factors reviewed in ones investment decision process. If these various indicators were such great forecasting tools, then all investors were out of the market by the end of last week?

What is one to make of these indicators: Advance/Decline Line, ARMS index, VIX ratio, closing tick, put/call ratio, just to name a few. If you are not asking yourself about the value and meaning of these indicators--that is okay. What a high quality dividend growth investor needs to do at this point is not panic. Take this opportunity to review the investment portfolio to determine if the overall asset allocation is correct. Secondly, review individual holdings to determine whether there are stocks that have declined in value; thus, making them potentially good investments at these lower price levels. Below is a list of a few of the Dividend Aristocrats that have the worst 3-month total return.

(click on table for larger image)

worst performing dividend aristocrats February 27, 2007
At the time of this writing, the Asia/Pacific market are lower by about 3%. A summary of the indices can be found here. If the foreign markets end lower, there is a fairly high likelihood the U.S. markets will be weak on Wednesday, at least in the morning.

Now links to some of those indicators:


Tuesday, February 27, 2007

Dividend Aristocrats Hold Up Better In Market Downdraft

One reason an investor maintains the foundation of their equity portfolio in high quality companies is to successfully weather market declines like today. The Dividend Aristocrats portfolio out performed the major U.S equity market indices. After today's results, the Aristocrats are now outperforming the DJIA, S&P 500 Index and the NASDQ Index. On a year to date basis, the previously noted indices have negative year to date returns. The Aristocrats have generated a positive return of .30%.

(click on tables for larger images)
aristocrats versus indices February 27, 2007
Dividend Aristocrats performance February 27, 2007


Monday, February 26, 2007

C.H. Robinson Worldwide Added to the S&P 500 Index

Today, Standard and Poor's announced the dividend growth stock, C.H. Robinson Worldwide (CHRW), will be added to the S&P 500 Index at the close of business on March 1, 2007.
  • The company's historical 5-year dividend growth rate is 42% with the last YOY increase totaling 38%.
  • CHRW maintains an A+ S&P Earnings and Dividend Ranking.
  • The company's forward P/E of 31 compares to its 15-year high and low P/E of 43 and 21, respectively.

(click on chart for larger image)


Dividend Aristocrats Performance Update: 2.26.2007

S&P's Dividend Aristocrats underperformed the S&P 500 Index and the Dow Jones Industrial Average today. On a year to date basis the Aristocrats continue to achieve out-performance versus the Dow and S&P 500 Index.

(click on charts for larger image)

dividend aristocrat performance update February 26, 2007
dividend aristocrats performance February 26, 2007


Sunday, February 25, 2007

REITs: How Much Higher Can They Go?

Following is a chart from Chart of the Day detailing the historical performance of the NAREIT Index. REIT shares have been in a strong uptrend over the last few years (since 1970!). Are REIT valuations getting ahead of fundamentals?

Chart of the Day notes:
Over the long-term REITs (real estate investment trusts) have actually outperformed stocks. Investors appear to have caught on to this fact and have bid up REITs to new all-time highs. While today's chart illustrates that REITs are well within a long-term uptrend, REITs are currently testing resistance (red line) of a long-term trend channel.
(click on chart for larger image)


Saturday, February 24, 2007

Is the Market Turning In Favor of Large Cap Dividend Paying Stocks?

In an end of year strategy piece written by Legg Mason strategist, David Nelson, CFA, he notes large capitalization equities have been outperforming since May 2006. In fact, the Dividend Aristocrats tracked on this blog continue to achieve strong market returns so far in 2007.

(click on table for larger image)

index returns 2006 and may2006
Source: Legg Mason December Market Commentary

Legg Mason's commentary notes:
We regard the shift in leadership from small and mid cap stocks to large and mega caps as the most significant development in the equity market in 2006. We believe the performance differential between these market cap sectors since May is solid evidence that the shift has occurred. How long it will last we do not know, but if our assessment is correct, we expect it to be a period measured in years, rather than months (emphasis added).

The reemergence of mega cap stocks as market leaders has been a mixed blessing for many investment managers. One might even say that “never have so many had so little fun in a generally rising market.”The reason is that a market dominated by mega-cap stocks is a tough market for most equity managers to beat. The late 1990s—while a bonanza for equity investors as a whole—were a nightmare for portfolio managers in terms of relative performance, as few were able to keep up with the S&P 500 Index, which was being driven by the relentless advance of 25 or 30 mega caps such as Dell, Microsoft, Intel, Cisco and the like. The year just ended witnessed a similar struggle as just 19% of all actively managed U.S. diversified equity funds were ahead of the S&P 500 through December 27, 2006. This is the worst yearly aggregate relative performance showing since 1998.
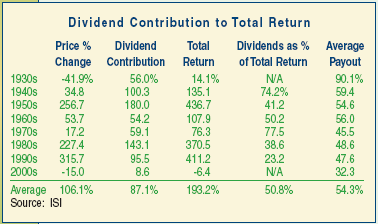
Within the large/mega capitalization portion of the equity market, high quality dividend paying equities have experienced an extended stretch of weaker total return over the last several years. As noted in the table below, the contribution of dividends to the return in the S&P 500 Index has been declining since the 1980's.

(click on table for larger image)
dividend contribution to total return S&P 500Source: Eaton Vance, February 2007

From a positive perspective, over the last four years, earnings growth for the S&P 500 companies has been increasing at a mid teens percentage growth rate. The dividend growth rate for the S&P 500 Index has been double digits, 10.8% last year, but growing at a lower rate than earnings. Standard and Poor's recently increased the anticipated dividend payment amount for for the S&P in 2007. The resulting percentage growth rate would be 11% higher in 2007 versus the 2006 dividend payment amount. Additionally, the number of companies paying a dividend has been in an uptrend since 2001.

(click on chart for larger image)

chart of number of companies S&P 500 paying dividend
One interesting dividend aspect is the payout ratio for the S&P 500 has declined to historically low levels. Currently, the payout ratio is near 30%.

(click on chart for larger image)

historical payout ratio S&P 500
One reason this has occurred is the previously noted fact that earnings are growing at a faster rate than dividends. In lieu of companies growing dividends at an even faster rate, they have resorted to initiating large stock buybacks. These large buybacks and special dividends are evidence of the strong cash flow growth for larger companies. An S&P report dated January 4, 2007 notes special dividends have surged in lieu of a higher dividend growth rate. Specials are one time payments, thus not committing the company to higher dividend payments on an ongoing basis:
Standard & Poor’s data shows that dividend extras, such as one-time dividend payments and special dividends, increased 14.3% to 622 during 2006, up from the 544 recorded in 2005. “The December surge in dividend extras was the largest since 1978. While dividends have increased slowly, extras have grown quicker since they are generally regarded as a single payment, with the company not obligated to make any additional payments,” concludes Silverblatt.
As noted earlier, earnings for the S&P 500 companies have been growing at double digit rates over the past four years; however, it appears 4th quarter 2006 earnings will come in at a growth rate of 9.9%. In an environment where earnings growth is slowing, higher quality large cap companies tend to lead market returns. The strong performance of larger cap equities since May of last year may be a sign of better returns for larger company stocks going forward.

Sources:

The Dividend Story
Eaton Vance
February, 2007
http://www.eatonvance.com/mutual_funds/dividend_story.php

Market Commentary
By: David Nelson, CFA
Legg Mason
December, 2006
http://www.leggmason.com/funds/knowledge/management/December2006MarketCommentary.pdf


Friday, February 23, 2007

Dividend Aristocrats Continue Strong Year-To-Date Performance

Standard and Poor's Dividend Aristocrats continue to generate strong performance on a year-to-date basis through February 23, 2007. The Aristocrat's YTD performance of 3.5% slightly trails the 4.1% return of the NASDAQ Index. The Aristocrats are outperforming both the S&P 500 Index and the Dow Jones Industrial Index by 1.2% and 2.0%, respectively. Maybe this is a sign that higher quality large capitalization companies will begin to achieve index beating returns. The higher quality segment of the market has been a lagging one over the last two to three years.

(click on tables for larger image)

dividend aristocrat performance comparison versus indices
dividend aristocrat year to date performance February 23, 2007


Thursday, February 22, 2007

Investor Sentiment In Bear Markets

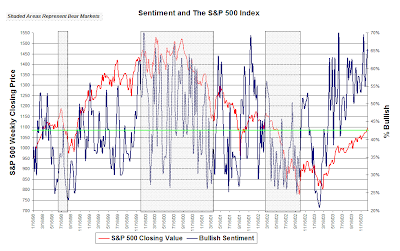
Below is a look at investor sentiment and stock market action for the period January 1998 through December 2003. The shaded areas of the chart highlight bear markets.

The long term average bullishness reading is 39%. The green line on the chart represents the average bullishness reading for the 1998 to 2003 period. The most recent bullishness reading is 53.85 and the S&P 500 Index on 2.21.2007 was 1,457.63.

(click on graph for larger image)

investor sentiment in bear marketsSource: American Association of Individual Investors


Stock Prices: Under or Overvalued versus Earnings and Moving Averages

As noted on Birinyi Associates, Inc Ticker Sense website, 80% of the S&P 500 stocks are trading above 20 and 200 day moving averages. The site contains a chart highlighting instances where this has occurred since 2001. The last time this took place was in December 2004 and the market subsequently incurred a 6% correction. However, as the chart in the Ticker Sense article notes, there have been a number of occasions between 2001 and 2004 where the market continued to move higher as 80% of the S&P 500 stocks traded above their 20 and 200 day moving averages.

In spite of a large number of the S&P 500 stocks trading at prices above 200 day moving averages, the prices have not keep pace with earnings growth. The Wall Street Journal's Market Beat section summarizes an article by Joe Keating, chief strategist at First American Asset Management, that notes stock prices have not kept pace with earnings growth. As detailed in the Wall Street summary:
  • stock price movement tends to track increases or decreases in earnings.
  • earnings have grown about 45% in the past three years compared with a 27% increase in the S&P 500 Index.
Joe Keating notes, “I see very little downside risk to the market on account of that– although I do think a 5% to 7% correction would be relatively healthy."


Sources:

Ticker Sense
February 22, 2007
http://tickersense.typepad.com/ticker_sense/2007/02/80_of_sp_500_st.html

When Prices and Earnings Don't Match Up
Market Beat
The Wall Street Journal Online
By: David Gaffen
February 22, 2007
http://blogs.wsj.com/marketbeat/2007/02/22/when-prices-and-earnings-dont-match-up/


The Bulls Stampede Ahead

This week the volatile sentiment survey from the American Association of Individual Investors shows investor's bullishness continues to move higher. As a contrarian indicator, does this suggest the market needs a little bit of a breather?

(click on charts for larger image)

investor sentiment survey February 22, 2007


Wednesday, February 21, 2007

Allstate, Nucor, Nordstrom and Sherwin-Williams Announce Dividend Increases

A number of companies/dividend growth stocks announced dividend increases today.
  • Allstate (ALL): 8.6% increase. The quarterly dividend increases to 38 cents per share versus 35 cents per share in the same quarter last year.
  • Nucor (NUE): 10% increase. The quarterly dividend increases to 11 cents per share versus 10 cents per share in the same quarter last year.
  • Nordstrom (JWN): 28.6% increase. The quarterly dividend increases to 13.5 cents per share versus 10.5 cents per share in the same quarter last year.
  • Sherwin-Williams (SHW): 26% increase. The quarterly dividend increases to 31.5 cents per share versus 25 cents per share in the same quarter last year.
(click on tables for larger image)dividend analysis Allstate Nucor Nordstrom Sherwin-Williams
stock charts Allstate Nordstrom Nucor Sherwin-Williams


Tuesday, February 20, 2007

S&P Dividend Aristocrats Trading Below 52-Week High

Following are the ten dividend Aristocrats that trade the furthest below the stock's 52-week high. The table also displays the stock's dividend yield and its 5-year average yield.

(click on table for larger image)

dividend aristocrats below 52 week high


Monday, February 19, 2007

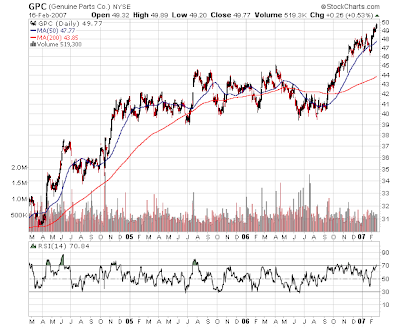
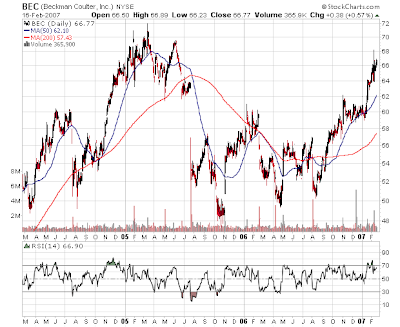
Genuine Parts and Beckman Coulter Increase Dividends

Genuine Parts Company (GPC) and Beckman Coulter (BEC) both announced dividend increases as detailed below.

In the case of Genuine Parts, this is GPC's 51st consecutive annual dividend increase. GPC's 8.1% dividend increase is nearly in line with the company's 2007 YOY estimated earnings growth of 10%.

For Beckman Coulter, the 6.7% dividend increase is one-half the company's 2007 YOY estimated earnings growth of 13%.

(click on charts for larger image)

Genuine Parts Beckman Coulter dividend table
Genuine Parts stock chart
Beckman Coulter stock chart


Asset Allocation: AAII January 2007

On a monthly basis the American Association of Individual Investors members are able to submit their asset allocation information. The asset allocation summary for January 2007 is detailed below. The highest stock weighting since November 1987 occurred in January 2000 with AAII investors reporting 77% allocation to stocks and stock mutual funds.

(click on chart for larger image)


Sunday, February 18, 2007

Dividend Aristocrats Continue Outperformance

Standard and Poor's Dividend Aristocrats continue to outperform the Dow Jones Industrial Average, the NASDAQ and the S&P 500 Index through February 18, 2007.

(click on tables for larger image)

aristocrats performance summary
dividend aristocrats performance detail


Saturday, February 17, 2007

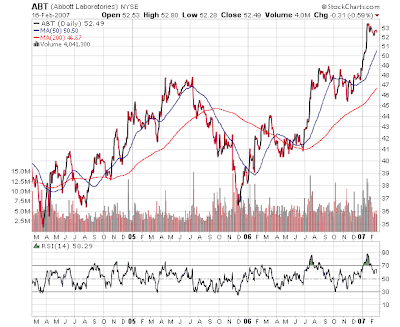
Abbott Laboratories Announces 10.2% Dividend Increase

Yesterday, Abbott Laboratories (ABT) announced a 10.2% increase in its quarterly dividend to 32.5 cents versus 29.5 cents in the same quarter last year. ABT's historical 5-year dividend growth rate is 6% as a result the recent increase represents an acceleration in the dividend growth rate. The projected payout ratio on 2007 earnings estimate of $2.81 is 46%--essentially in line with the 5-year average payout ratio.

(click on charts for larger image)
Abbott Labs dividend analysis
Abbott Labs stock chart


Friday, February 16, 2007

Compass Bancshares Being Acquired in $9.6 Billion Deal

Dividend Aristocrat Compass Bancshares (CBSS) to be acquired by Spain's Banco Bilbao (BBV) in a transaction to be valued at $9.6 billion.
  • The deal is a 16.3 percent premium over Compass' closing stock price of $61.78 Wednesday on the Nasdaq Stock Market.
  • Compass shareholders can choose to receive either 2.8 Banco Bilbao American depository shares or $71.82 in cash per Compass share.
  • The deal is expected to close in the second half of the year, subject to customary closing conditions including necessary bank regulatory approvals in the U.S. and Spain and the approval of the stockholders of both Compass and Banco Bilbao.


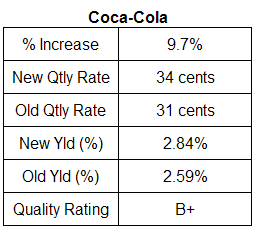
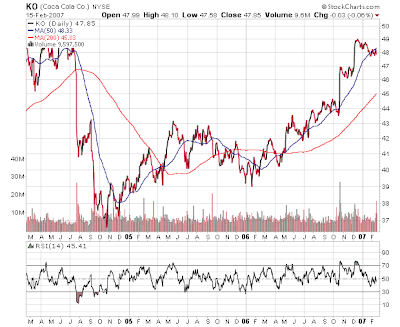
Coca-Cola Announces 9.7% Dividend Increase

Yesterday, Coca-Cola (KO) announced a 9.7% increase in the company's 1st quarter 2007 dividend to 34 cents per share versus 31 cents per share in the same quarter last year. This represents the 45th consecutive annual increase in the company's dividend. The projected payout ratio on 2007 estimated earnings of $2.56 is 53%. The compares to the 5-year historical average payout ratio of 49%.

(click on charts for larger image)
Coca-Cola dividend analysis
coca-cola stock chart


Thursday, February 15, 2007

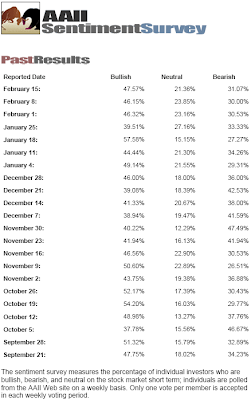
Investor Sentiment For 2.15.2007 Essentially Remains Unchanged

The American Association of Individual Investors Sentiment Survey for the period ending 2.15.2007 remains essentially unchanged. Both bullishness and bearishness have increased slightly.

(click on table for larger image)

AAII Sentiment SurveySource: American Association of Individual Investors


Wednesday, February 14, 2007

Diebold Increases Dividend 9.3%

Today, Diebold (DBD) announced a 9.3% increase in its quarterly cash dividend to 23.5 cents per share versus 21.5 cents per share in the same quarter last year. This is the 54th consecutive year the company has increased its annual dividend. The 5-year average dividend growth rate is 7%. The payout ratio, based on estimated 2007 earnings of $2.31, equals 41%. The historical 5-year average payout ratio totals 35%.

(click on charts for larger image)

Diebold Dividend Analysis
Diebold Stock Chart


Tuesday, February 13, 2007

Dividend Aristocrats Outperforming Year-to-Date

On a market cap weighted basis, Standard & Poor's Dividend Aristocrats are outperforming the NASDAQ, Dow Jones Industrial Average and the S&P 500 Index year-to-date through February 13, 2007.

(click on tables for larger image)

Aristocrat performance summary
Standard and Poors Dividend Aristocrats Performance


Suntrust and Sigma-Aldrich Increase Dividends

Today, Suntrust (STI) announced a 19.6% increase in its quarterly dividend to 73 cents per share versus 61 cents per share in the same quarter last year. The 5-year average dividend growth rate is 9%. The estimated payout ratio based on 2007 estimated earnings of $6.62 equals 44%. The 5-year average payout ratio is 38%.

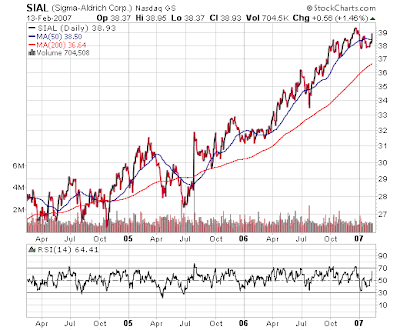
Sigma-Aldrich (SIAL) also announced a 9.5% increase in its quarterly dividend to 11.5 cents per share versus 10.5 cents per share in the same quarter last year. The estimated payout ratio on 2007 earnings of $2.16 will be 21%. The 5-year average payout ratio equals 20%.

SIAL reported the company has repurchased 80 million shares of its stock since late 1999. The company has 132 million shares outstanding. SIAL indicated it has an additional 10 million shares to repurchase.

(click on charts for larger image)

Suntrust and Sigma-Aldrich dividend analysis
Suntrust stock chart
Sigma-Aldrich stock chart


Monday, February 12, 2007

3M Announces 4.3% Increase in Quarterly Dividend

Today, 3M (MMM) announced a 4.3% increase in the company's quarterly dividend. The first quarter 2007 quarterly dividend was increased to 48 cents per share versus 46 cents per share in the first quarter of 2006. The estimated payout ratio for 2007 essentially remains unchanged from the 2006 payout at 41%.

At the end of January, MMM reported 4Q earnings of $1.10 per share (excluding one time gain on sale of the pharmaceuticals business) that missed consensus estimate of $1.14. Total earnings for 2006 equaled $4.49 and 2007 estimate equals $4.68.

3M dividend analysis table
(click on chart for larger image)

3M stock chart


REIT Valuations Maybe Extended

In an article from Bloomberg, a number of investment managers note the stretched valuation of REITs. Buyer beware.
"Sam Zell is probably the shrewdest operator in this field that there is,'' said David Dreman, who oversees $21 billion at Dreman Value Management LLC in Jersey City, New Jersey. ``If he's selling, I don't think I want to be a buyer."

Institutional investors with $11.9 trillion in assets have been net sellers of REITs since November, according to the brokerage arm of Boston-based State Street Corp. Shareholders sold as dividend yields on the trusts tumbled below those of government debt.

The average yield of U.S. REITs tracked by the National Association of Real Estate Investment Trusts, or NAREIT, fell to 3.78 percent at the end of January. That was 1.03 percentage point less than the 10-year Treasury note, the biggest discount since 1985, according to data compiled by Bloomberg.

Dividend yields on REITs have plummeted as share prices boomed. The NAREIT index of 179 U.S. property trusts has posted a total return of 348 percent this decade, for an average annual return of 23 percent in the past seven years. The S&P 500 has averaged a 1.1 percent return, including dividends, in that time.

U.S. REITs tracked by the Leuthold Group last month traded at an average of 18.8 times adjusted funds from operations. That's the highest since at least 1997 and almost 50 percent more than the average for the past decade, according to the Minneapolis-based research and investment firm, which counts two- thirds of the 100 largest U.S. money managers as clients.

Source:
MFS, Deutsche Bank Dump REIT Shares Amid Record Blackstone LBO
By: Michael Tsang and Daniel Hauck
Bloomberg
February 12, 2007
http://www.bloomberg.com/apps/news?pid=20601087&sid=a5sgh4AX1qNY&refer=home


Saturday, February 10, 2007

Stocks versus Bonds

As I outline the factors one considers when deciding what percent of their investments are allocated to stocks, bonds and cash, I am making the assumption readers know what these broad investment classes consist of. For those that want to read more on the investment classes, click this link.

As one determines how their investments should be allocated, several factors need to be taken into consideration:
  • The investment objective for the funds. Establishing the investment objective for the investments enables one to pinpoint a time horizon. Are the funds needed near term for an upcoming purchase or are the funds being accumulated for retirement.
  • The time horizon for the investments. Will the funds need to be withdrawn in five years, ten years, fifteen years or a longer period of time? Generally, the longer ones time horizon, the more likely one can invest in assets, such as equities, that fluctuate (volatility) in value by a larger amount.
  • Ones risk tolerance. This determines the level of volatility one is comfortable being exposed to. Investments with potentially higher returns tend to exhibit wider fluctuations in value in the short run.
  • Ones personal preferences and constraints and any tax, legal, or regulatory issues.
  • And lastly, rate of return target.
Once the above factors have been addressed, an investor can determine the appropriate type of investments for their portfolio. At this point, I will focus on the question of stocks or bonds.

First, let's look at the income component of stocks and bonds. Let's say an investor purchases a 10-year treasury bond and holds it until maturity. Today, the investor would earn 4.78% on a before tax basis. In the case of treasuries, these investments are exempt from state taxation. Going forward in this analysis, I will exclude the impact of state tax rates on the various investments.

Continuing with the treasury example, the investor would earn 4.78% per year over the next 10-years. If the investor is in the 35% tax bracket, the amount the investor retains--after tax--of the 4.78% is (4.78% * (1-tax rate)) or 2.91%. The other important component that needs to be considered is the rate of inflation. Inflation will erode ones purchasing power. The current core rate of inflation (this excludes food and energy components) is 2.6%. As a result, after tax and after inflation, the 4.78% becomes .31%. Not much of a return.

The dividend yield on stocks, that is, the S&P 500 Index is currently 1.8%. At this point, qualifying dividends are taxed at 15%; therefore, the after tax yield on the dividend income is 1.53%. After 2.6% of current inflation, the return would be negative.

Is this an accurate comparison? When investing in stocks, dividends simply represent a portion of the company's earnings that are paid out to shareholders.

(click on table for larger image)


So reevaluating the stock analysis, let's look at the earnings yield of the S&P 500 Index. The earnings yield is the inverse of the price to earnings ratio. The forward PE for the S&P 500 Index is approximately 16. The inverse, or earnings dividend by price, equals 6.25%. On a worst case basis, let's assume there isn't a dividend tax advantage and reduce the earnings yield by the 35% tax rate. The after tax earnings yield would equal 4.06%. We would not reduce this by the Consumer Price Index. Why?

As noted in an article by Donald Luskin, titled Stocks vs. Bonds: Stocks Win:
But where stocks really shine is as protection against inflation. It's far from exact, but generally speaking corporate earnings should grow with inflation. If a company sells apples, and the price of apples goes up by 30% over 10 years because of inflation, you can be pretty sure that the company's earnings will go up 30% too, all else equal.
With stocks then, on an after tax after inflation basis, the stock yield is 4.06% while the bond yield is .31%.

When answering the question of stocks versus bonds, one must also consider the potential volatility or market value fluctuation of the investment. Knowing the investment time horizon is a critical element in answering stocks or bonds.

In an article by Shawn Allen of InvestorsFriend Inc., titled Are Stocks Really Riskier Than Bonds?, he notes:

When it comes to long-term investors, virtually the entire investment community is focused on the wrong definition of risk. Much of what is written about risk is at best inappropriate and at worse completely wrong for a long-term investor. This is caused by an over emphasis on short-term volatility.

For long-term investors we need to have a proper definition of risk. Financial academics and the investment community generally define risk as the short-term (annual, monthly or daily)
volatility of returns from an investment. The volatility of returns is measured by variance or standard deviation.

From the perspective of a long-term investor, this definition of risk is flawed for two reasons:

1. The analysis and conclusions almost always focuses on the volatility of annual (or even monthly or daily) returns. An annual focus might be appropriate for many investors, but long-term investors should be mostly concerned about risks associated with their long-term wealth level and not primarily focused on the bumps along the way.


2. The analysis and conclusions are almost always based on nominal returns and ignore the
erosion of purchasing power caused by inflation. For short term investors, inflation may not a be a big concern but it has a huge impact in the long-term.

As to the second point above, it seems self evident that better conclusions will be reached using real (inflation adjusted) returns rather than nominal returns.

As to the first point above, under the annual volatility definition of risk, stocks are considered much more risky than long-term Bonds or Treasury Bills. Yet, it is a fact that stocks have significantly outperformed both Bonds and T-Bills over 30 year periods. In each and every 30 year "rolling window" from 1926 - 1955 through to 1975 - 2004, stocks have provided a higher (after inflation) return. But due to higher annual volatilities, stocks are considered more risky! To avoid risk (annual volatility) you are advised to put some money into Bonds or T-Bills which in fact are almost guaranteed to under perform stocks in the long run. This kind of thinking on risk is hazardous indeed to your long-term wealth. (That is, if your goal is wealth maximization at some distant point like 20 or 30 years in the future, as it is for many investors).
(click on charts for larger image)


Certainly over long time horizons, stock volatility is lower than volatility in the short term. Additionally, stocks provide a better opportunity to generate after tax returns that out pace inflation. One advantage of bonds is they can dampen the short term volatility of an investment portfolio. In the end, the investor must be comfortable with the investment portfolio they establish.

Source:
Stocks vs. Bonds: Stocks Win
By: Donald Luskin
Ahead of the Curve
SmartMoney.com
June 17, 2005
http://www.smartmoney.com/aheadofthecurve/index.cfm?story=20050617

Are Stocks Really Riskier Than Bonds?
By: Shawn Allen, CFA, CMA, MBA, P.Eng.
InvestorsFriend, Inc.
Januray 28, 2007
http://www.investorsfriend.com/stocksriskierthanbonds.htm

The Dow: Support and Resistance

As of late, most equity markets around the world have generated relatively strong returns. A question I often receive is what amount of ones portfolio should be invested in bonds versus stocks. The answer to this question varies for each investor depending on time horizon, risk tolerance, cash needs from a portfolio, etc. Later today, I will post a comment on the topic of stocks versus bonds.

In the interim, below is a recent chart from Chart of the Day going back to 2003 that graphs the the Dow with support and resistance lines. Chart of the Day notes:
Despite a host of concerns (weakening economy, softening housing market, geopolitical issues, etc.), the Dow continues to trade near record highs. However, it should be noted that the Dow is not yet in the clear as the Dow currently trades at the top of the three-year trading channel (see red line). Stay tuned...
(click on chart for larger image)

Dow Jones Index Chart: 2003-2007Source: Chart of the Day, Dow Jones


Friday, February 09, 2007

Intentionally Defective Grantor Trusts

An intentionally defective grantor trust (IDGT) is a grantor trust for income tax purposes, but a completed gift for estate and gift tax purposes. This tax strategy manages to reduce both gift and estate taxes through a so-called estate freeze. Although this estate planning technique has been available as a planning tool for sometime, IDGTs have become more popular recently due to the relatively low interest rate environment. In establishing an IDGT, an individual sells to the trust an asset such as, stock, closely held or family business interest, real estate or limited partnership interest in a family limited partnership, at the assets fair market value in return for an installment note.

According to Mark Stone of Margolin, Winer and Evens LLP, 

a sale to the IDGT is not recognized for income tax purposes because the grantor and the trust are treated as the same entity. This treatment is based on the conclusion in Revenue Ruling 85-13, which was subsequently reaffirmed in PLR 9535026. The grantor in this PLR sold assets to an IDGT in exchange for a 20-year promissory note. In addition to concluding that the sale is not recognized for income tax purposes, the PLR concluded that the trust purchasing the assets would assume the respective grantor’s basis in those assets transferred. Because the sale in the PLR was consummated with a note, the PLR also concluded that the interest component of the note had no income tax consequence to either the payer or the payee.

...the grantor will not recognize any gain on the sale. As a grantor trust, the grantor will be responsible for paying income taxes on the trust’s activity. The grantor is responsible for this tax liability because of a legal obligation imposed by statute under Section 671. The grantor’s payments of tax on the trust income not only will satisfy the grantor’s legal obligation, but will provide another form of a "tax-free gift" to the trust’s remainderman beneficiaries. This treatment presents the grantor tremendous planning opportunities, since the trust’s assets will not be depleted by taxes.
To illustrate the tax planning opportunity afforded in this scenario, let us assume a taxpayer makes a one-time gift of $1 million to a trust that earns a 9 percent taxable return and that the taxpayer is subject to a 40 percent effective tax rate. Based on these facts, the trust would earn $90,000 of income in year one and accrue a tax of $36,000. Upon payment of this income tax, the grantor’s estate tax liability would be reduced by $18,000 ($36,000 x 50%) in the first year, with comparable savings available to the grantor’s estate in subsequent years. This is in addition to the estate tax reduction of the initial $1 million gift.
In some instances, the grantor may not have the desire or financial resources to pay the income taxes. If either of these conditions exist, the trust may provide the trustee of the defective trust the discretion, but not the obligation, to remit a tax reimbursement payment for any taxes paid by the grantor on income generated by the trust.
A risk of establishing an IDGT is the asset in the trust underperforms the Applicable Federal Rate (AFR). The AFR is the rate established for the note. The result could be the grantor needs to repay the note and pay the interest, otherwise the asset sale is recharacterized as a gift.

There are securities laws considerations as well. Some assets, such as holdings in private equity securities, are not eligible due to restrictions in limiting the sale of investments to qualified purchasers or accredited investors. A trust also needs $5 million in assets or a qualified bank trustee to meet this requirement according to Everett P. Ingalls of Pierce Atwood LLP.

A number of additional factors must be considered when evaluating the appropriateness of establishing an IDGT. Before establishing an IDGT, an individual must consult their legal and/or accounting advisors. More detail can be found in an article published in the Journal of Financial Planning at this link.

Source:
The IDGT: The Effective Defective Grantor Trust
FPA Journal
By: Mark Stone, CPA, PFS, CFP, MST
September, 2002


Thursday, February 08, 2007

Investor Sentiment: 2.8.2007

The American Association of Individual Investors sentiment survey results are essentially unchanged for the period ending 2.8.2007.

(click on table for larger image)

investor sentiment survey February 8, 2006


Wednesday, February 07, 2007

L-3 Communications Announces 33% Increase In First Quarter Dividend

Yesterday, L-3 Communications (LLL):

a company that provides intelligence, surveillance, and reconnaissance systems; secure communications systems; aircraft modernization; training; and government services. The company operates through four segments: Command, Control, Communications, Intelligence, Surveillance and Reconnaissance; Government Services; Aircraft Modernization and Maintenance; and Specialized Products,
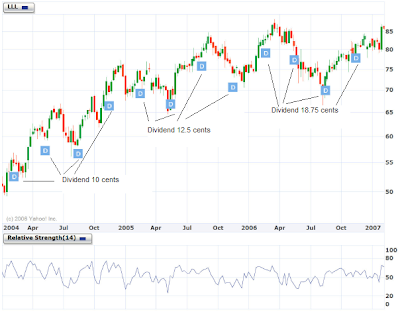
announced a 33% increase in its first quarter 2007 quarterly dividend. The dividend has been increased to 25 cents per share versus 18.75 cents per share in the same quarter last year.

L-3 Communications is not a true dividend growth stock as the company initiated dividend payments in the first quarter of 2004. LLL is the type of company an investor might consider evaluating if the investor is looking to invest in firms that have the capability to pay a dividend. Although LLL was a non-dividend payer in 2003, the company was a part of a sector that appeared to offer potentially good returns in 2003, i.e., the defense industry.

(click on charts for larger image)
L-3 Dividend Analysis
L-3 Stock Chart


Tuesday, February 06, 2007

Wm. Wrigley Jr. Co. Announces 13.7% Dividend Increase

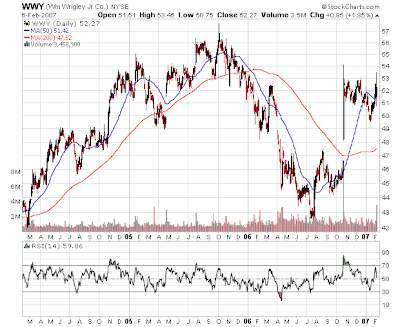
Today, Wm. Wrigley Jr. Co. (WWY) announced a 13.7% increase in its quarterly dividend. The new quarterly rate increases to 29 cents per share versus 25.5 cents per share in the same quarter last year. As reported by Bloomberg,

"...net income jumped 37 percent to $128.8 million, or 46 cents a share. Excluding costs to close plants in Chicago and New Jersey, the company said today it earned 51 cents, beating the 50-cent average estimate of 13 analysts in a Bloomberg survey."


WWY is one of Standard and Poor's Dividend Aristocrats with an S&P Earnings and Dividend Ranking of A+.

(click on charts for larger images)
Wrigley dividend table
wrigley stock chart


Cincinnati Financial Announces 6% Dividend Increase

Yesterday Cincinnati Financial Corp. (CINF) announced a 6% increase in the company's quarterly dividend. The quarterly dividend increases to 35.5 cents per share versus 33.5 cents per share in the same period last year. The 6% increase is lower that the 5-year average dividend growth rate of 13%. CINF is one of Standard and Poor's Dividend Aristocrats.

(click on on charts for larger image)

cincinnati financial dividend table analysis
cincinnati financial chart