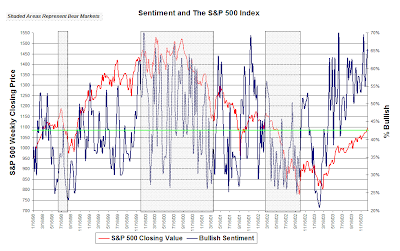
Below is a look at investor sentiment and stock market action for the period January 1998 through December 2003. The shaded areas of the chart highlight bear markets.
The long term average bullishness reading is 39%. The green line on the chart represents the average bullishness reading for the 1998 to 2003 period. The most recent bullishness reading is 53.85 and the S&P 500 Index on 2.21.2007 was 1,457.63.


No comments :
Post a Comment