Monday, June 30, 2014

An Investor's Time Frame Should Weigh Heavily On Expected Returns

I wrote a post a few days ago that highlighted the 10-year annualized returns for the U.S stock market and the MSCI World Index. The summary of the article and the chart was the 10-year annualized market returns remain below their long term averages. A number of our articles are published on SeekingAlpha as was the one just mentioned. One comment to the SeekingAlpha article raised the question that the real returns may display a different result. In short though, the real versus nominal returns, on a ten year time frame, were not vastly different as can be seen in the below chart.

From The Blog of HORAN Capital Advisors

I believe a part of what has investors concerned about the current market at this time is the strength of the market's recovery since the depth of the financial crisis in 2008 and 2009. Additionally, the recent market advance has occurred nearly on an uninterrupted basis, i.e., without a significant correction. The strength of the recent market move is evident in the below chart that looks at the 5 year annualized return for the S&P 500 Index going back to 1926. On this shorter time frame, the rolling 5 year annualized return is far above the average of all the five year returns.

From The Blog of HORAN Capital Advisors

Certainly important economic data released recently raises questions about the sustainability of the current economic recovery. As cliche as it may be, we to believe the weather experienced across the U.S. in the first quarter of 2014 was a major contributor to the weaker GDP report released last week. In the event we are wrong about the weather influence in Q1 reports, as an investor, if you have a longer term time horizon, the 10-year chart would suggest the market is in for further highs on this ten year time frame. For investors with a shorter time horizon, an equity market pullback should not be a surprising occurrence; therefore, a expectations should be set accordingly. To this point though, and as we highlighted in one of our weekend magazine articles by Aswath Damodaran, Ph.D, a Professor of Finance at the Stern School of Business at New York University,he wrote an article about market valuation and concluded market timing can be a difficult endeavor.


Sunday, June 29, 2014

Week Ahead Magazine: June 29, 2014

After a much worse than expected final GDP report last week, the upcoming shortened trading week will be filled with potential market moving economic news. With the markets closed on Friday, Thursday morning investors will receive both the employment report and the jobless claims report. Both of these reports have marketing moving potential. Other key reports this week:
  • Chicago PMI and Pending Home Sales (M)
  • Manufacturing PMI, ISM Manufacturing Index and Construction Spending (T)
  • ADP Employment Report and Factory Orders (W)
  • Employment Situation Report, Jobless Claims and International Trade (Th)
One interesting article contained in this week's magazine was written by Aswath Damodaran, Ph.D, a Professor of Finance at the Stern School of Business at New York University. The article, Bubble, Bubble, Toil and Trouble: The Costs and Benefits of Market Timing, provides detail around using financial metrics to determine whether the market is in a bubble or not. One of his conclusions,
"On a personal note, I have never found a metric or metrics that allow me to have the combination of conviction that a bubble exists, that the correction will be large enough and/or that the correction will happen within a reasonable time frame, to be a market timer. Hence, I don't try! You may have a better metric than I do and if it yields more conclusive results than mine, you should be a market timer."
So, as the holiday trading week begins enjoy some article links in this week's magazine below.


Saturday, June 28, 2014

Gasoline Pump Prices May Be Key To Sustainable Economic Growth

For those that drive a car, they are certainly feeling the effects of higher gasoline pump prices versus four or five years ago. As the below chart shows, however, average gasoline pump prices have been on the decline (barely) since the beginning of 2011. This attempted decline, or at least stabilization, is occurring in an environment where the price of a barrel of crude oil is trending higher. The significance of oil price inflation is the fact only one recession was not preceded by, or coincident with a rise in oil prices. We highlighted the significance of oil prices in our post, Signs Are Not Pointing To A Double Dip Recession Yet, in July of 2010.

From The Blog of HORAN Capital Advisors

Since 2008 the pump price that seems to be one that can trip up the equity market is around $4.00 per gallon as is evident in the below chart.

From The Blog of HORAN Capital Advisors

Although pump prices have been volatile since 2011, the per gallon price trend does appear to be moving lower. As politicians on both sides of the aisle so often do, they cannot resist raising taxes. Just about a week ago a bipartisan Senate proposal is recommending raising the federal gasoline tax by 12 cents and indexing it to inflation. With the $4.00 level being a critical one, this proposal seems like one that could tip the scale of the economy towards a recession for sure.

Lastly, higher gas prices do impact retail sales. If one looks carefully at the below chart, as the price of a gallon of gas has neared $4.00 per gallon, retail sales seemed to spike dip lower. With consumers accounting for 70% of GDP or the economy, a higher gas tax does not seem to be a sound policy decision at this point in time in my view.

From The Blog of HORAN Capital Advisors


10-Year Annualized Equity Returns Remain Below Average

Franklin Templeton Investments published recent commentary on their positive view of equities both in the U.S. and in Europe. The entire article is a worthwhile read; however, one chart included in the write up was the one below showing 10-year annualized returns going back to 1825. As the chart shows, in spite of the strong bull market in equities around the world send the bottoming of the financial crisis in 2009, the compounded 10-year annualized return remains pretty far below average.

From The Blog of HORAN Capital Advisors

The market's recovery since the end of the financial crisis seems to have occurred almost without any significant pullback. As the above chart shows though, a pullback or correction would not be an uncommon occurrence. However, timing the market is difficult and technically speaking, further highs in equities seem more likely than not. A key to further equity market strength will be positive developments on the economic front. The coming shortened trading week will see a large number of economic reports release that should shed some light on the state of the U.S. economy.


Thursday, June 26, 2014

Corporate Cash Is King

Earlier this week Factset Research (FDS) released their Cash & Investment Quarterly for the S&P 500 Index covering the first quarter. Notable was the near 46% growth on a year over year basis in shareholder distributions (dividends plus buybacks) totaling $193.8 billion. The report also notes share repurchases alone were higher by 50% in the first quarter.

From The Blog of HORAN Capital Advisors

Other notable highlights from the report:
  • "Aggregate Cash Grew 7%: The S&P 500 (ex-Financials) cash and marketable securities balance grew 6.6% year-over-year to a balance of $1.34 trillion at the end of Q1. However, cash declined sequentially by 4.7%, primarily as a result of Verizon Communications (VZ) closing its acquisition of the remaining stake of Verizon Wireless."
  • "Free Cash Flow Grew 9%: Cash flows from operations amounted to $282.0 billion in Q1, which marked an increase of 7.4% year-over-year. Free cash flow to equity increased by 8.7%."
  • "Capital Expenditures Grew 6%: Capital expenditures (“CapEx”) accelerated growth to 6.2% in Q1. In the past four quarters, growth had not exceeded 1.5%. Analysts project that the 2014 growth rate for CapEx will be 6.7%, but also predict it will turn negative in 2015 (-1.2%)"
  • "Net Debt Issuance Positive for Fifteenth Straight Quarter: Cash inflows from net debt issuance were positive for the fifteenth straight quarter. Inflows of $74.1 billion were the second highest quarterly amount over that period."
The growth in capital expenditures is noteworthy as it does not include expenditures that are attributable to acquisitions. The entire report is worth evaluating as it provides insight into the cash generating capability of companies in Q1 in spite of the weakness that is being blamed on the winter weather.

Disclosure: Long VZ


Sunday, June 22, 2014

Week Ahead Magazine: June 22, 2014

Last week continued to see equity markets in the U.S. move higher. All major U.S indices were higher by greater than 1% on the week with the Russell 2000 (small cap) advancing 2.2%. This advance has continued in spite of the often cited complacency evident in the market, vis-à-vis the low level of the VIX, and the lack of a meaningful correction over the past few years. As we noted in a post earlier this week, we do believe the market has entered the "denial stage" from a sentiment perspective.

As our clients know, we eliminated small cap exposure in November of last year due to valuation concerns. And in spite of the strong advance for small company stocks this week, and it has occurred on lower volume, we continue to believe the recent small cap strength is more of a technical bounce than a longer term move higher. As the below chart of the Russell 2000 ETF (IWM) shows, the index is approaching resistance around the 120 level. Additionally, a number of technical indicators like the MACD and stochastic indicators suggest small caps are over bought and may be due for a further move to the downside. Similar technical comments could be made for the S&P 500 Index; however, large cap valuations are not at the stretched level as are small caps.

From The Blog of HORAN Capital Advisors

From an economic data perspective this week, focus will be placed on the final GDP reading on Wednesday. The second reading last month saw GDP for the first quarter revised lower to a negative 1.0%. The consensus estimate for the final reading on Wednesday is -1.8% with a low estimate of -2.4%. Much of the first quarter weakness has been blamed on the severe weather across the U.S this winter.

One article we link to in our week ahead magazine contains a discussion on S&P 500 earnings for the balance of the year. The summary of the article is earnings are improving and accelerating for S&P 500 companies. The article references Factset and Thomson Reuters data relative to S&P 500 earnings estimates, which we follow as well, and the article notes,
  • The year-over-year growth rate of the forward estimate is now 8.60%, once again at a new multi-year high, after dipping slightly last week. The forward growth rate hasn’t been this high since January 13, 2012 when it was 9.4%.
  • ...just looking at the revisions and forward estimates around SP 500 earnings. The fact is, despite the negativity, S&P 500 earnings are growing at mid to high single digits, and starting to improve.
  • For all practical purposes, with the SP 500 at 16(x) forward earnings, and with it becoming increasingly likely that SP 500 earnings growth could hit 10% (easily) this year, p.e expansion to 20(x) that forward estimate wouldn’t be a stretch.
  • John Butters of Factset and now Gregg Harrison of ThomsonReuters have started to write about the lack of downward pressure on the q2 ’14 expected earnings growth rate of 6.6%. That same q2 ’14 estimated growth rate was +8.5% on April 1, 2014.
Certainly, if "feels" as though the market is overdue for some type of correction. However, we know corrections do not occur because they are overdue. A trigger is needed. Ryan Detrick wrote an article on See It Market today, Is Market Sentiment Signaling A Major Peak In Equities?, that provides good insight into market sentiment at this point in the market cycle. Additionally, we do believe company fundamentals are supportive of further stock gains through the balance of the year; however, a pullback would not be a surprise. Below is the link to this week's Week Ahead Magazine that contains articles we hope you find of interest this week.


Friday, June 20, 2014

VIX Is Low But Investors In Denial Stage Of Market Sentiment Cycle

Many of the market statistics that measure investor sentiment suggests investors have become too complacent regarding this bull market. Strategist view this complacency as a contrarian indicator which raises a cautionary flag regarding further advances in the equity market. With the VIX Index trading at a record low level under 11, this index does indicate there is a low level of fear in the market. More detail on the VIX can be reviewed at one of our earlier posts, What Is The VIX Index.

From The Blog of HORAN Capital Advisors

Importantly for investors is the fact the VIX Index can trade at low levels for a multi-year time period as the above chart shows occurred from 2005 to early 2007.

Another sentiment measure that attempts to incorporate anticipated economic activity is to divide the VIX level by the 10-year treasury yield. We discussed this in a November 2011 post, Fearful Investors. A low level in the 10-year treasury yield indicates bond investors generally have an anemic growth and inflation outlook over the longer term. Looking at this indicator it to has reached a current low level of 4.05. However, as with the VIX, this indicator can trade at a low, if not lower level for an extended time period as well, 2005 - 2007.

From The Blog of HORAN Capital Advisors

So what does this all mean for investors. At HORAN we certainly do believe, or maybe better stated, "feel" as though a correction would be good for this market. We do believe if a correction occurs it will be a short lived one absent an unanticipated shock to the market. Inflation, CPI, was reported at a higher than expected level on Tuesday. If inflation continues to surprise to the upside, it will likely be driven by higher commodity prices and higher wage rates. This would generally occur with an economy that is strengthening. The result would be higher earnings growth for companies, which is needed based on Q1 earnings. The higher growth rate would likely lead to higher stock prices as well. To be certain though, the market does not move higher in a straight line. Our belief though is the market is at a greater risk of moving higher through year end than moving into a sustained downtrend.

Lastly, we do look at these sentiment readings in the context of the overall sentiment cycle. In a July 2009 post, Where Are We In The Market Cycle?, we included the below chart.

From The Blog of HORAN Capital Advisors

The above sentiment cycle chart was first published in 1991 by technical analyst Justin Mamis in a book titled, The Nature of Risk. We believe we are most likely in the "denial" phase of the sentiment cycle. We do not believe full confidence or enthusiasm has returned to this market. This week's Investor Sentiment Survey reported by the American Association of Individual Investors saw bullish sentiment fall 9.5 percentage points to 35.2%. The less volatile 8-period moving average is 34.7% and is not an overly bullish reading as can be seen in the below chart.

From The Blog of HORAN Capital Advisors

Given the amount of chatter about the need for a correction, a capitulation type buying frenzy seems not to have occurred yet.


Thursday, June 19, 2014

Companies Continue With A Heightened Focus On Share Buybacks

S&P Dow Jones Indices' preliminary report on first quarter 2014 share buybacks shows companies have not shied away from buying back shares in spite of record market highs. On a year over year basis buybacks increased 59% to $159.28 billion versus $99.97 billion in Q1 2013. Combining the buyback amount with the dividends paid, on a YOY basis the combination increased 41%. The buyback leader in the first quarter is Apple (AAPL), buying back $18 billion which set an S&P 500 Index record. Additionally, S&P Dow Jones Indices notes the technology sector dominated in buybacks by representing 30.9% of all buybacks in the quarter. Howard Silverblatt, Senior Index Analyst for S&P Dow Jones Indices noted in the S&P report,
  •  "The lower share count pushed up earnings per share significantly (defined as a 4% impact) for 99 issues in the S&P 500, with the Q1 poster child being Apple."
  • "The key question for Q2 is did they do it to boost a poor Q1 earnings period that was impacted by weather conditions, or was it a shift towards more enhanced earnings via share count reduction, similar to what we experienced in 2006 and 2007?"
From The Blog of HORAN Capital Advisors

Disclosure: Family long AAPL


Sunday, June 15, 2014

Week Ahead Magazine: June 15, 2014

The second trading week of June saw most U.S. broad market indices down less than 1% on the week. Only the Russell 2000 small cap index has a year to date negative return of -.1%. As the below chart of the "weekly" S&P 500 Index shows, the market has been in a strong uptrend since late 2011. Missing from the advance this year is significant volume during up weeks for the market. This seems to be indicative of investor skepticism about the market's continued advance without a 10+% correction which last occurred mid year 2011.

From The Blog of HORAN Capital Advisors

Last week's economic reports were mostly favorable. Instead of looking at the monthly data point, investors seem to look at April and May together due to the weather impact in the first quarter. An example is the May retail sales report came in below expectations; however, April's number was revised higher. Business inventory for April was higher than expected at .6% and will contribute favorably to second quarter GDP. According to Econoday, sales exceeded the inventory build keeping the inventory to sales ratio at a "lean 1.29." The weak report was the negative .2% reading for the Producer Price Index. For the week ahead, the economic reports investors should watch due to their potential market moving impact:
  • Industrial Production (M)
  • FOMC begins, Consumer Price Index and Housing starts (T)
  • FOMC Announcement (W)
  • Jobless Claims and Philadelphia Fed Survey (R)
  • Quadruple Option Expiration (F)
As noted above, the Fed begins a two day meeting on Tuesday. For insight on expectations, Bill McBride at the Calculated Risk blog provides a pretty good summation of expectations coming from the Fed meeting.

Lastly, below is the link to this weeks magazine.


Active Share And Equal Weighted Investment Strategies

S&P Dow Jones Indices recently released an interesting white paper, Equal-Weight Benchmarking: Raising the Monkey Bars, that provides detail on why equal weighted benchmarks have mostly outperformed the cap weighted S&P 500 Index historically. Importantly, S&P notes,
"While cap-weighted indices measure many things, there is (at least) one important thing that they do not measure. The return of a cap-weighted index represents the performance of the average invested dollar, not the performance of the average stock. What is the average stock’s performance? The process of adding each stock’s return and dividing by the total number of stocks is precisely how the return of an equally-weighted index is calculated."
From The Blog of HORAN Capital Advisors

One important aspect of the white paper led to the discussion of "Active Share." Active Share has recently become a more popular topic as the variable provides investors with a data point to evaluate whether their active manager is really a closet indexer. Active share is essentially a measure that indicates by how much a particular portfolio differs from its representative benchmark. The importance of knowing whether your investment manager is employing a closet index strategy has to do with the fact that a closet indexing strategy is one that is difficult to outperform the market on an after fee basis. PIMCO released a white paper late last year, Active Share, Tracking Error and Manager Style, that provides a more indepth discussion on Active Share.

For more concentrated investment managers, one holding less than 50 securities, the PIMCO article notes managers with Active Share between 20%-60% would be characterized as having a low Active Share. Active Share over 90% would be considered high. At HORAN, our model portfolio holds 44 positions today with an Active Share of a little over 80%. The S&P 500 Index is our benchmark for our individual stocks, yet we have positions in eight stocks not represented in the S&P 500 Index. These eight positions account for 16.6% of our individual large cap equity weighting. Additionally, there are several larger S&P weighted positions we do not hold.

In conclusion, active share is only one measurement statistic investors can evaluate when comparing investment managers from one another. Just as a high Active Share can provide a manager with a greater likelihood to outperform their respective benchmark, it could also result in a greater likelihood to underperform. As noted in the PIMCO white paper, Active Share does affect idiosyncratic risk or that risk that can be mitigated by diversification. On the other hand, PIMCO notes there is no link between active share and systematic risk. Systematic risk is undiversifiable risk or market risk.


Saturday, June 14, 2014

Crisis Impact On Markets

The resurgent conflict between the Sunnis and the Shiites in Iraq has raised the issue of its potential impact on investment markets. Additionally, this weekend it is being reported that the U.S. is moving an aircraft carrier into the Gulf. Of course, this would enable the U.S. to launch airstrikes within Iraqi territory.

Investors will need to keep in perspective the impact these crisis events historically have on equity markets. At the time the issues in Syria arose, S&P Capital IQ prepared a report titled, Shocks & Stocks. Earlier this year we wrote a post, Market's Reaction To Geopolitical Events, that highlighted some of the information contained in S&P's report. One item that was referenced from the report was the below table.

From The Blog of HORAN Capital Advisors

As can be seen above, the initial reaction to crisis events for the S&P 500 Index is negative; however, the median recovery days for the above events is 14 days (the average is 72 days.) Additionally, The Wall Street Journal prepared an article in early May that included a chart prepared from Ned Davis Research data. The chart below shows the initial negative market impact of a crisis, but six months following the crisis event the market, on average, is higher by 8.9%.

From The Blog of HORAN Capital Advisors

For investors, selling after the crisis takes place has generally not been a rewarding one. Additionally, the events that tend to have the most negative and longer lasting negative influence on the equity markets are those that impact the financial markets directly like the Lehman bankruptcy in 2008 and the program trading event in 1987. If the Iraqi situation draws a military response from the U.S. and the market reacts negatively, this may be a buying opportunity for investors holding excess cash and/or overweight in bonds.


Sunday, June 08, 2014

Week Ahead Magazine: June 8, 2014

With the 2.7% increase in the small cap Russell 2000 Index last week, most broader U.S. market indices are now showing positive returns for 2014:
  • S&P 500 Index: +5.5%
  • Dow Jones Industrial Average: +2.1%
  • Russell 2000 Index: +.1%
  • Wilshire 5000 Index: +4.9%
  • Nasdaq Composite: +3.5%
Many of last week's economic reports were positive and the market seems to be satisfied with a 200,000 handle on the non farm payroll reports.
  • The ECB came through on the monetary stimulus front which included a negative rate of interest on reserve deposits at the European Central Bank.
  • Auto sales exceeded expectations in May and some below this is due to roll off of the Cash for Clunkers program from 2009.
  • Positive reports were delivered for the manufacturing and non manufacturing PMIs. Importantly, new orders and backlog within the manufacturing report were strong.
Looking at the week ahead economic reports are expected to be on the light side. Jobless claims are reported Thursday along with retail sales. PPI is reported Friday. With respect to retail sales, the Week Ahead Magazine contains a link to a Thomson Reuters AlphaNow article that covers the recent improvement in retail sales.

Lastly, several articles cover the fact the U.S. equity market does seem extended on a short term basis. However, outside of some unforeseen external shock, any correction may likely be viewed as a buying opportunity. Below is the link to this week's magazine.


Are Investors Really Holding A Lot Of Cash?

An article making the rounds on the internet this weekend is one that appeared in the New York Times on Friday, Fear of Equities Drives More Investors to Cash. The article cites a State Street (STT) study titled, Stashing Cash Under the Mattress. An important footnote in the study notes the asset allocation question is referring to what an investor is doing with their monthly 'saving/investing' budget. From the study, survey participants indicated they were placing 44% of their monthly funds into a 'savings/checking' account. The study then presents a table showing investors are allocating 44% of their budget to cash, to which the New York Times article notes the survey participants are fearing equities. The remaining 56% allocation of one's budget is being placed in a broad array of investment categories. That is a high percentage one is placing into the market. I am presuming the 44% savings/checking" budget allocation is likely being used to support one's spending desires.

Do overall cash levels in the market actually support the survey and Times conclusions? As the below chart shows, money market assets as a percentage of all mutual fund assets are at the lowest level going back to the mid 1990s. Additionally, Forbes cites the AAII April Asset Allocation Survey noting cash allocations reported by investors stand at 17.4% which is below the long term average of 24%. Coincidentally, the below chart using ICI data shows a similar percentage.

From The Blog of HORAN Capital Advisors

In reviewing the most current allocation percentages for the broad investment categories from the Investment Company Institute (stocks, fixed income and money market assets), the below chart indicates investors, as a percentage of all mutual funds, are most overweight in bonds/fixed income investments. As a percentage, equities remain below the level just before the onset of the financial crisis at the beginning of 2008.

From The Blog of HORAN Capital Advisors

Maybe investors are saying one thing and actually doing another; however, it does appear investors are not sitting on piles of cash. In fact we wrote a recent post in early May, Are Mutual Funds Preparing For A Correction? Is it possible fund companies are seeing investors' actual behavior is far from a fearful one?


Thursday, June 05, 2014

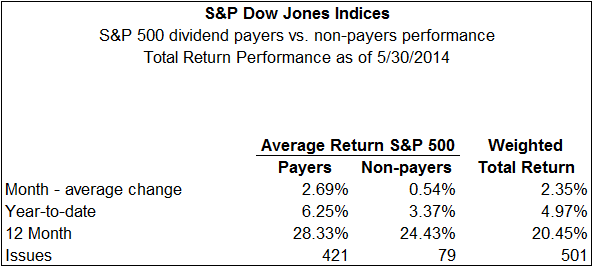
Dividend Payers' Return Remains Strong Through May

We noted in an early March post that dividend payers in the S&P 500 Index were under performing the non payers by over 600 basis points during the first two months of 2014. Near that same time the market was beginning a transition out of momentum and growth stocks into value oriented equities. As fate would have it, many dividend payers screen as value type stocks. As a result, since the end of February, the dividend payers have significantly outperformed their non dividend paying counterparts in the S&P 500 Index. As the below table shows, the dividend payers are now outperforming the non payers by nearly 400 basis points. This is a nearly 1,000 basis point swing in just three months.

From The Blog of HORAN Capital Advisors


Tuesday, June 03, 2014

High Yield Stocks Underperform In Rising Interest Rate Environment

Much has been made of the decline in interest rates since the start of 2014. Many investors expected interest rates would continue to rise as a result of the Fed's "taper" announcement in May of last year. The market action subsequent to the taper announcement certainly saw the yield on the 10-year Treasury rise, ultimately reaching over 3% at year end 2013. So far in 2014 though, the yield on the 10-year Treasury has managed to decline to just under 2.5%.

From The Blog of HORAN Capital Advisors

In a recent report by S&P's Sam Stovall, he notes the higher yielding (2.5%+ yield) sub industry groups delivered the worst performance following the Fed's taper comment. Additionally, for the past one year, the higher yielding sub industry groups performance has lagged the lower yielding (less then 1.5% yield). Will this underperformance by the higher yielders continue as a result of potentially higher interest rates for the balance of 2014?

From The Blog of HORAN Capital Advisors

A portion of S&P's conclusion centers around their belief interest rates will trend higher through the balance of this year and into 2015. Specifically, S&P notes,
"In a possible preview of coming attractions, S&P Capital IQ thinks investors should proceed with caution, especially those who are starving for yield and seem to be on a constant quest for cash. Our advice is to regard last year’s knee-jerk reaction to higher rates, as well as the restrained recovery, as a possible preview of coming attractions when rates move higher once again."

"From April 30, 2013 through the end of the year, the yield on the 10-year Treasury note rose from 1.7% to slightly more than 3%. Now it has drifted back down to 2.5%, in what we believe is a counter-trend rally before moving higher once again as economic data confirm the improvement in U.S. GDP growth. Indeed, Standard & Poor’s Economics, which operates independently of S&P Capital IQ, projects the 10-year yield to end 2014 around 3.1% and creep even higher by the end of 2015 to near 3.5%. In addition, even though history should be viewed as a guide and not gospel, the monthly difference between headline CPI and the yield on the 10-year note during the past 60 years implies a year-end 2014 level that approaches 4%."

"Taken from an individual stock perspective, investors should consider returns during the past year, along with valuations, when making investment decisions. S&P 500 companies yielding 2.5% or more recorded an average total return of 11%, versus 19% for all companies in the “500,” and 25% for those yielding 1.5% or lower. Even more telling, is that nearly one-quarter of all companies yielding 2.5% or more are still under water, having recorded a decline in price and dividend in the past year. This percentage of decliners is more than 10 percentage points higher than the average for those companies yielding less. And while valuations (P/E ratios based on forward-year EPS estimates) for the higher-yielding category is currently below the lowest yielding category, they trade at a 20% premium to the middle-yielding group and for the cap-weighted S&P 500 Index."
As a final comment on interest rates, many investors have been surprised by the rate decline that has occurred this year. It may seem unlikely that rates will continue their decline from these low levels; however, JP Morgan's net treasury survey shows investors are the most short treasuries since 2006. If investors need to cover their shorts as a result of a further decline in interest rates, the increased treasury demand will push treasury prices higher, i.e., yields decline. Certainly a lot going on in the bond market that is attempting to prove the consensus wrong.

From The Blog of HORAN Capital Advisors
Source: Jesse Felder


Source:

A Preview Of Coming Attractions?
S&P Capital IQ
By: Sam Stovall, Managing Director
May 27, 2014
http://us.spindices.com/documents/commentary/20140527-sector-watch-coming-attractions.pdf


Sunday, June 01, 2014

Week Ahead Magazine: June 1, 2014

So much for sell in May so far. The S&P 500 Index was up 2.35% in May and is up 4.97% for the first five months of this year. The one major S&P Index that is down on the year is the S&P Small Cap 600 Index which is down 1.43%. The best performing sector YTD through May is the utility sector which is up 13.57%; however, this sector was down 1.05% in May.

A number of economic variables were released last week and one article link in the magazine provides commentary on them. Of some significance was the fact annualized first quarter GDP was revised to a minus 1%. Pundits are attributing the weak GDP reading to the winter weather experienced during the first quarter. As Econoday notes, "Overall, while overall growth was bumped down into negative territory, it was mainly due to less robust inventory growth—final demand was little changed. And the second quarter is gaining strength." 

A number of key economic data points will be reported this week. All eyes will be on Mario Draghi, President of the European Central Bank. Last month Draghi announced the ECB was ready to counter low inflation and to assist economic growth. It is anticipated the ECB will cut interest rates and deploy other stimulative measures when they meet on June 5th. One potentially controversial measure the ECB may announce is reducing the central bank deposit rate to minus .1% or minus .15%. Essentially this charges banks that have funds on deposit at the ECB.

Below is the link to this week's magazine.


College Costs A Bigger Hurdle Than Health Care Costs For Many

Terry Horan, CLU, ChFC is CEO of HORAN Associates, HORAN Capital Advisors' business partner. Terry often states the two greatest challenges facing Americans today are:
  • access to quality, affordable health care; and
  • securing professional counsel to build and sustain wealth for a lifetime
After seeing a report from JP Morgan Asset Management, I wonder if one of the greatest challenges of all for families is being able to finance their children's education. Below are several slides pulled from the 46-page booklet. First a couple of highlights:
  • since 1983 college tuition costs have increased faster than any other household expense. Tuition costs have increased a cumulative 645% versus health care's cumulative increase of 326%.
  • at a 5% annual increase, college costs will more than double by 2030
  • for children born today, the projected cost of a four-year private college education will total over $409,913. The same cost for a public education will total over $185,000.

From The Blog of HORAN Capital Advisors

From The Blog of HORAN Capital Advisors

From The Blog of HORAN Capital Advisors

Young families will be hard pressed to save enough funds to finance their children's education costs. In addition to a well thought out saving plan, the dollars saved will need to be invested in asset classes that can generate significant positive returns. In our firm's view bonds will not grow at an adequate rate so families will need to position their investments in potentially better returning asset classes like equities and alternatives.


Wednesday, May 28, 2014

Why The Equity Market Is Not Correcting

Below is a post originally written by Ali Meshkati of Zenolytics. Ali has provided us with permission to republish the post he recently wrote for his readers. As much as sentiment can be a confounding concept, the below commentary seems to sum up the state of the current market.

SPRINTING SCARED by Ali Meshkati of Zenolytics

As the persistence of the current bounce becomes apparent, the trembling, crooked fingers of the average asset manager have become increasingly disfigured rendering them unable to pick up their saltine crackers and grape juice as they ponder ways in which to allocate their cash in a comfortable manner. And that right there is the problem or perhaps, the solution, to the current perception of this recent rally. The comfort level in buying this run up on some of the lightest volume we have seen in years is simply not there. It doesn’t exist. Leaving asset allocators no choice but to stew in their own rigidity as they await what may never come.

According to the BofA Merrill Lynch fund manager survey released some weeks ago, fund manager cash levels are at two year highs. Nothing Earth shattering in an overly-bearish tone, but still relevant in judging the perception of the current market. When institutions increase cash levels it is because they either 1) believe that equities will become cheaper at some point down the road, allowing them to buy back in over several months OR 2) are unsure in their belief of the equity markets, rendering them unable to make any decisions of consequence as to how assets should be allocated. Cash then becomes the safest bet until the market convinces them otherwise.

In both cases, institutional fund managers will have their hands forced by a market that presses to the upside. This is because institutions do not have the luxury of sitting out rallies in their benchmark based on simple theory. Not after what has transpired in terms of under-performance for the past 5 years paired with an increasing array of options for investors to gain exposure to equities without the need for an asset manager that has under-performed greatly.

In the current circumstance, you can see a market that is intentionally running away from those who are attempting to coax it back into a position that would provide the comfort needed to gain exposure. Each headline that passes with news of an all-time record high in the S&P 500 is similar to a jab to the gut of the fund manager who is neither comfortable, competent nor desirous of exposure to a creature he frankly does not understand.

As averages that have been abhorred as under-performers and dead money in 2014, such as small-caps and growth continue their surge, more pressure will build on those who are under-invested to catch up. Eventually leading to the catch up trade that typically marks short to intermediate term highs in the market.

During the entirety of this exercise in articulate buffoonery, everything from volume to valuations to generic, yellow boxed macro concerns will be cited as evidence of the need for conservatism in the face of record highs in the popular indices. To no avail, however. In the end, the need to have a job trumps theory in any shape or form. And the quickest way to lose a job on Wall Street is to trail behind it. A trait that has become oddly commonplace among far too many.

In essence, fear not, the markets are doing their duty in cajoling future french fry artists and ice cream masons onto the path that destiny has chosen. The difficulty in buying this market is as bullish an element in any as assessing its upside potential. Be confident in that fact.


Tuesday, May 27, 2014

Market Crash Averted?

Being somewhat of a contrarian I use the above headline with trepidation as I look back at the number of articles published in February and March of this year that equated the 2012 - 2014 market with that of the crash of 1928 - 1929. We wrote an article in mid February, 1929 Crash: Charts That Mislead Investors, that pointed out the difference between 1928 - 1929 to 2012 - 2014. Fast forward to today and the so-called "scary chart" looks like a crash has been averted. The below chart is courtesy of Yardeni Research and the chart would indicate the market is not following the 1928 - 1929 pattern.

From The Blog of HORAN Capital Advisors


Monday, May 26, 2014

Week Ahead Ahead Magazine: May 26, 2014

Several potential market moving economic data points will be released this week. Durable goods orders will be released Tuesday morning, jobless claims Thursday as well as the second revision of first quarter GDP. The GDP announcement will be watched closely as Thursday's report will be the first revision of the advanced reading reported in April when Q1 GDP was reported at .1%. The consensus estimate is for GDP to be revised down to a negative .5%. One important measure used by the National Bureau of Economic Research (NBER) that goes into determining whether the economy is in a recession is two consecutive quarters of negative GDP growth. If the Q1 revision is negative, then some will say the economy is one half the way towards a recession. The GDP report will certainly provide fodder for the financial media. Importantly, other factors are incorporated into the recession call. The Department of Commerce's Bureau of Economic Analysis notes employment, personal income, and industrial production are important factors also.

Several of the article links in this week's magazine discuss the positives associated with the current equity market. Conversely, several of the links focus on the negative aspects of the current market environment with the sell off in small caps and the investor rotation out of the momentum names. My posting has been limited the past couple of weeks as I was fulfilling my civic duty of serving as a juror on a trial in my county.

Below is the link to this week's magazine.


Sunday, May 18, 2014

Week Ahead Magazine: May 18, 2014

I suppose last week was an eventful one as the S&P 500 Index reached a new intra-day high on Tuesday of 1902.17. The "century" levels, 1900 in this case, tend to be strong psychological resistance levels for the market and a close above 1900 was not realized.

From The Blog of HORAN Capital Advisors

Most U.S indices ended down on the week from flat to -.6%. The Nasdaq generated a small .5% gain. The economic data continues to be indicative of an economy experiencing slow economic growth. April retail sales were week with the "weather" excuse no longer valid. And consumer sentiment and industrial production both experienced unanticipated declines.

In the coming week, potentially market moving releases will be, FOMC minutes released on 5/21, jobless claims and existing home sales on 5/22 and new home sales on 5/23. Next Monday is Memorial Day in the U.S.and markets will be closed. With the holiday being a three day weekendd, many traders will head out of town early as the end of this week nears.

A number of the articles in this week's Week Ahead Magazine focus on the anticipated correction and negativity around corporate earnings. Being a bit of a contrarian, it seems many are calling for the proverbial 10% correction and I would not be surprised if one does not unfold this summer outside of some unanticipated external shock. At the beginning of this year many were calling for higher interest rates for a whole host of reasons. I think Ryan Detrick's recent commentary and his bullish bond call late last year sums up the contrarian sentiment calls pretty well. Below is a link to this week's magazine.


Saturday, May 17, 2014

Labor Market Impact On GDP Growth

The Federal Reserve Bank of St. Louis provides a great deal of commentary on a wide range of economic topics. They recently wrote commentary on the significance of labor market data, and importantly, the influence of the employment to population ratio (E/P) on real GDP. The article notes the sub-par GDP level is being influenced by the reduced level of the E/P ratio, a level last reached in the early 1980's. Specifically they note,
"...the EP ratio is a key input in a standard growth accounting framework. In this framework, real GDP is the product of (1) real GDP per worker, (2) the percentage of the population that is employed, and (3) the civilian population. The first term approximates labor productivity and the second term is the EP ratio. Mathematically, we can transform each of the three components into growth rates and then add them together to produce real GDP growth. Since population growth tends to change very little in the short-to-medium term, the growth accounting framework is useful because it shows why real GDP growth accelerates or slows. Thus, has real GDP growth changed because of changes to the growth of labor productivity, EP ratio, or some combination of the two? One reason why average real GDP growth during this expansion (2.24 percent) has been so slow is that labor productivity growth has been relatively slow: 1.48 percent per quarter (annualized) through the first quarter of 2014. As shown in the graph, the other reason is that the EP ratio is still below the level that prevailed at the trough of the past recession (second quarter of 2009). Since then, the EP ratio has declined by an average of 0.26 percent per quarter (annualized). Until the growth of the EP ratio strengthens, the pace of the economy’s growth will remain quite modest (emphasis added). That is, assuming population growth remains constant, if labor productivity growth doesn’t accelerate, neither will economic growth."

From The Blog of HORAN Capital Advisors

As a result, one key question from this economic data point is to ask the question, what is constraining job growth? No one factor is likely contributing to this phenomenon; however, several regulatory factors are likely contributors. The Affordable Care Act and the Act's redefinition of a full time worker as one working 30 hours per week and a proposal to increase the minimum wage to $10.10 per hour by 2016. Businesses have already responded to the increased cost of labor by replacing employees with technology. Several large restaurant chains have introduced tablet computers at tables allowing patrons to order and pay for meals without the need of a server.

Certainly there needs to be a cost/benefit balance in labor regulatory requirements. At the current slow rate of employment growth though, regulations increase labor costs will continue to constrain employment growth and result in a low level of economic growth in the foreseeable future.


Thursday, May 15, 2014

The Dow's Below Average Run To A Record High

Earlier this week the Chart of the Day charting service provided information on Dow rallies over the past 114 years. As the below chart shows, the current advance in the Dow lags the average Dow rallies in terms of magnitude and duration. The commentary included with the Chart of the Day graph is as follows.
"The Dow just made another all-time record high. To provide some further perspective to the current Dow rally, all major market rallies of the last 114 years are plotted on today's chart. Each dot represents a major stock market rally as measured by the Dow with the majority of rallies referred to by a label which states the year in which the rally began. For today's chart, a rally is being defined as an advance that follows a 30% decline (i.e. a major bear market). As today's chart illustrates, the Dow has begun a major rally 13 times over the past 114 years which equates to an average of one rally every 8.8 years. It is also interesting to note that the duration and magnitude of each rally correlated fairly well with the linear regression line (gray upward sloping line). As it stands right now, the current Dow rally that began in March 2009 (blue dot labeled you are here) would be classified as well below average in both duration and magnitude. However, the magnitude and duration of the current post-financial crisis rally has now reached median status -- its magnitude and duration is greater than six and less than six Dow rallies since 1900."
From The Blog of HORAN Capital Advisors


Monday, May 12, 2014

Quality Stocks Serve As A Port In A Storm

One favorable aspect to the highest-quality companies/stocks is they tend to fall less in down equity markets. If an investor then structures their portfolio to loss less when the market does correct, the return needed in a subsequent market rebound is smaller if the loss is smaller. Over a complete market cycle then, if one losses less and stays in the game on the upside, they will tend to outperform the overall market. Incurring significant losses in down markets is what does the most damage to compounding one's portfolio growth.

From The Blog of HORAN Capital Advisors

It is the highest-quality companies that have a positive return profile when the market corrects. Many of these highest quality companies are dividend payers as well. A common "quality" measurement variable is S&P Dow Jones Indices Earnings and Dividend Quality Ranking. I touched on this last week in the post, An Alternative To Selling In May. Additionally, I wrote a post in 2006 covering S&P's Quality Ranking System, Standard & Poor's Ranking System. As a follow up, T. Rowe Price included an article in the Spring 2014 T. Rowe Price Report titled, Highest-Quality U.S. Stocks Outperformed Overall. A couple of factors that came out of the study referenced in the article:
  • "The highest-quality stocks tended to outperform the overall market and the lowest-quality stocks."
  • "These stocks particularly tended to outperform during months in which the market fell by at least 3%."
  • "The lowest-quality stocks tended to outperform the market and the highest-quality stocks during months in which the market rose by at least 3%."
  • "Periods of outperformance of high-quality stocks tended to persist for up to 24 months."
  • "The same general trends were found among stocks in developed and emerging regions around the world."
The outperformance in down markets actually equates to positive returns for the highest quality companies as can be seen in the below chart. In every year the lowest quality stocks generated a negative return, the highest-quality stocks generated a positive return.

From The Blog of HORAN Capital Advisors

One important takeaway from the T. Rowe Price study is the fact the lowest quality stocks tended to outperform after coming out of a recession. I think it is fair to say the current economy is not now just coming out of a recession.

So instead of simply selling in May, focusing on the highest quality companies is an alternative. Keep in mind though, a number of the highest quality companies have experienced strong returns this year, pushing some of their stock valuations to the higher end of their historical ranges. Lastly, Atlanta Capital Investment Managers publishes an in depth quarterly Quality Scorecard Report that can be accessed under "Quality Scorecards" on their publications tab for readers interested in more detail on quality rankings.


Sunday, May 11, 2014

Week Ahead Magazine: May 11, 2014

Except for the .4% gain in the Dow Jones Industrial Average last week, equities ended the week on a mostly negative note. The market continues to have a heightened focus on the so-called internal rotation taking place among specific equity sectors and stocks. The weaker areas of the market have been in small cap stocks, down 4.8% this year and the specific momentum segments: biotech, social media and technology stocks. Some market moving economic data will be released this week, retail sales, CPI and PPI, industrial production, jobless claims and housing starts, just to name a few. A number of additional economic reports will be released and interested readers can view Econoday's weekly calendar for additional detail. Below is the link to this week's magazine.


Saturday, May 10, 2014

Dividend Payers Now Outperforming In 2014 And A Look At Mega Caps

At the end of February the year to date performance for the dividend payers in the S&P 500 Index significantly trailed the performance of the non-payers by a large 673 basis points. Two months later, the end of April, the year to date average return of the payers now exceeds the non-payers by 66 basis points. Much has been written about the bubble bursting in some of the momentum names, like Amazon (AMZN) down 26.7% YTD, Verisign (VRSN) down 19.8% YTD and Yahoo (YHOO) down 16.5% YTD, all non-dividend paying stocks. Conversely, the telecommunication and utility stocks have significantly outperformed the overall market. The utility ETF (XLU) is up 11.3%, CenturyLink (CTL) is up 14.8% and Winstream Holdings (WIN) is up 15.2% this year, all dividend payers.

From The Blog of HORAN Capital Advisors

The other factor influencing investor returns in March and April is the the outperformance of mega cap stocks like Exxon Mobil (XOM), Apple (AAPL), Microsoft (MSFT), Johnson & Johnson (JNJ) and Chevron (CVX). These stocks are all dividend payers and top holdings in the Guggenheim Russell Top 50 Index (XLG).

From The Blog of HORAN Capital Advisors

The sideways trending market this year, along with investor cautiousness as the "sell in May" seasonality phenomenon gets much attention, both have contributed to investors seeking safety in these higher quality mega cap dividend payers.

Disclosure: Firm and/our family long AAPL, MSFT, CVX, JNJ, XOM


Bullish Sentiment May Be Indicating Oversold Equity Market

This past week's Sentiment Survey report by the Association of Individual Investors shows individual investor bullish sentiment declined further to 28.34% from the prior week's level of 29.77%. The weekly sentiment readings tend to be volatile and looking at the 8-period moving average shows the average sentiment reading is 31.5%, still a low level. Many of the survey participants indicated a neutral view on the market as the neutral reading was reported at 42.99%. The last time the neutral reading was above 42% was September of 1999 when the neutral reading was reported at 42%. To remind readers, the AAII sentiment survey readings are viewed as contrarian indicators.

From The Blog of HORAN Capital Advisors
Source: AAII


Sunday, May 04, 2014

An Alternative To Selling In May

An alternative to selling in May is to focus on lower beta high quality stocks whose performance has lagged the lower quality issues over the past twelve months. In a recent report by S&P Capital IQ, Quality and Stability, S&P notes the lower quality issues in the S&P 500 Index have outperformed the higher quality ones. In the report S&P summarizes the quality breakdown as of April 17, 2014:
...there were 443 companies the S&P 500 that had an S&P Quality Rank, with 128 (29%) having ranks of A-, A or A+, otherwise known as “above average.” Also, there were 169 companies ranked B, B- or C, or “Below Average.” Finally, 146 were ranked B+ or “Average.”
The significance of the quality ranking is it takes into account the consistency of earnings and dividend growth over the prior ten years. Historically, companies that have a higher consistency in growing their earnings and growing their dividends tend to be less volatile in declining markets. The below table details the average beta of the A- to A= quality ranked stocks versus their counterparts with a rating of B+ and lower.

From The Blog of HORAN Capital Advisors

The report contains a list of twenty companies that S&P screened on quality and Fair Value Ranking that readers may find of interest.

Source:

Quality and Stability
S&P Capital IQ
By: Sam Stovall, Chief Equity Strategist
April 24, 2014
http://us.spindices.com/documents/commentary/20140421-sector-watch-quality-and-stabililty.pdf


Disclosure: Firm and/or family long CMCSA, CVX, SYK, UTX, QCOM


Week Ahead Magazine: May 4, 2014

The equity market continues to be stuck in a trading range that has generated nearly flat returns on a year to date basis. Although most U.S. market indices were higher last week, YTD returns are muted: S&P 500 Index (1.8%), Dow Jones Industrial Average (-.4%), Russell 2000 (-3.0%). This past week the apparently strong employment report indicated the unemployment rate declined 40 basis points to 6.3%. A significant negative in this report is the decline in the rate was primarily a result of the continued decline in the participation rate to 62.8%. The unemployment report noted the labor force fell a massive 806,000. A number of articles in this week's magazine discuss implications surrounding last week's job's report. "Sell in May" continues to be a topic du jour and hopefully this week's magazine will be the end of the "sell in May links. Lastly, several links provide commentary on the continued rotation occurring within the market. Since mid April growth is once again outperforming value providing further evidence the market is struggling to breakout of the 2014 trading range.


Are Mutual Funds Preparing For A Correction?

From an asset allocation perspective individual investors' equity weighting has reached a level last seen in mid 2007. According to the American Association of Individual Investors monthly asset allocation survey, the equity weighting at the end of April equaled 67%. This is down slightly from the 67.2% in the prior month; however, the prior high in the equity weighting level was 68.6% reach in June of 2007.

From The Blog of HORAN Capital Advisors
Source: AAII

Certainly the strong equity market advance since the end of the Great Recession has contributed to this higher equity weighting. Also, in spite of the fact investor fund flow data shows investors were cautious on allocating funds to equity until the beginning of 2013, equity flows continue to be positive. A bit surprising is the fact investor fixed income flows were positive in February and March as can be seen in the below chart.

From The Blog of HORAN Capital Advisors

So given the strong equity advance since 2009 and the individual investor's desire to increase equity exposure, generally late in a market cycle, are mutual fund companies preparing for an equity correction? The market has not experienced a 10% plus correction since late 2011.

From The Blog of HORAN Capital Advisors
Source: MarketWatch

The below chart compares liquid assets of mutual funds to the trend in the S&P 500 Index. The chart would seem to indicate fund managers are having more difficulty finding attractive investments and, maybe at the same time, preparing for investors to reduce equity exposure at the first sign of a market pullback.

From The Blog of HORAN Capital Advisors

In reviewing several sentiment indicators like the AAII Sentiment Survey and the Commitment of Traders Report, excessive bullishness by individuals or small investors does not seem present at the moment. These sentiment indicators can change fairly quickly though.