One index measure investors review to gauge the level of fear in the market is the VIX Index. Currently, the VIX is trading at 31.78, down a little over 1 point today. High levels in the VIX translate into a fearful market and can be indicative of a short term market bottoms. In the early part of 2010, the market's first encounter with the Euro crisis, the VIX hit 48. The S&P 500 Index bottomed shortly after this. In other words, the VIX can be viewed as a contrarian indicator.
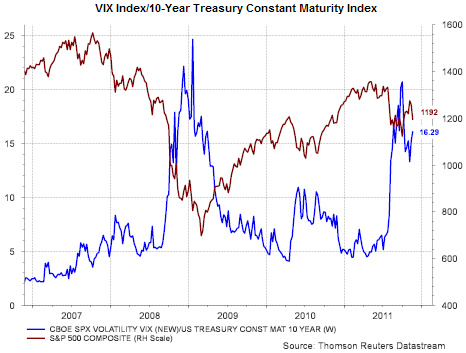
Another variation of the VIX is to look at the VIX Index divided by the 10-year Treasury Index. Again, high levels in the VIX show investor fear in the equity markets. A low level in the 10-year Treasury indicates bond investors generally have an anemic growth and inflation outlook over the longer term. Consequently, a high ratio number is a contrarian investment measure. The below chart contains a graph (blue line) of this ratio along with a graph of the S&P 500 Index (red line).
Another variation of the VIX is to look at the VIX Index divided by the 10-year Treasury Index. Again, high levels in the VIX show investor fear in the equity markets. A low level in the 10-year Treasury indicates bond investors generally have an anemic growth and inflation outlook over the longer term. Consequently, a high ratio number is a contrarian investment measure. The below chart contains a graph (blue line) of this ratio along with a graph of the S&P 500 Index (red line).
 |
| From The Blog of HORAN Capital Advisors |
h/t: Calafia Beach Pundit

No comments :
Post a Comment