Monday, February 03, 2014

Looking For An Excuse To Sell: Emerging Markets, PMI's And Hedge Fund Shorts

I began writing this post several weeks ago when equity markets around the globe succumbed to profit taking. Much of the catalyst was attributable to currency issues in a number of the emerging economies with the China PMI report tipping the scales toward this profit taking environment. China's PMI report last month indicated that the country's manufacturing economy had contracted in January versus the report in December. The China January PMI was reported at 50.5 versus 51 in December. Industrial output fell below 50 at 49.5 versus 50.5 in December. This morning China's non-Manufacturing PMI declined to 53.4 versus 54.6 in December. Readings below 50 indicate contraction. As can be seen in the below chart, readings below 50 have been more the norm than not since 2011 so why all the concern now?

From The Blog of HORAN Capital Advisors
Source: Reuters

Then this morning the U.S. manufacturing PMI came out and was weaker than expected but still indicating expansion. As the below chart indicates the PMI has been in expansion since the end of the most recent recession except for November 2012 when the PMI reading was 49.5 and we know how the market performed in 2013.

From The Blog of HORAN Capital Advisors

The implications for investors of these developments in the emerging economies are certainly data points to be taken seriously as the rate of growth in China is one that is slowing. With respect to the currency issues though, the recent weakness in a number of emerging economies has been festering for several years. Scott Grannis, former Chief Economist at Western Asset Management, writes at his blog, Calafia Beach Pundit,
"An emerging meme posits that the recent weakness in quite a few emerging market currencies (e.g., Argentina, Venezuela, Brazil, Chile, Turkey) is a replay of the S.E. Asian currency crisis of 1997-98, and as such this may persuade the Fed to back off on its intention to continue its QE taper. I disagree, because there are some very important differences between now and then."
The Grannis article highlights the issues that have been developing in some of the emerging countries that led to recent currency weakness and is a good read for investors.

We believe investors should evaluate these emerging market developments in the context of overall economic activity around the globe. It is not uncommon, or better yet, it is normal for economies to transition from a recovery phase, an expansion phase and ultimately a contraction phase. Importantly, investors should evaluate where the various economies around the globe fall in respect to the economic cycle and allocate investment dollars within their portfolio based on these conclusions.

At the end of 2013, Fidelity research estimates several of the major global economies reside in positions within the economic cycle as noted below.

From The Blog of HORAN Capital Advisors

The implications of this transition to different phases of the economic cycle are important for investors as they allocate equity funds to the sectors that will benefit the most or least from the specific phase of the cycle in which the economy may reside. This is not a clear cut metric though; however, it is helpful in guiding ones investment allocation. We wrote about this in early 2011, Sector Rotation And The Economic Cycle, and provide a link to a Fidelity white paper that contains a more in depth discussion on this topic.

From The Blog of HORAN Capital Advisors

Because these sector transitions are not clear cut, at HORAN we review a number of variables one of which is earnings revisions by analyst. As the below table shows, the largest positive revisions have been in the Utilities and Telecommunications sectors. For the month of January, from a sector contribution perspective, both of these sectors were top three in terms of contribution as detailed in S&P's January Index Dashboard report.

From The Blog of HORAN Capital Advisors
Source: Thomson Reuters Starmine


Looking ahead, investor should take some comfort in Q4 2013 earnings reported by S&P 500 companies to date. A total of 249 S&P 500 companies have reported to date for the fourth quarter. There seems to be quite a bit of chatter about companies lowered guidance going into Q4 so this lowered expectations. Yet, the blended earnings growth rate for Q4 is running at 8.9%. When the quarter began, earnings growth was expected to equal about 7.5% as we noted in our Q4 Investor Letter. In short, we believe companies have been performing pretty well. More importantly, we continue to focus on the forward guidance provided by these firms.

The first read on fourth quarter GDP was reported last week as well. Our belief is U.S. economic growth, GDP, continues at a steady but not over heated pace. The first read on GDP was an annualized 3.2% which is down from 4.1% in Q3 2013. Looking at important components of the GDP report, specifically the consumer, there were some positives.

As reported by Econoday (emphasis in the statement is HCAs), “The increase in real GDP in the fourth quarter primarily reflected positive contributions from personal consumption expenditures (up 3.3 percent), exports (up 11.4 percent), nonresidential fixed investment (up 3.8 percent), private inventory investment, and state and local government spending that were partly offset by negative contributions from federal government spending and residential fixed investment. Imports, which are a subtraction in the calculation of GDP, increased.”

“The deceleration in real GDP in the fourth quarter reflected a deceleration in private inventory investment (will need to add to inventory going forward if demand continues?), a larger decrease in federal government spending (a longer term positive), a downturn in residential fixed investment, and decelerations in state and local government spending and in nonresidential fixed investment that were partly offset by accelerations in exports and in PCEs and a deceleration in imports.”

Since the consumer accounts for 70% of GDP, Econoday’s conclusion, “While the fourth quarter was moderately healthy on average as measured by GDP, monthly data showed softening late in the quarter — notably for manufacturing and housing. However, the consumer appears to be a little more optimistic and the consumer sector may be carrying the economic load over the next few months.

So fundamentally, U.S. companies are performing relatively well and we think this continues through 2014. Volatility will undoubtedly continue this year, which seemed to disappear in 2013. From a market technical perspective, a correction or consolidation phase is healthy and we do believe the recent focus of the selling is an excuse by investors to take profits in some of their equity position. Additionally, some institutional and hedge fund type managers probably have been caught of guard with the decline in interest rates in the U.S. As a recent article on Business Insider notes, All of the Turmoil In Global Markets Right Now Is Just One Gigantic Hedge Fund Short Squeeze.


Sunday, February 02, 2014

The Week Ahead Magazine: February 2, 2014

This past week's market was a continuation of the weakness exhibited in the first three weeks of January. A couple of the factors cited for this weakness are emerging market issues specifically related to currency weakness, the continued tapering announced by the Fed, an economic slowdown in China and a underwhelming job report in the U.S. All of this has increased the negative sentiment associated with the equity markets globally. This week's magazine contains a number of articles on bearish sentiment as well as articles impacting the emerging markets. One of the sentiment articles in the magazine points to seasonality in February that highlights that the first week of the month is generally a positive returning one. We will certainly see what plays out this week.


Thursday, January 30, 2014

Bullish Investor Sentiment Continues Its Decline

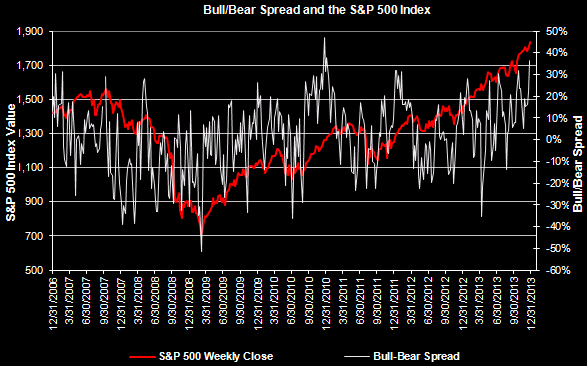
This mornings release by the American Association of Individual Investors of its weekly investor sentiment survey shows the individual investor continues to become less bullish on the equity markets. The bullish sentiment level declined to 32.2% versus last weeks 38.1%. At the end of December the bullish sentiment reading equaled 55.1%. The bull/bear spread stood at +36.5 at the end of December and now has turned negative at -.6. The sentiment measure is a contrarian one and tends to most accurate at its extremes.

From The Blog of HORAN Capital Advisors


Sunday, January 26, 2014

The Week Ahead Magazine: January 26, 2014

I suppose building on last week's magazine that contained article links to a weakening job market, this week's magazine contains a number of links surrounding the emerging markets correction this past week. Are these data points a sign of a global slowdown? The downdraft in the emerging markets did spill over into the U.S. market with the Dow Jones Industrial Average falling more than 300 points. In a recent article by Michael Hasenstab, Ph.D., Executive Vice President, Chief Investment Officer Global Bonds for Franklin Templeton Fixed Income Group®, the article lead-in noted,
"When the masses are against you, it’s hard to stand your ground. Going against the crowd is familiar turf for Michael Hasenstab...and certainly knows the virtue of patience. He has staunchly defended his investment theses over the years, tuning out the naysayers and market noise time and again. Ireland, a country that only a few short years ago, few investors wanted to touch, is a case in point. It’s become one of the biggest turnaround stories emerging from Europe’s debt crisis. Hasenstab continues to stress the importance of taking a long-term view and standing your ground (non U.S. investor link): , and says investors should exercise patience not only in other parts of Europe today, but also in select emerging markets, including China (empahsis added.)"
After the U.S. equity markets generated such strong returns last year, it is not surprising a correction is before us. However, we still believe the correction, or better yet, consolidation, likely will not lead to a full blown bear market. With that, below is the link to this weeks magazine.

Disclosure: Long Templeton Global Total Return Fund (TTRZX)


The Consquences Of The Short Term Structure Of U.S. Treasury Debt

Since the financial crisis, increasingly, U.S. Treasury issuance has occurred at the short end of the interest rate curve. Unlike many mortgage borrowers who refinanced their mortgage debt to lock in lower long term interest rates, the government has issued a majority of new debt at the short end of the interest rate curve.

From The Blog of HORAN Capital Advisors

The consequence of this short term structure is the negative impact higher interest rates will have on the U.S. budget. As the below chart shows, 6% of the government's budget goes toward paying interest on the U.S. debt outstanding.

From The Blog of HORAN Capital Advisors

With the outstanding debt now totaling over $17 trillion, a one percentage point rise in interest rates equates to an additional $170 billion in interest payments on the outstanding debt or 75% increase.

From The Blog of HORAN Capital Advisors

In just the last year and a half, the 5-year yield has increased over one full percentage point. And as the below chart indicates, it is not inconceivable that this rate can move much higher over time. In a lead up to the financial crisis, the 5-year yield was over 5% and just recently broke resistance.

From The Blog of HORAN Capital Advisors

Aside from the fact the U.S government's debt continues to grow unabated and will certainly need to be addressed sooner versus later, the issue to play out near term is in Washington, DC. It is projected the U.S. government will reach its debt ceiling limit in early February. Ultimately, Congress will certainly increase the debt limit as they always do; however, the negative news flow might impact the equity markets in the short term.


Wednesday, January 22, 2014

Broader Implications Of A Weakening Retail Sector

It has been a while since I have seen so much written about the weakness impacting a particular segment of the market. In the recent case much is being written about the retail/discretionary sector of the market and its recent underperformance. This comes on the heals of the sector generating strong returns since the bottom of the financial crises in 2009.
  • Amazing run for consumer discretionary stocks (Charts etc.)
  • Q4 retail sales frozen by polar vortex (AlphaNow)
  • Caution: XRT underperformance puts retailers in focus (See It Market)
  • The first domino to fall: Retail-CRE (oftwominds)
The first chart below details the return of several discretionary segments of the market relative to the S&P 500 Index since 2006. The contraction in consumer spending that occurred through 2008-2009 is evident on the chart as well as the recovery from 2009 until today. In the second chart below the two retail/discretionary sectors are displayed, but over a shorter two month time period. The weakness within the discretionary/retail sector is clearly evident.

From The Blog of HORAN Capital Advisors

From The Blog of HORAN Capital Advisors

Thomson Reuters recently noted the weakness within the sector and the subsequent reduced earnings guidance. A number of retail stocks have exhibit market weakness: L Brands (LB), Abercrombie & Fitch (ANF), Best Buy (BBY) and Family Dollar Stores (FDO) to name just a few.

From The Blog of HORAN Capital Advisors

One concern associated with the weak performance of this sector is the potentially broader implications to the health of the overall consumer. The consumer (consumption) accounts for about 70% of of the economy or GDP. If the consumer is pulling back does this portend further weakness in the overall economy and hence the equity market? As the below chart displays, there is a high correlation with the retail sector price movement and the overall S&P 500 Index.

From The Blog of HORAN Capital Advisors
Source: See It Market

On the other hand, if the pervasive market sentiment is the consumer has rolled over, vis-à-vis the market and the economy, the efficient market hypothesis would imply this type of news is factored into current stock prices. We have written a number of posts on our blog regarding some of the weaknesses of the efficient market hypothesis as well as modern portfolio theory, but suffice it to say that significant stock price moves, up or down, suggests the markets are not fully efficient.

Concluding, the retail sector performance is a potential canary in the coal mine as it relates to the health of the consumer and the economy. The mixed financial and economic data we have cited in the recent past continues to be reported. As an example, Norfolk Southern (NSC) reported stronger earnings than expected today and the stock jump 4.7%. NSC is transporting materials and products for consumption. On the other hand, CSX (CSX) reported earnings last week and provided cautious guidance. CSX stock fell over 6% on the report. This mixed data picture is confounding investors at the moment. At HORAN, we do believe the consumer may have gotten ahead of itself; however, as one of the links in the introduction to this article notes, the wide spread cold weather could have had a negative impact on a number of brick and mortar retailers. The weaknesses in some consumer stocks is certainly worth paying attention to; however, the market/investor already knows a lot about this weakness and a majority of this bad news may be factored into stock prices. The question for investors is to evaluate specific company valuations relative to their anticipated growth expectations. The stocks that will fall the hardest on a missed earnings report are those that are trading at premium valuations.


Tuesday, January 21, 2014

Investor Letter: Is This An Equity Market Bubble

Last week we published our year end 2013 Investor Letter that reviewed highlights from the past year and more importantly our outlook for 2014. In the Investor Letter we comment on a recent report from Charles Schwab highlighting that the previous five year cumulative return of the S& P 500 Index at the end of 2012 was 9%. Just one year later, the previous five year cumulative return is a whopping 126%. Given the recent strong U.S. equity market returns, some investors are assessing whether the market has entered "bubble" territory.

We often caution investors that they should not look at historical returns alone to assess the market’s future direction. What seems obvious is to research the valuation of asset classes, sectors and/or specific companies with respect to expected future returns. We discussed this in our third quarter 2013 newsletter as we highlighted PE multiple expansion (i.e., increasing market valuation or PE) occurring from 2009 until today. One of the charts in our most current Investor Letter shows the S&P 500 P/E ratio is roughly equal to its long term average. However, a wider valuation measure takes the economic profit figure used in the calculation of GDP. This profit figure is an actual data point taken from company reported profits to the IRS. By using this valuation measure, the P/E is below its long term average.

Our specific thoughts on the year ahead can be read in our most recent commentary at the following link:
From The Blog of HORAN Capital Advisors


Monday, January 20, 2014

Rising Interest Rates Can Be Good For Stocks

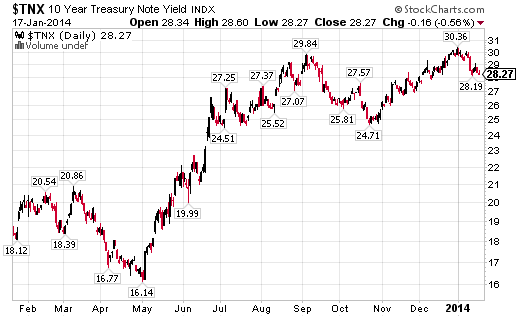
In December the Federal Reserve indicated they would begin reducing their bond buying (taper) at the rate of $10 billion per month starting in January. The bond market had certainly factored in this announcement and had expected this outcome to be announced at an earlier Fed meeting. The direct consequence of the taper discussion and ultimately its implementation is interest rates rose dramatically in the last two quarters of 2013. As the below chart shows, the 10-year Treasury yield rose from 1.61% in May to 3.03% at year end.

From The Blog of HORAN Capital Advisors

A result of this increase in interest rates is bond prices fell with most bond or fixed income categories generating negative returns for investors in 2013. If bonds are not a favored investment in a rising interest rate environment, and if rates trend higher in 2014, what is the likely impact of higher rates on stock prices?

The table below is provided courtesy of T. Rowe Price and from their Winter newsletter. The table details equity performance during periods of rising rates going back to 1970. During most of the rising interest rate periods, equity prices moved higher during this period of time.

From The Blog of HORAN Capital Advisors


One reason equities tend to move higher as rates rise is the fact rate increases are generally associated with an improving economic environment. The higher rates can ultimately hinder economic growth; however, at the onset of increasing rates, stocks tend to shrug off the higher interest rate move. Page 16 of the T. Rowe Price Report is a worthwhile read and goes into greater detail on this. If rates are increasing due to inflationary factors, a different outcome may occur. We wrote about stock prices and inflation in an earlier post, Where To Invest In An Inflationary Environment, that readers may find of interest as well. At this point in time we do not believe the stars are aligned that will give us significant inflation near term.

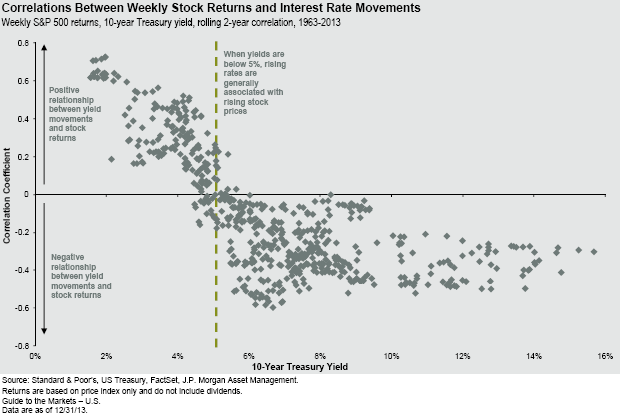
Lastly, one chart that made the rounds within the investment community recently was the one below showing equity correlation in a rising interest rate environment. This chart comes from J.P. Morgan's first quarter 2014 Guide To The Markets (page 12). The chart indicates when the rate on the 10-year treasury is rising from a level below 5%, stocks are positively correlated to the rate move, i.e., rates and stock prices move in the same direction. When rates are rising from a very low level, it is an indication rates are simply getting back to a more normalized level and this level does not inhibit economic growth. When rates are rising above 5%, this may occur because inflation is becoming an issue, the economy is beginning to grow too rapidly, etc. and this higher rate level could slow economic growth; thus, negatively impact corporate profit growth.

From The Blog of HORAN Capital Advisors

For investors, the Fed seems certain to begin tapering QE. If this reduced QE level does cause rates to rise further, bonds are likely to be a more challenging investment versus stocks in the coming year. We do believe if the tapering does cause a broader market disruption, the Fed will be quick to turn on the QE pump again. It seems the central banks around the world are addicted to this stimulus activity. An interesting perspective on this activity was discussed in the WealthTrack interview with Ed Hyman that we posted yesterday.


The Week Ahead Magazine: January 20, 2014

Below is the link to this week's Week Ahead Magazine. A number of articles provide commentary on last week's weak jobless report. Many are attributing the weakness to the wide spread cold weather experienced in the U.S. in December. Several additional articles in the magazine highlight recent fund flow data as well as a review of important data to be reported this week.


Sunday, January 19, 2014

A Constructive View Of Global Markets In 2014: Ed Hyman And Bill Miller Interview

Consuelo Mack of WealthTrack conducted a two part interview with Ed Hyman, ranked #1 economist for 34 years by Institutional Investor, and Bill Miller that reviewed 2013, but more importantly their outlook on 2014. Just as at the beginning of 2013, Ed Hyman continues to believe we are in an environment that is "pedal to the metal" in equities. He does caution though that 2014 could see a sell in May environment develop this year. Ed also believes the biggest potential surprise in 2014 is another 30+% market return. Ed notes it has been some time that economic growth is occurring globally. Certainly it is not strong growth, but it is not the contractionary environment that was thought to be taking place at the beginning of 2013. Bill Miller comments on investors under allocation to equities and disbelief in the markets moving higher from here. Although investors maybe stating they are constructive on the equity markets, their actions speak otherwise. Both of the below episodes are worthwhile interviews for investors to take the time to watch.


Thursday, January 16, 2014

Double Digit S&P 500 Returns Far More Common Than Single Digit Returns

A recent report by Liz Ann Sonders, Chief Investment Strategist at Charles Schwab, highlighted the fact that double digit calendar year returns for the S&P 500 Index are not that uncommon. As the below chart shows, returns greater than 10% have occurred 51 times out of 88 years since 1926. That is, double digit returns for the S&P 500 Index have occurred 58% of the time since 1926. In 73% of the calendar years (64 years), returns greater than 0% have occurred. Notable is the fact that single digit returns are far less common than double digit returns.

From The Blog of HORAN Capital Advisors


Sunday, January 05, 2014

The Week Ahead Magazine: January 5, 2014

The first full trading week of 2014 begins on Monday. This past week was a split one with the markets closed mid week due to the Christmas holiday. A number of the article links in this weeks magazine provide expectations for 2014 from various market pundits that readers may ind of interest. A few of the links provide a synopsis of this past year.


U.S. Equity Market Entering Euphoric Phase?

In the December newsletter of Absolute Return Partners and written by Niels C. Jensen, he provides a detailed discussion on whether the market has reached bubble heights. The newsletter contains a large number of charts circulated through the investment community during 2013 that seem to confirm that U.S. equities are in bubble territory. Niels Jensen provides commentary to many of these charts providing a counter argument to what the chart is actually depicting. The first chart in his newsletter is the one below and Jensen notes the 2013 return for the S&P 500 is far from an outlier.

From The Blog of HORAN Capital Advisors

As shown below in another of his charts, he discusses where the U.S. market might be in terms of the equity market cycle. The chart he highlights in the newsletter is from Goldman Sachs and is specific to Europe ex the U.K. In his commentary though he believes the U.S. market is closer to exiting the "growth phase" and entering the "optimism phase." Interestingly, the optimism phase is generally known for strong returns as investors become irrationally exuberant.
From The Blog of HORAN Capital Advisors

Might the S&P 500 produce returns in 2014 similar to 2013? No one has a crystal ball, but Jensen notes, "it is, after all, the most unenthusiastic rally I have ever experienced." At HORAN we to believe this market advance has felt like one of the longest "climb a wall of worry" rallies in some time.

Source:

Squeaky Bum Time
Absolute Return Partners
By: Niels C. Jensen
December 2013
http://www.arpinvestments.com/downloads/Absolute-Return-Letter/2013/The_Absolute_Return_Letter_1213.pdf


Dividend Payers Return Trails Non Payers In 2013

S&P Dow Jones Indices reports the equal weighted return of the dividend paying stocks in the S&P 500 Index trailed the non paying constituents in 2013. The equal weighted return of the payers totaled 40.67% versus the non payers return of 46.27%. However, for both groups, the equal weighted returns did outperform the overall cap weighted return of the S&P 500 Index which equaled 32.39%.

From The Blog of HORAN Capital Advisors
This outperformance by the equal weighted index resulted from smaller cap stocks within the index outperforming larger caps. A number of the larger cap stocks in the S&P 500 Index generated relative performance that was less than the overall index return. For example, Apple (AAPL, +7.6%), International Business Machines (IBM, -.5), Exxon Mobil (XOM, 19.8%) and Wal Mart (WMT, 18.1%) under performed the index while smaller caps like E-Trade (ETFC, +119.4%), Electronic Arts (EA, +58%), Genworth Financial (GNW, +106.6%), and First Solar (FSLR, +77.1%) generated significantly better returns than the overall index.

The below chart of the Guggenheim Equal Weighted S&P 500 Index ETF (RSP) is compared to the S&P 500 Index itself as well as a couple dividend paying ETFs: the SPDR Dividend ETF (SDY) and iShares Select Dividend ETF (DVY). The Guggenheim ETF outperformed the three other indices contained in the chart.

From The Blog of HORAN Capital Advisors

Lastly, the outperformance of smaller caps was evident in the capitalization based indices as well. The S&P MidCap 400 Index returned 33.5% and the S&P SmallCap 600 Index returned 41.3% in 2013.

Disclosure: Long XOM


Friday, January 03, 2014

The Volatile Bullish Sentiment Measure Experiences Significant Decline

This week's bullish sentiment reading reported by the American Association of Individual Investors declined 11.97 percentage points to 43.09% versus last week's bullish reading of 55.06%. The changes in this indicator from week to week are volatile and investors should evaluate a multi-period average for a better gauge of the sentiment's direction. With this said the 8-period moving average of the bullish sentiment reading declined slightly this week to 43.8%. As a point of reference, the average of the 8-period moving average of the bullish sentiment reading is 39% with a standard deviation of plus or minus 8%. This measure is a contrarian one and is most predictive at its extremes.


From The Blog of HORAN Capital Advisors
Source: AAII


Wednesday, January 01, 2014

Expectations For The Market In 2014

We have written many times on this blog that the simple change of one calendar day to another should not drive one's investment decisions. Just as investors are faced with the last trading day of 2013, Thursday will begin the first trading day of 2014. In spite of the opening sentence in this post, and a new year seeming to reset the clock, what is the likely market return in the coming new year?

The difficulty in predicting the market's return in 2014 is the fact one's point of reference is greatly influenced by the very strong returns achieved in 2013. The S&P 500 Index returned 32.39% in 2013. This strong market return is not a frequent occurrence; however, it has occurred in the past. The below chart is a snapshot of annual market returns for the S&P 500 Index going back to 1980. During the mid 1990's (1995 - 1999) the market was able to string together outsized gains for five consecutive years. Could 2014 be another year that rewards equity investors with strong returns?

From The Blog of HORAN Capital Advisors

Following are a couple of technical and fundamental market factors that are influencing HORAN's view of the market in the coming year. Some of these factors point to a positive market return this year while others point to negative influences.

Doug Short at Advisor Perspectives wrote a detailed article on margin debt. Currently, nominal margin debt is at an all time high and the below chart shows this level of margin debt has been associated with market tops. If investors are fully leveraged their additional buying power is limited.

From The Blog of HORAN Capital Advisors

On the flip side of the high margin debt issue is the high level of short interest on S&P 500 holdings. Todd Salamone of Schaeffer's Investment Research wrote an article, Why Stocks Could Be Set For a First-Quarter Surge, and includes a discussion on the high level of short interest as noted in the below chart. The Salamone article also details many market positives and a few market negatives that might impact the equity market in 2014.

From The Blog of HORAN Capital Advisors

Short covering may be a necessary factor to push equity prices higher this year. When looking at investors' mutual fund asset allocation it appears they are heavily weighted towards equities. The below chart details assets in money market and fixed income funds as a percentage of total mutual fund assets. The weighting in this non equity class is at near record lows. A major influence of this low weighting is the fact equity market returns were so strong last year; thus, pushing equity values to high levels.

From The Blog of HORAN Capital Advisors

In spite of the apparent low level of investor assets allocated to money market and fixed income investments, mutual fund flows would suggest the rotation out of fixed income investments into equities has only just begun as noted in the below chart. Not until 2013 did investors begin to rotate into equities. A recent article on the Minyanville website cites ICI data noting, "investors responded to 2013's climate by putting $160 billion of new money into equity mutual funds (investment flow data from ICI), a dramatic shift in a market that saw five straight years of outflows totaling $536 billion." One concern is the equity markets have had strong returns over the last five years and investors are just now rotating into equity investments. Individual investors could be arriving late to the bull market party, as they have a tendency to do.

From The Blog of HORAN Capital Advisors

From a fundamental perspective, the economy does seem to be strengthening. Real GDP in the third quarter of 2013 was revised higher to 4.1%. This is certainly a respectable rate of economic growth; however, the GDP growth rate since the end of the recent recession is below the rate of growth experienced by the economy coming out of prior recessions.

From The Blog of HORAN Capital Advisors

From an earnings perspective Thomson Reuters reports Q3 2013 earnings growth at about 6%. Earnings growth in Q4 of 2013 is expected to come in at 7.6%. Some of this earnings growth, however, has come by way of companies repurchasing their own stock. This has had the effect of inflating earnings per share growth since reported income is divided by fewer shares outstanding. We noted this strong buyback activity in a blog post a few weeks ago, Stock Buybacks Continue At A Strong Pace Through The Third Quarter. The expected earnings growth rate for all of 2014 is currently estimated at 10%. Top line revenue growth is forecast at about half this growth rate at 5.7%. Importantly, we believe companies will need to generate top line growth commensurate with expected earnings growth if 2014 returns are on par with returns in 2013.

Lastly, as noted in the first chart in this post, the market can generate outsized returns for multiple years in a row, i.e., the mid 1990's. Will 2014 resemble a year similar to the mid 1990's? A common theme evident in the mid '90's period was the phenomenon of PE multiple expansion. We touched on this factor on page 2 of our third quarter 2013 Investor Letter. The first chart below represents the period 1994 -1998. The second chart is the period 2007 - 2013.

From The Blog of HORAN Capital Advisors

From The Blog of HORAN Capital Advisors

Two economic variables that are different now versus the mid 1990's is the level of GDP growth and the direction of interest rates. Multiple expansion is much easier to achieve in an environment where interest rates are falling due to how analysts value future earnings in a discounted cash flow model. In general, as interest rates decline, future earnings are valued higher in the current year period. In the mid 1990's the 10-year Treasury rate fell from 7.8% at the beginning of 1995 to a low of 4.5% before rebounding to 6.28% in 1999. This declining rate factor was a tailwind for multiple expansion. Today, the interest rate environment is completely different. In July of 2012 the 10-year Treasury yield reached 1.4% and now stands at just over 3%. This higher rate level (and the direction) makes future earnings worth less in today's discounted cash flow models and serves as a headwind to multiple expansion. Multiple expansion can still occur when the economic growth rate is picking up steam though. This occurs because investors expect company earnings to grow more quickly as the economic climate improves. Certainly the third quarter GDP report is suggestive of this. In 2014, a faster growing economy will be an important factor in order to generate outsized returns in the equity market.

What is evident from the above factors is the fact the data is mixed in regards to technicals as well as fundamentals. This mixed type of data has been prevalent since the end of the financial crisis and is likely a factor that has prevented investors from appearing to go 'all in' on stocks. There are a number of other factors we are reviewing at HORAN Capital Advisors in assessing the markets in 2014. For our readers though, we hope this provides you with a few of the potential influences that may impact the market in 2014. We will provide additional insights in our upcoming quarterly investor letter. We wish all of our clients and readers a healthy and prosperous New Year!


Sunday, December 29, 2013

Retirement Crisis

Chip Castle, a managing Director at Blackrock, recently wrote an article about the the lack of savings by individuals looking to retire. The article, Retirement in 2014: It’s Your Number that Counts, highlights a number of facts that point to the savings shortfall of potential retirees. A few of the facts noted in the article:
  • $6.6 trillion: That’s what the Center for Retirement Research has estimated as the gap between what people will need in retirement and what they have saved.
  • 20 years: A generation ago, when most of the current retirement system was created, life expectancy at 65 was 5 to 7 years. Today, it’s closer to 20 years, meaning if you retire at age 65, retirements are three times as long.
  • 65%: Building on the last point, a couple at age 65 has a 65% chance of one of them reaching their 90th birthday.
The article is a worthwhile read for investors looking to to make a few financial resolutions in the coming year. HORAN's financial planning director also wrote an article, A Retirement Crisis: Sound the Alarm, earlier in the year that also cited the crisis for those seeking to retire. His article provides a link to a survey by Employee Benefit Research Institute noting the lack of confidence of workers in their ability to retire due to insufficient savings.


The Week Ahead Magazine: December 29, 2013

With less than two full trading days remaining in 2013, investors likely will be looking ahead to what the market has to offer in 2014. Just because the year changes from 2013 to 2014, a one day advance on the calendar should not result in major changes in ones investment approach. On the other hand, the new year is a good time for investors to evaluate their financial health. Several of the articles in this week's magazine provide links to articles containing a list of financial resolutions for investors to consider. Also included in the magazine are several links to articles containing a discussion on interest rates and their potential impact on bond values in 2014. With Fed tapering underway investors need to be aware of the impact a rising interest rate environment can have on their investment portfolio.With that, below is the link to the last magazine of 2013. All of us at HORAN wish our clients and readers a Healthy and Prosperous New Year!


Saturday, December 28, 2013

Very Few 'No Dividend/No BuyBack' Companies In The S&P 500 Index

Early this past week we wrote about the strong stock buyback activity by S&P 500 companies. For investors selecting their favored stock purchases from the list of companies that comprise the S&P 500 Index, they have not have difficulty finding a company that pays a dividend or has bought back their stock this past year.

In a recent report by Factset it is noted,
  • Just 16 companies in the S&P 500 (3.2%) did not pay a dividend or engage in a share buyback over the trailing twelve month period.
  • As recently as Q1 2010, more than three times as many companies (49, or 9.8%) did not make either form of distribution. 
  • Concurrently, the number of companies engaging in both forms of shareholder distribution reached the highest level since at least 2005 (369, or 73.8%).
    From The Blog of HORAN Capital Advisors
    Source: Factset

    The Factset report goes on to note that the no buyback/no dividend companis tend to be the smaller ones within the index; however, there are a few notable exceptions, Amazon (AMZN) and Google (GOOG).  In the case of Google, the report notes, "Google...had free cash flow just shy of $12 billion over the trailing four quarters. The company also has cash and short-term investments of $57 billion, which grew 23.6% year-over-year.

    Lastly, with this heightened level of buyback activity, investors need to be aware of the impact buybacks have on reported earnings per share for companies. In the case where the buyback reduces the share count, this can distort the actual earnings growth being achieved by the respective company. Additionally, as we noted in a post in early 2012, companies have a practice of buying back shares at elevated price levels as can be seen in the below chart.


    Disclosure: Long GOOG


    Friday, December 27, 2013

    Job Openings Continue To Increase

    Yesterday the U.S. Labor Department reported weekly jobless claims fell 42,000 to 338,000. According to to a Reuters article, Moody's Analytics' analyst Ryan Sweet said, "The underlying trend remains favorable. We will be able to muster stronger job growth in 2014." On the surface it does appear the job market is improving.

    Several weeks ago the bureau of labor statistics reported the unemployment rate fell to 7% from the previous months rate of 7.3%. Although the participation rate improved slightly to 63% the rate remains below the pre-recession rate of 66%. If the participation rate equaled the pre-recession level, the unemployment rate would total 11.4% as detailed in the below chart. This is a rate that is not much better than at the end of the recession. This higher unemployment rate is the result of including an additional 7 million individuals in the labor force at the higher participation rate.

    From The Blog of HORAN Capital Advisors

    On the other hand, the December Job Openings and Labor Survey (JOLTS) release shows there were nearly 4 million job openings at the end of October. This is nearly double the openings at the end of the recession. The JOLTS report shows job openings continue to increase at a steady rate. The individual groups having the most difficulty finding a job are teenagers (20.8% unemployment rate) and those individuals that have less than a high school diploma (10.8% unemployment rate).

    From The Blog of HORAN Capital Advisors

    With the increased number of job openings, further improvement in the level of employment may occur into 2014. This could serve as a positive in a number of ways, i.e., more consumers, less government outlays, etc.


    Thursday, December 26, 2013

    Individual Investors May Be Overly Bullish

    As reported by the American Association of Individual Investors today, bullish investor sentiment increased nearly eight percentage points to 55.1%. This increase pushes the bullish sentiment level above the +1 standard deviation level and is the highest reported bullish sentiment reading since reaching 63.3% during the week of December 23, 2010. The sentiment measure surveys AAII's individual investors about their view of the market for the next six months.

    From The Blog of HORAN Capital Advisors
    Data Source: AAII

    In addition to an elevated bullishness reading, the bull/bear spread has increased 37% and this spread is the highest since AAII reported the spread at 47% for the week of December 23, 2010.

    From The Blog of HORAN Capital Advisors
    Data Source: AAII

    As noted in the past, these sentiment readings can be volatile from week to week. Included in the first chart is the 8-week moving average of the bullish sentiment reading and although elevated it remains below the level reached in December 2010. Importantly though, these sentiment measures are most predictive at their extremes and it appears the individual investor is certainly viewing the market in a more favorable light.


    Wednesday, December 25, 2013

    Mid Term Election Year Market Return

    Historically, the average S&P 500 Index return in post election years has equaled just over 5% as we noted in a post at the beginning of 2013. For certain this year has been anything but an average one with the S&P 500 Index up over 28% on a price only basis at the time of this writing. As 2013 comes to an end and investors begin to look at 2014, mid term election years tend to be more volatile during the first half of the year. Chart of the Day provides insight into mid term election years noting,
    "Today's chart illustrates how the stock market has performed during the average mid-term election year. Since 1950, the first nine months of the average mid-term election year have tended to be subpar (see thick blue line). That subpar performance was then followed by a significant year-end rally. One theory to support this behavior is that investors abhor uncertainty. To that end, investors tend to pull back prior to an election when the outcome is unknown. Beginning in early October, however, the outcome of the election becomes increasingly apparent and investors respond by positioning their portfolios accordingly."
    From The Blog of HORAN Capital Advisors


    Tuesday, December 24, 2013

    Better Investing Members Favored Stocks

    From time to time I provide a list of the most favored stocks purchased by Better Investing Magazine's members. The recent top 10 stocks reported by its members as of December 24, 2013 are detailed below.


    Monday, December 23, 2013

    Stock Buybacks Continue At A Strong Pace Through The Third Quarter

    Today, S&P Dow Jones Indices reported preliminary buyback activity through the third quarter of 2013 continued at a strong pace. S&P noted in the report that buybacks are at their highest level since the fourth quarter of 2007. A couple of notable facts from the report,
    • "For the 12 month period (ending September 2013), S&P 500 issues increased their buyback expenditures by 15.0% to $445.3 billion from the $387.3 billion posted in the prior 12 month period. The high mark was reached in 2007, when companies spent $589.1 billion over the 12 month period. The recession low point for a quarter was $24.2 billion, recorded in the second quarter of 2009."
    • Howard Silverblatt, Senior Index Analyst at S&P Dow Jones Indices, notes, "...we are starting to see excess buying, where the repurchases outnumber the issuance, and therefore reduce the share count. The lower share count leads to higher EPS, and the market likes higher EPS (emphasis added)."
    From The Blog of HORAN Capital Advisors


    Source:
    S&P 500 Stock Buybacks Increase In Third Quarter; Buybacks at
    Their Highest Level Since the Fourth Quarter of 2007
    S&P Dow Jones Indices
    By: Howard Silverblatt, Senior Index Analyst
    December 23, 2013
    http://tinyurl.com/kb7ush3


    The Week Ahead Magazine: December 22, 2013

    As we noted in last week's magazine, the stock market has a tendency to finish calendar years in strong fashion. To that end investors have not been disappointed so far. As the end of the year is fast approaching, some of the links in this week's magazine look at consumer sentiment, fund flows and, of course, a report on the Dogs of the Dow strategy for 2013. This week's magazine is a day late in posting as I was traveling over the weekend.


    Sunday, December 15, 2013

    The Week Ahead Magazine: December 15, 2013

    According to the Wall Street Journal (link in this week's magazine) "...over the past 100 years...stocks endure a mid-December dip most years. Stocks tend to rise at the start of the month, pull back in the middle and bounce at the end. Then they keep rising at the start of January. Charts show this happening on average over the past 100 years, 50 years, 20 years and 10 years. The late-December recovery is so common it has a Wall Street nickname: the Santa Claus rally." With two weeks of trading remaining in the year investors will witness whether a Santa Claus rally indeed develops. Several article links in this week's magazine highlight the Santa Claus rally phenomenon as well as links to a few strategists' 2014 forecast.


    Saturday, December 14, 2013

    Technically The Market May Be Nearing A Bottom?

    It is always difficult for investors to guess the bottom of a market correction (or pullback) or time the turning point with pin point accuracy. The difficulty is more clouded today given the Fed's quantitative easing activities and now the timing of the Fed's so called tapering. In the long run economic and company fundamentals are the driving force behind the market's performance and the performance of individual companies for sure. With the strong equity market performance so far in 2013 investors might be enticed to lock in their paper gains. The recent selling pressure experienced by the equity markets might be just that, locking in some gains or tax loss selling.

    It seems so long ago, but on the first page of our first quarter investor letter we discussed the calendar year returns for the S&P 500 Index going back to 1980 and included a graph with the maximum correction in each of those years. Interestingly, we believe we may be in a period today that resembles the mid 1990's where multiple expansion was a critical factor in the strong equity market returns achieved at that time. We discussed multiple expansion in our third quarter investor letter. The point in repeating this commentary is what is different today than at the beginning of 2013?
    The above are just a few favorable economic data points. At HORAN we continue to believe the economy is improving but at a slow "bounce off the bottom" pace. 

    Correction: 12/17/2013
    Now looking at a few equity market technicals, an interesting one is the equity put/call ratio. As the below chart shows, this ratio has spiked higher to a level not seen since June of 2012. At the market close today the ratio equaled .83. In late October, early November, of 2012 the equity put/call ratio was at near the same level as today. At that time the S&P 500 Index was trading just below 1,400.


    Following the posting of this article last week a reader noticed a difference in the put/call ratio reported above and a graph in the original post and that reported by the CBOE. Our original commentary and graph was CBOE data received from a third party and the reported p/c ratio was incorrect. The correct ratio at the close on Friday was .53. The below graph is an update with the corrected data. (Our practice is to strike through the original commentary and replace with the updated data if we make the change more than a 2 hours after the post.)


    From The Blog of HORAN Capital Advisors

    As we noted in our November 2012 article,
    "the equity P/C ratio tends to measure the sentiment of the individual investor by dividing put volume by call volume. At the extremes, this particular measure is a contrarian one; hence, P/C ratios above 1.0 signal overly bearish sentiment from the individual investor. This indicator's average over the last 5-years is approximately .7 .64..."
    Additionally, the below chart shows a few more technical indicators that may indicate the market is approaching oversold levels. Specifically, the fast component of the stochastic oscillator has reached oversold levels. The slow calculation has not, however, as noted above, it is difficult to time the exact bottom of the market. Also, the money flow indicator (MFI) is nearing a level indicative of an oversold market as well. Key market support for the S&P 500 Index is the 1775 level and bullish investors have been able to hold this level.

    From The Blog of HORAN Capital Advisors

    At the end of the day, economic and company fundamentals are improving albeit at a slow pace. Recent selling activity may have more to do with tax loss selling and some investors locking in gains achieved so far this year. Technically, some indicators indicate the market is near an oversold level (and difficult to predict the bottom) with one wild card being the Fed's tapering impact and timing as the market is focused on the negative consequences of tapering. Lastly, the debt ceiling debt will be top of mind as we approach an early February 2014 deadline for that.


    Sunday, December 08, 2013

    The Week Ahead Magazine: December 8, 2013

    With year end fast approaching investors are focused on retaining the equity gains earned on paper during the first eleven months of this year. Market returns during the first week of December would have been worse had it not been for the strong recovery on Friday in positive reaction to the jobs report. Other headline economic news was favorable as GDP was revised higher to an annual rate of 3.6%. Much of this gain, however, was centered on an increase in private inventory investment. With one less week between Thanksgiving and Christmas this year, all eyes will be on news that provides insight into retail sales. With that, enjoy this week's magazine as the second week of December unfolds.


    Saturday, December 07, 2013

    Positive Investor Equity Sentiment Has Not Translated To Overly Positive Equity Flows

    One chart we have shared recently with our clients during our portfolio reviews with them is the chart of the S&P 500 Index overlayed with equity mutual fund flows. The strength of the market's advance since 2009 would seem to suggest investors have jumped head first into stocks. Additionally, a number of recent market reports have opined on the elevated sentiment levels (here and here). High bullish sentiment has tended to be one technical indicator suggesting a market top may be near. However, as the below chart shows, flows into equity funds have just recently turned positive.

    From The Blog of HORAN Capital Advisors

    Maybe more importantly, flows out of fixed income investments have only been occurring for the last five months as noted in the first chart below. In the second chart below cumulative flows are shown beginning in 2009. The cumulative flow chart shows investors continue to have a large amount of their investments in fixed income investments based on the flows contributed to fixed investments since 2009.

    From The Blog of HORAN Capital Advisors

    From The Blog of HORAN Capital Advisors

    One question that comes to mind is what event causes investors to reduce their fixed investments. One such event may begin to unfold as investors open their account statements at the end of the year and see the magnitude of the decline in the value of the fixed portion of their account. As the below chart shows, the 10 year Treasury yield has increased from 1.63% to 2.88% from May 2nd to December 6th. Although the absolute level of the 10 year Treasury yield does not seem high, the negative impact on the value of fixed income investments has been significant. The iShares 20+ Year Treasury Bond ETF (TLT) has declined 17% during this period of rising interest rates.

    From The Blog of HORAN Capital Advisors

    So, although some of the sentiment indicators may be elevated, based on the amount of flows into bonds since 2009, more reallocation from fixed to equity can occur in the foreseeable future and be supportive of higher equity prices. Certainly economic and company fundamentals will need to be favorable as well.


    Sunday, December 01, 2013

    The Week Ahead Magazine: December 1, 2013

    With the holiday shortened trading week occurring in the last week of November, the S&P 500 Index managed to generate a small 1.05 point gain for the week. This represented the eighth straight week the S&P 500 Index generated a positive weekly return. For investors the fourth quarter is looking like a winning one with both October and November resulting in positive market returns. The question is whether or not the month of December can carry on this favorable trend.

    Given the strength of the market this year, there is much discussion about the market trading in bubble territory. A few of the articles in this week's magazine provide links to posts that focus on this bubble discussion. Additionally, most S&P 500 companies, and all of the Dow companies, have reported earnings for the third quarter. Several article links discuss earnings results relative to stock valuations. Below is the link to this week's magazine that provides some thoughts on the first trading week in December.