Saturday, December 29, 2012

A Look At The Top 1% Of Taxpayers, Government Revenues/Expenses And The Deficit

Politicians have just a few days remaining to come up with some resolution to the fiscal cliff facing the country. It appears the resolution will be another "can kick" that mostly increases taxes. The President's income break point is often stated to by $250,000 while House Speaker John Boehner's Plan B had higher taxes for those with incomes above $1 million. The problem with focusing only on increasing taxes and generating more revenue is the fact that the expense side of the budget needs to be dealt with as well. The revenue generated from the higher proposed tax rates would only fund the government for eight days. As the below chart shows, expenses have spiked significantly subsequent to the recession with a deficit that remains alarmingly high at over $1 trillion per year.

From The Blog of HORAN Capital Advisors

Mark Perry, Professor of Economics at the University of Michigan, recently analyzed IRS data available through 2010 for taxpayers in the top 1% versus those in the bottom 95%. Taxpayers with income above $221,000 would fall in the top 1% of income earners in 2010. What his analysis of the data shows is:
  • "the 1.35 million taxpayers that represent the highest-earning one percent of the Americans who filed federal income tax returns in 2010 earned 18.9% of the total gross income and paid 37.4% of all federal income taxes paid in that year."
  • "the 128.3 million taxpayers in the bottom 95% of all U.S. taxpayers in 2010 earned 66.2% of gross income and that group paid 40.9% of all taxes paid."
  • "in other words, the top 1 percent (1.35 million) of American taxpayers paid almost as much federal income tax in 2010 ($354.8 billion) as the entire bottom 95% of American tax filers ($388.4 billion)."
  • "about half (58 million) of the bottom 95% of American “taxpayers” paid nothing or got a tax refund."
The below chart, which appears in his article, details the the increasing share of taxes paid by the top 1% of taxpayers since 1980.

From The Blog of HORAN Capital Advisors

Broadening the base of taxpayers, even at a minimal level, would get more of the population in tune to the budget consequences facing the U.S. The below chart displays a ten year time period, but the same holds true going back to the 1980's, noting there has not been a single year since the 80's where the government actually cut spending. That is, the absolute dollar level of spending never declined. The spending side of the government's ledger is as large of an issue as is the revenue side.

From The Blog of HORAN Capital Advisors


Wednesday, December 26, 2012

A Need To Focus On Government Outlays

It would be hard to envision that the public has not heard about the fast approaching fiscal cliff. What seems lost in the narrative of the media and their focus on raising tax rates, is the fact government spending continues to consume a larger share of the government's budget.

As the below chart indicates, the CBO is forecasting social security and medicare payments to account for a larger and larger share of the budget as far as the eye can see. Addressing the growth in these programs will be required in order to provide any dent in the current budget deficit.

From The Blog of HORAN Capital Advisors

The result of going over the fiscal cliff doesn't address the spending either. The cliff impact has tax hikes exceeding spending cuts by a 3:1 margin. One reason for this outcome is the fact Washington's "baseline" budgeting definition means simply lowering the growth rate of spending counts as a cut in spending. A recent Wall Street Journal article, The Baseline Budget Con ($), addressed this budget gimmick.

From The Blog of HORAN Capital Advisors


Saturday, December 22, 2012

Fiscal Cliff Not Resulting In Dividend Cliff

One of the most popular investment topics in the fourth quarter has to do with the impending fiscal cliff discussion taking place in Washington, DC as can be seen in the Google Trends graph below. One area of interest for investors is the impact on the taxation of dividends if Washington policy succumbs to going over the cliff. Going over the cliff would result in the tax rate on dividend income increasing to as high as 43.4% versus the current 15% rate.


Interestingly, this potentially higher tax rate does not seem to be having a "negative" impact on the long term dividend policy for companies. Factset Research notes in their Dividend Quarterly report for Q3:
  • aggregate dividends per share (“DPS”) grew 15.5% year-over-year at the end of Q3.
  • the number of companies paying a dividend in the trailing twelve-month period again surpassed 400 (80% of the S&P 500 index).
  • the S&P 500 also hasn’t shown a slowdown in companies initiating dividend payments. In Q3, 3.0% of non-payers “initiated” dividends, which is nearly triple the average over ten years (1.2%).
  • the aggregate dividend payout ratio is 2.0% below the ten-year median, it is at its highest level (29.1% at the end of Q3) since the recession (when payout ratios were distorted by low aggregate earnings during the recession...).
  • while there have been a number of companies that are signaling short-term changes in dividend policy or a shift towards more share buybacks..., a majority of companies have not yet responded, including the top ten dividend-payers in the S&P 500.
  • the aggregate, forward twelve-month DPS estimate for the S&P 500 was 10% above the actual trailing twelve-month (“TTM”) payout at the end of November, which is a premium that is well above the ten-year average of 3%... Also, even when excluding the periods during the financial crisis (when forward DPS estimates fell below trailing figures), the forward consensus premium is in-line with the stabilized average starting in 2011.
    One reason dividend practices may not be changing for a large majority of companies may be due to the fact that many shareholders own company stock in retirement accounts and/or shares are held by foreign investors. In Factset's Dividend Quarterly one Treasurer cites this very fact.

    Lastly, just to reiterate a point about dividends versus buybacks we have made on this blog in the past is the fact divdend payments are more consequential when evaluating companies. We prefer dividends since company practices around their dividend policy offer more insight into potentially negative financial outcomes since firm's are less likely to cut dividends. For example, companies may take on debt in order to maintain adherence to a certain dividend growth rate. This may result in debt/equity levels increasing as well as payout ratios increasing. These are red flags for investors and may enable investors to reduce positions before negative financial results are reported. Conversely, company buyback announcements maybe just that and do not equate to a longer term commitment of a company's cash flow. It is far easier for a company to come up short on their buyback program than to announce a change in their dividend policy. As the below chart notes, the number of companies making buybacks and the aggregate dollars spent on buybacks has been on the decline since the fourth quarter of last year.


    Source:

    Factset Dividend Quarterly (PDF)
    By: Michael Amenta, Research Analyst
    Facset Research
    December 19, 2012
    http://www.factset.com/websitefiles/PDFs/dividend/dividend_12.19.12

    Factset Buyback Quarterly (PDF)
    By: Michael Amenta, Research Analyst
    Facset Research
    December 20, 2012
    http://www.factset.com/websitefiles/PDFs/buyback/buyback_12.20.12


    Sunday, December 16, 2012

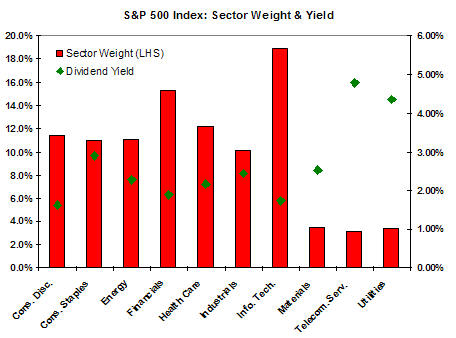
    Technology Sector Largest Contributor To S&P 500 Yield

    As of December 11, 2012, the dividend yield for the S&P 500 Index equaled 2.27%. The largest contributor to the index's yield is now the technology sector, contributing 14.6% of the index's dividend income. This compares to the technology sector's income contribution at the end of 2011 of 10.29%. The sector experiencing the largest decline in contribution to the index yield is the consumer staples sector, declining from 15.6% in 2011 to 14.0% as of the close on 12/11/2012.

    From The Blog of HORAN Capital Advisors

    Given the technology sector's weighting in the index at 18.9%, and the popularity of dividends, it is not surprising that technology stocks are a significant contributor to the income yield for the index in spite of the tech sector having the second lowest yield at 1.74%. Additionally, the index is cap weighted and three of the top 10 index stocks are technology ones, Apple (2.1% yield), IBM (1.8% yield) and Microsoft (3.4% yield). These three stocks account for nearly 40% of the weighting of the stocks in the technology sector.

    From The Blog of HORAN Capital Advisors

    Data Source: Standard & Poor's


    Monday, December 10, 2012

    The Arithmetic Of Equities

    The research paper noted below, a good read, has been making the rounds over the weekend. The report discusses bond valuations relative to stocks and when one asset class appears more attractive than the other. The paper's author, Andrew J. Redleaf of The White Box Advisor, states he is really a "bond guy" but notes the following:
    "Basically I am a bond guy. I like fat coupons. And I like return of principal. But I take my bonds where I can find them. And these days the place to find fat coupons and return of principal is among blue chip equities."
    Arithmetic-of-Equities

    h/t: Market Folly


    Another Record In Food Stamp Usage

    The United Stated Department of Agriculture reported individuals receiving food stamps (Supplemental Nutrition Assistance Program) increased by 607,559 to 47,710,324 individuals in September versus August's enrollment. The number of households receiving food stamps increased just under 300,000 to 22,973,698. These are record levels of usage for the program with monthly cost totaling over $6.4 billion, nearly doubling in just four years. This data is further confirmation that Friday's job report (discussed yesterday's post: Not So Golden Retirement Years Is Fallout From Weak Friday Employment Report) was not as strong as the reported unemployment rate might suggest.

    Chart Source: Zero Hedge


    Sunday, December 09, 2012

    Fiscal Cliff Creating A Spike In Extra Dividends

    An outcome of going over the fiscal cliff is the tax rate on dividends would increase to as high as 43.4% versus the current rate of 15%. In response to this higher dividend tax rate companies are initiating special dividends to be paid before year end. As the below chart shows, in the month of November, 228 companies have announced their intention of paying a special dividend as compared to the 97 companies last year. These numbers are based on common stocks (non-funds) listed on the ASE, NYSE, NGM, NNM and NSC. The pace of extra dividends does not seem to be slowing in December.


    Saturday, December 08, 2012

    Not So Golden Retirement Years Is Fallout From Weak Friday Employment Report

    Although Friday's Employment Situation Report (PDF) indicated non farm payrolls rose 146,000, not much else was positive about this report.
    • those not in the labor force rose 542,000
    • the civilian labor force fell by 350,000
    • the number of employed declined 122,000
    • discouraged workers rose 166,000, and
    • the participation rate fell two tenths of a percent to 63.6%
    From The Blog of HORAN Capital Advisors

    For those nearing retirement age, it is turning into a not so golden one as more seem to be working longer. Certainly the fact individuals are living longer is contributing to older workers working longer. However, the retirement nest egg for those nearing retirement has been damaged over the last 12-years by the technology bubble, the real estate bubble and the Fed's effort to keep interest rates at record low levels.

    From The Blog of HORAN Capital Advisors

    A consequence of older Americans working longer along with an anemic pace of economic growth is the employment level for those under age 55 has declined. As the below charts shows, the number of employed for those age 16 - 19 is at a level last seen in the mid 1960s. Additionally, for those under the age of 55, the employment level is no higher than where it was in 1997.

    From The Blog of HORAN Capital Advisors
    Chart: h/t: ZeroHedge

    Additionally, the slow pace of economic growth has resulted in a low (if at all) level of private sector job growth generating less revenue  for the government and increasing government payments on food stamps and unemployment claims. The government's new fiscal year began on October 1st and since that time, it is borrowing 46 cents for every dollar spent. This is a path that is not sustainable. The uncertainty or circus taking place in Washington at this point in time is perpetuating an environment that makes it difficult for business to plan. The end result is an economy that is stuck in neutral.


    Sunday, December 02, 2012

    Implications Of An Elevated Equity Risk Premium For Asset Allocation

    Assessing the equity risk premium (ERP) is an important factor for investment professionals and corporate finance officers. I will forgo discussing the importance to a CFO in assessing the ERP and focus on investment professionals. Given the importance of the ERP one will find a surprising amount of disagreement around how to determine the appropriate ERP level. One can perform a "Google search" on "equity risk premium" and find an inordinate amount of research on the topic.

    For investors though, determining the appropriate ERP level should play a part in ones asset allocation decision. In short, the equity risk premium quantifies the additional rate of return an investor requires to compensate for the risk of investing in stocks versus a risk free asset, the 10-year treasury bond in this case. If an investor has a view that the market is under valued and likely to go higher, then one's view is the ERP will decline in the future. Conversely, if the investor has a view that the market is over valued and likely to go lower, then the investor believes the ERP will increase in the future. As can be seen with the green line in the below chart, the ERP is trading at near a historically high level. The basis for the calculation of the ERP is the earnings yield for the S&P 500, that is, the inverse of the index's P/E ratio.

    From The Blog of HORAN Capital Advisors

    As I noted, the ERP calculation used in the above chart is based on the market's earnings yield. Essentially, this is an ex post calculation and what is most important for an investor is the prospective expected market returns or ERP. For readers that are interested in a more detailed discussion of the ERP, Aswath Damodaran, a professor at Stern School of Business at New York University, published a paper (and is frequently updated) on the various methods utilized in calculating the ERP.

    Based on the current ERP level, the high excess return expected for the market, an investor should consider allocating a larger percentage of their assets to equities versus the risk free treasury bond asset. However, I have discussed several times about the fact investors continue to seek out bond investments versus equity investments based on fund flow data. The recent fund flow release from ICI continues to note the flow of funds out of equities and into bonds. Given the relatively high ERP, why are investors not allocating more investment dollars to stocks versus bonds?

    Although investors my not allocate larger dollars to equities, this doesn't mean stocks won't generate returns in excess of bonds. From a behavioral perspective investors tend to fear losses more than missing out on gains. With the number of negative market shocks investors have experienced since the year 2000, tech bubble, financial market crisis and the real estate bubble, this fear of loss is not surprising. Additionally, the markets hate uncertainty and events in Washington, D.C. have done anything but create more uncertainty.

    The below chart of the U.S. Economic Uncertainty Index is at its highest level other than the level reported at the height of the debt ceiling debate in August last year. The on again off again fiscal cliff discussions in Washington also include approval to raise the U.S.'s debt ceiling. The debt ceiling debate in 2011 was not a positive for the equity markets.
    From The Blog of HORAN Capital Advisors

    At the end of the day, investors not only need to have a longer term horizon to invest in equities, but they need to have tools to help evaluate the potential direction of the ERP. There are several variables investors can utilize, like the Index of Leading Economic Indicators. This is important as it provides insight into the direction of the economy and hence the impact on corporate earnings. Also, investors can look at the consumer confidence index due to its inverse correlation to the ERP.

    From The Blog of HORAN Capital Advisors

    An article in the Journal of Investment Consulting, Does the Stock Market's Equity Risk Premium Respond to Consumer Confidence or Is It the Other Way Around?, provides support that so long as consumer confidence does not remain at near historical lows, long term investors can find the current risk/reward of the equity market attractive. The cited research in the article indicates satisfactory equity returns can be achieved with relatively low downside risk.


    Saturday, December 01, 2012

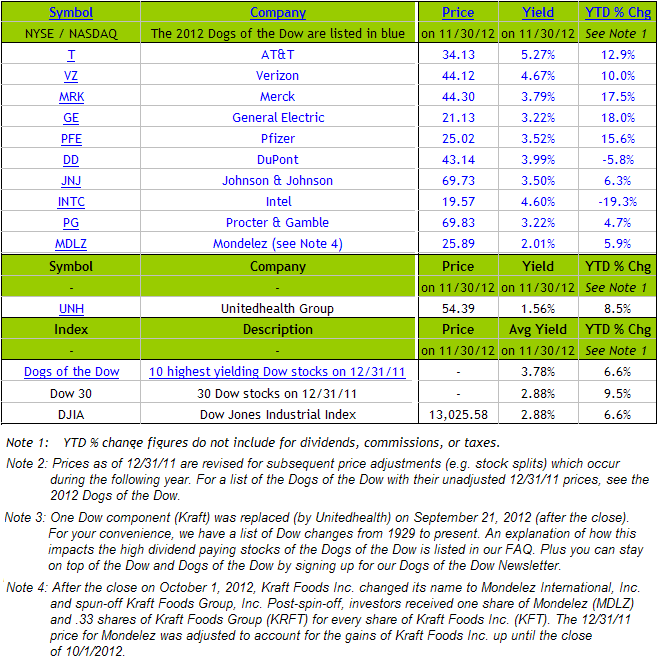
    Dogs Of The Dow Performance Update

    For the first eleven months of the year, the Dow Dogs price only performance has matched the Dow Index return with both returning about 6.6%. The S&P 500 Index return of 12.6% is nearly double the Dow Jones Industrial Average return. The Dow Dogs do have a yield higher than the index which results in slight outperformance for the Dow Dogs.

    As noted in prior posts, the Dow Dog strategy consists of selecting the ten stocks that have the highest dividend yield from the stocks in the Dow Jones Industrial Index (DJIA) after the close of business on the last trading day of the year. Once the ten stocks are determined, an investor would invest an equal dollar amount in each of the ten stocks and hold them for the entire year. Investors should note the strategy has generated mixed results over the years.


    Sunday, November 25, 2012

    Retailers Open Thanksgiving To Counteract E-commerce Sales

    A significant reason retailers opened their doors on Thanksgiving was an attempt to limit the impact of online sales on that day. ComScore reported e-commerce sales increased 32% YOY to $633 million on Thanksgiving. E-commerce sales on Black Friday increased 26% YOY to $1.042 billion, the first time surpassing the one billion dollar mark.

    From The Blog of HORAN Capital Advisors

    Bricks and mortar retailers had a respectable showing in the sites most visted by online consumers.

    From The Blog of HORAN Capital Advisors

    Source:

    Black Friday Billion: Kick-Off to Brick-and-Mortar Shopping Season
    Surges Past $1 Billion in E-Commerce Spending for the First Time

    comScore
    November 25, 2012
    http://tinyurl.com/cn9xhhf


    Saturday, November 24, 2012

    A Buyback Strategy Does Outperform

    In this week's Barron's an article, Beware the Buyback ETF Strategy ($), appears stating "there's precious little evidence that share repurchases do much for long-term investors." In fact, this could not be further from the truth. One of the more popular buyback ETFs is the PowerShares Buyback Achievers Portfolio (ticker-PKW.) I have written articles on this index as recently as October of last year. In that article, Companies Buying Back Shares Are Outperforming, the buyback index was significantly outperforming the broader market. Year to date, the Buyback Index is only slightly trailng the S&P 500 Index, 11.46% versus 12.05%, respectively. A large part of this minor underperformance is the absence of Apple (AAPL) in the buyback index.

    From The Blog of HORAN Capital Advisors

    On a 2-year basis though, the buyback index is up 26.80% versus the S&P 500 Index return of 19.35%.

    From The Blog of HORAN Capital Advisors

    In addition to the buyback index outperforming over longer periods than a year, the buyback index is less volatile. The 3-year standard deviation of PKW is 14.37% versus the S&P 500 Index standard deviation of 15.54%. Additionally, the buyback index experienced a smaller maximum drawdown in all time periods for 1, 3 and 5 years as of 10/31/2012.

    For investors then, if you are allocating dollars based on a long term strategy, focusing on companies that buyback their stock might be a rewarding one.


    Friday, November 23, 2012

    The Challenge: Finding A Balanced Solution To The Fiscal Cliff

    Since November 15th the S&P 500 Index has managed to gain over 4% in spite of the rhetoric surrounding the consequences of going over the fiscal cliff. Finding a "balanced" solution to the budget issues in Washington is more than a near term issue. As the below chart shows, total credit market debt to GDP has been on an increasingly higher growth trajectory. A contributor to this debt increase is the growth in debt at the U.S. government level due to the significant budget deficit from year to year. Additionally, the economy continues to grow a rate a that is below its long term trend potential.

    From The Blog of HORAN Capital Advisors

    USA Today reported recently that the deficit in 2011 would actual total $5 trillion if standard accounting rules were utilized by the government.

    From The Blog of HORAN Capital Advisors

    The point in noting the aforementioned data is a balanced approach to closing the deficit is a must. It is fine to focus on revenue on the on hand; however, the revenue increase must consider a structure that also creates an environment where the economy is likely to grow. Simply raising taxes, and thinking that is the answer to growing revenue, is sure to tip the economy into a recession.

    From The Blog of HORAN Capital Advisors

    The below table provides market performance data during past time periods when the capital gains tax rate was increased. One of the tax changes that will go into effect if Washington goes over the fiscal cliff is a higher capital gains tax rate. The table was reproduced from a recent market comment by Liz Ann Sonders, Chief Investment Strategist for Charles Schwab & Co. She notes the mixed market results that occurred when capital gain tax rates were increased. However, she goes on to note, "but looking more closely, you can see that the capital gains tax hike in 1986 was met with very strong market performance. Why? Because it was part of President Ronald Reagan's bipartisan tax reform, which slashed marginal and corporate tax rates while also eliminating many deductions. I hope our policy-makers heed the message of this particular history."

    From The Blog of HORAN Capital Advisors

    The important takeaway from the above table is the necessity to craft a budget solution that includes components that are conducive to economic growth.

    H/T: The thoughts behind a portion of this article were gleaned from an article on Zero Hedge.


    Thursday, November 22, 2012

    U. S. Government Spending Growth Nearly Always Positive (Updated)

    It goes without saying the most cited market topic every day of late, but I will mention it anyway, is the discussion about the fiscal cliff. The anticipated negative impact on the economy, and hence the market, of going over the cliff is significant. At the end of the day Congress and the administration in Washington, D.C. need to address the mismatch between revenue and expenses of the federal government. The stumbling block at the moment seems to be what additional revenue sources will be on the table. However, as the below chart details, no matter what the increase in revenue [growth] taken in by the government, expenses [growth is] always [positive] grow at a faster percentage rate. The consequence is the budget deficit never rarely closes and government debt continues to increase. A primary reason the deficit does not close is Washington's definition of expense cuts is simply a lower "growth rate" of spending. Only in Washington does this type of math seem logical. [revised chart]

    From The Blog of HORAN Capital Advisors


    Sunday, November 18, 2012

    New Healthcare Law: Higher Employee Turnover And Reduced Company Stock Returns?

    One aspect of the new healthcare law (The Patient Protection and Affordable Care Act (PPACA)), and commonly called Obamacare, is the requirement that employers with more than 50 employees must provide healthcare to those employees working more than 30 hours per week. A number of companies, especially in the retail and fast food industries, have stated they will reduce employee hours to below 30 hours per week in order not to be required to provide healthcare to the employee as required under the new law. A potential consequence is companies might see higher levels of employee turnover.

    As the below chart shows, companies that do have higher turnover rates tend to have lower equity returns. Investors will want to monitor a company's employee turnover in the event higher turnover rates do begin to negatively impact company profitability and hence the company's stock performance.

    From The Blog of HORAN Capital Advisors


    Many Believe Market Is Oversold So What Will Happen

    In reading a number of strategists' take on the current market technicals, it seems many believe the market is oversold and due for a bounce.
     Updated: 11/18/2012 3:43pm
    As Tiho Brkan notes on his website, The Short Side of Long, "when it is obvious to the public, it is obviously wrong." As the below chart shows, the University of Michigan Sentiment indicator appears to indicate a pretty positive sentiment level.

    From The Blog of HORAN Capital Advisors

    The American Association of Individual Investors sentiment release this past week saw a significant decline in investor bullish sentiment. The bullishness level fell 9.68 percentage points to 28.82%. The bull bear spread came in at -20 versus the prior week spread of -1.4. It should be noted this contrary indicator tends to be most accurate at extremes and it is not uncommon for a bottom market to turn when the bullishness level falls to the low 20's or even into the teens as one can see in the below chart.

    From The Blog of HORAN Capital Advisors

    Certainly, the market can bounce in the short run. The below chart of the S&P 500 Index includes the percentage of stocks selling above their 50 day moving average and currently stands at 23%.

    From The Blog of HORAN Capital Advisors

    I do believe the market could see a bounce short term; however, resistance will likely be reached at S&P 1,382, which is the 200 day moving average for the index. In Tiho's recent article, and well worth reading he notes, "despite a decently strong sell off, Investor Intelligence proportion of bearish advisors has not risen meaningfully. From intra day high of 1474 towards intra day low of 1343, [the] S&P 500 has lost almost 10% and yet it is difficult to find a true bear out there. Various market participants continue to talk about bottoms and buying opportunities, neglecting deterioration in growth and earnings discussed above."

    In this enviroment, investors should focus on high quality companies that have the ability to grow their earnings in spite of near term economic and political uncertainties. It is the political uncertainties in the U.S. and the euro zone that may be weighing most on the markets at this time. If Congress some how agrees to a solution that avoids the fiscal cliff, that is more than kicking the can down the road again, the market would likely respond quite favorably.


    Monday, November 12, 2012

    Fiscal Cliff Tax Impact By State

    The Tax Foundation released a report today showing the tax impact on a median four person family for each state if Congress and the President allow the country to go over the so-called "fiscal cliff." New Jersey would see the largest tax increase of $6,933 or 6.82% on median family income of $101,682. The smallest tax increase would be experienced by the state of Washington at $3,362 of 4.12% on median family income of $81,582. The Tax Foundation's report, How Would the Fiscal Cliff Affect Typical Families in Each State?, is insightful and well worth the read. Given consumers account for 70% of economic activity, this level of tax increase would undoubtedly be contractionary to the economy's growth.

    From The Blog of HORAN Capital Advisors


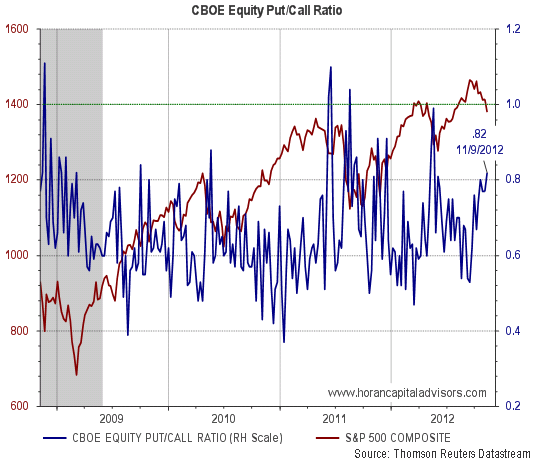
    Equity Put/Call Ratio On The Rise

    The equity put/call ratio has been in an uptrend since mid September when the put/call ratio fell to .53. Not too coincidentally the S&P 500 Index hit 1,465, the high for the year. As noted in May's prior post, Equity Put/Call Ratio Approaching 1.0:
    "The equity P/C ratio tends to measure the sentiment of the individual investor by dividing put volume by call volume. At the extremes, this particular measure is a contrarian one; hence, P/C ratios above 1.0 signal overly bearish sentiment from the individual investor. This indicator's average over the last 5-years is approximately .7, indicating the individual investor has been generally mostly bullish and more active on the call volume side"
    As noted in the below chart, the market has a history of reversing itself at levels above .80.

    From The Blog of HORAN Capital

    Advisors


    Saturday, November 10, 2012

    QE3 Not Positive For "Risk On" Asset Class Performance

    As the below chart shows, QE3 has not had the positive impact on "risk on" asset price performance since its implementation unlike in prior QEs.

    From The Blog of HORAN Capital Advisors
    Just looking at prior QE's impact on the S&P 500, the following chart does show the positive impact on the index. However, each successive QE/Twist program has been less effective.

    From The Blog of HORAN Capital Advisors
    Source: Schwab


    Thursday, November 08, 2012

    Recession Risk Rising

    An interesting post has been published by Political Calculations noting the rise in the recession risk indicator. Additionally, the article notes other factors, specifically, dividend cuts, that are signaling increased risk of a recession in the U.S.

    From The Blog of HORAN Capital Advisors

    As noted in the post, The Reformed Broker's Joshua Brown states:
    "Do you see the percentages on the left side of the chart? 20% is the line in the sand. We've never hit that level and NOT had a recession. In 2006 we got close (18%?) but that particular Great Recession would be a year and half in the making. Note that we're back at that 20% line again. And I can't think of anything that keeps the leading indicators from going through it to the upside - the Fiscal Cliff stuff could only speed its ascent"

    H/T: Political Calculations


    Wednesday, November 07, 2012

    Election Is Over But More Uncertainty Ahead

    What surprises me the most on this day after the election is the outpouring of advice pundits are freely offering to President Obama on how to deal with the current state of our economy. Following are just a few comments from today.
    I surmise many pundits feel compelled to offer their advice to the President since they likely believe they did not hear concrete and credible solutions to dealing with the country's current fiscal predicament during the campaign leading up to Tuesday's election. This seems hard to believe since the two candidates spent over $1.6 billion on this election. In hindsight, the voters have told Governor Romney they did not hear or believe his solutions either. This is some of the uncertainty the market is trying to digest. Although the election has come and gone, the uncertainty surrounding the fiscal cliff and debt ceiling debate will likely weigh on the market.

    Ignoring the political party divide and looking at the state of our economy from a purely financial perspective, it appears the country is on a very slippery slope. Many individuals in their prime working years will likely not be too impacted from all of this as compared to events that may face our children and grandchildren. As Mohamed El-Erian says in his letter to the President, "For the first time in a very long time, our nation faces the possibility of seeing our children's generation end up worse off than their parents." In short, he is saying living beyond ones means has consequences.

    At the end of October the Treasury issued a refunding statement and noted in the statement's last paragraph, "Treasury continues to expect the debt limit to be reached near the end of 2012." The debt ceiling has been reached again after it was just increased on August 2, 2011, when President Obama signed a deal he had negotiated with congressional leaders to increase the debt limit of the federal government by $2.4 trillion. But now, after only 15 months, almost all of that additional borrowing authority has been exhausted. The government has taken on an additional $2.4 trillion dollars in debt in just over a year. This is not a sustainable path to go down as a country.

    The consequences of the the U.S. government's continued printing of money to support deficit spending, I believe, may very well be low or stagnant economic activity and higher unemployment. In the end though, investors will be able to make money in this environment, but it will be more difficult. As Warren Buffett once said though, "Be fearful when others are greedy and greedy when others are fearful." The foreseeable future may be a time where investors can really take advantage of this contrarian sentiment investment advice.


    Saturday, November 03, 2012

    Job Creation Versus Growth In Food Stamp Rolls

    No matter what your political affiliation, the significant growth in food stamp rolls versus little new job creation since January 2009 is an unsettling data point in the weak U.S. economic recovery.

    From The Blog of HORAN Capital Advisors

    As noted in a recent Weekly Standard article:
    • "In January 2009, there were 133.56 million Americans with jobs and 31.98 million on food stamps. Today, there are 133.76 million Americans with jobs and 46.68 million on food stamps. The employment rolls have thus grown by 0.15 percent and the food stamp rolls have grown by 46 percent, meaning that for every one American who found a job, 75 Americans signed up for food stamps.
    • Total spending on food stamps is now more than $80 billion annually, a fourfold increase from 2001. Total spending on federal means-tested welfare—food stamps, public housing, social services, cash aid, etc.—is now approximately $1 trillion. That amount is enough, if converted to cash, to send every household beneath the federal poverty line an annual check for $60,000."
    As noted in an article I published earlier this week, U.S. Federal Budget At Critical Juncture, the growth in entitlements is on an unsustainable path. Stronger economic growth and more fiscal discipline in Washington is necessary to reverse the U.S. deficit growth.


    Thursday, November 01, 2012

    U.S. Federal Budget At Critical Juncture

    The title of this post is a little misleading since Congress hasn't passed a federal budget in over three years. Nonetheless, one is able to gain insight into the actual revenue and expenses going into and out of Washington and it is not positive.

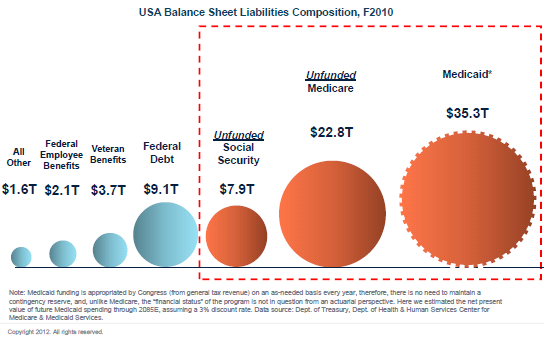
    A recent presentation by Mary Meeker, general partner at Kleiner Perkins Caufield & Byers, at the Ira Sohn Foundation Conference titled USA, Inc, provides detail on the out of balance nature of the federal government's budget. Some highlights from her presentation:
    • Expenses exceed revenue.


    The entire USA, Inc presentation is a worthwhile and eyeopening read.

    h/t: Dealbook: New York Times


    Sunday, October 28, 2012

    Apple: Anticipated Future Price Action

    An article written by Ali Meshkati on his Zenpenny site provides his take on the potential price action for Apple (AAPL) in the coming weeks. He notes:
    "10-28-12: The best case scenario with AAPL going forward is a period of sideways chop. Those highs at $700 won't be challenged for some time. The low created on Friday will likely be broken within the next few weeks, following a move up to $630 - $640 to convince the convincible that the iPhone 6 & 7 mean a $1,000 stock price in the near future.

    The path that AAPL is likely to take has been revealed in the not to distant past. Check out box A. A high volume reversal that resulted in a gap and eventual failure.

    While I don't expect a gap up here, I expect a retrace of a portion of the recent losses that should give AAPL enough new blood to make heads roll in the weeks ahead.

    $520 - $550 remain the likely target for a solid buy point."
    (click chart to enlarge)
    From The Blog of HORAN Capital Advisors
    Source: Zenpenny


    HORAN Begins Financial Planning Blog

    A few days ago, HORAN's Director of Financial Planning, Michael Napier, joined the blogosphere by starting HORAN's financial planning blog. As Michael notes in his initial post,

    "Everybody blogs. In fact, it is estimated that close to 44 million blogs are created each year. Doing the math, that is nearly one new blog per second! So why am I jumping into the blogosphere? To help you get one step closer to achieving your financial goals in easy-to-understand language.

    Two of the biggest challenges facing Americans today are access to great health care and the discipline to sustain wealth management strategies such as making smart decisions about investing and wealth transfer. My focus will primarily be sharing topics I come across on a daily basis to help your financial life. Strategies in tax- savings, estate planning, college savings, budgeting, insurance and retirement will be discussed."
    Subsequent to the initial post, he wrote two articles readers will find of interest.

    The RSS Feed for all of the HORAN blogs can be found here: HORAN RSS Blog Feed


    P/E Level For S&P 500 Index At Level Not Seen Since 1990s

    The Chart of the Day charting service recently noted the valuation or P/E for the S&P 500 Index is at levels last seen in the early 1990s. Importantly for investors though is valuation alone does not make a particular equity attractive. As the below chart notes, valuations can certainly get cheaper. Chart of the Day noted in the commentary to the below chart:
    "[The] chart illustrates the price to earnings ratio (PE ratio) from 1900 to present. Generally speaking, when the PE ratio is high, stocks are considered to be expensive. When the PE ratio is low, stocks are considered to be inexpensive. From 1900 into the mid-1990s, the PE ratio tended to peak in the low to mid-20s (red line) and trough somewhere around seven (green line). The price investors were willing to pay for a dollar of earnings increased during the dot-com boom (late 1990s), surged even higher during the dot-com bust (early 2000s), and spiked to extraordinary levels during the financial crisis (late 2000s). Since the early 2000s, the PE ratio has been trending lower with the very significant but relatively brief exception that was the financial crisis. More recently, the PE ratio has moved slightly higher. It is worth noting, however, that even with this recent uptick, the PE ratio still remains at a level not often seen since 1990."
    From The Blog of HORAN Capital Advisors


    Saturday, October 27, 2012

    Companies Becoming More Cautious As Fiscal Cliff Nears

    Much is being made about the impact on the economy in light of the impending "fiscal cliff" in the U.S. Most strategists agree the impact on the economy will be significantly contractionary if the U.S. goes over this so-called cliff. In reality though, the negative impact of the cliff is already being felt and it appears businesses are positioning themselves for a potential worst case outcome.

    Over the course of the last week or so, many writers have referenced the chart of manufacturers new orders of capital goods. The below chart contains "new orders ex defense" compared against the S&P 500 Index. As can be seen, this decline in capex spending has been a precursor to a potential recession. The current spending level is certainly flashing a warning. The chart in the article at this link shows capex spending compared to economic growth or GDP. In short, Washington is playing with fire as it relates to the current economy and if there recent actions are an indication, the administration and Congress do not understand how businesses plan and operate. Businesses hate uncertainty.

    From The Blog of HORAN Capital Advisors


    Sunday, October 21, 2012

    Investors Continue To Reduce U.S. Equity Exposure

    Investors continue to shun U.S. equity investments as noted in the below chart. In spite of this data most U.S. equity indexes have continued to move higher this year. As we have noted in several earlier posts, it appears investors are allocating increasingly more of their investment assets to fixed income funds. Then what is driving U.S. equity prices higher?

    From The Blog of HORAN Capital Advisors

    As discussed in our third quarter investor letter, the Federal Reserve's Flow of Funds Z.1 quarterly report, shows corporations had negative net equity issuance of $218 billion in 2011. Currently, net equity issuance is running at an annual rate of negative $259.5 billion through the second quarter of this year. In other words, one reason the equity market continues to move higher is the fact companies are reducing the supply of available equity in the market place. This has been accomplished via stock repurchases. Another factor contributing to negative equity issuance is the increase in the number of corporate acquisitions by publicly traded companies and private equity firms. That being said, if demand for equities stays the same and available equity supply continues to decline, equity prices will trend higher. In 2006 and 2007, net equity issuance was nearly negative $1 trillion which preceded the peak of the market in 2008. Corporations seem to be more confident in buying their own shares than investing in future growth.

    Certainly, Q3 earnings reports are anything but stellar. However, the risk/reward of fixed income investments does not seem to favor bond investors at this point in time.


    Saturday, October 20, 2012

    Steven Romick Interview On WealthTrack: Focusing On High Quality

    The below video contains a rare interview with Steven Romick, portfolio manager of the FPA Crescent Fund (FPACX), and Consuelo Mack of WealthTrack. Romick provides insight into his investment approach that includes his current views surrounding his portfolio's current construction. In large part, he is most concerned about the consequences of the money printing that is currently taking place by the monetary authorities around the globe. As he notes, this appears to be a grand experiment that could end in disaster. He believes this is more than "kicking the can down the road", but more like a snowball rolling downhill. As he and others have noted, Ben Bernanke indicated the Fed's current approach is a little like "learning by doing." Not too comforting. From an equity investing perspective, he is focusing on the highest quality companies. He believes with this type of company, it isn't whether they will grow, but more a question of by how much. In his mind, it is more about preparing for the worst and hoping for the best. In spite of his concerns, he believes there is value in high quality global companies.


    Thursday, October 18, 2012

    Investor Sentiment Near Lows Seen Last Summer

    The investor sentiment survey, a contrarian indicator, released today by the American Association of Individual Investors noted the bearish sentiment level increased by 5.7 percentage points to 44.55%. This level of bearishness was last seen this past summer when the S&P was trading in the low 1,300s. Bullish sentiment fell to 28.66%, also at levels seen this past summer. In spite of this level of sentiment negativity, the S&P has continued to move higher. This higher move in the market is typical of a market climbing the proverbial "wall of worry". If companies continue to disappoint on earnings though as they have tonight, the market advance could be nearing an end in the short term.

    From The Blog of HORAN Capital Advisors


    Tuesday, October 16, 2012

    Investor Letter: 3rd Quarter 2012

    At the beginning of the third quarter, investors following the “sell in May” strategy felt vindicated as the S&P 500 Index declined over 9.0% from May 1st to June 4th. The June 4th date turned out to be the intra-year market low and the equity rally was almost uninhibited throughout the remainder of the third quarter. The rising tide seemed to lift all markets during the quarter.

    As noted in our Third Quarter Investor Letter, in spite of the strong market advance, the Federal Reserve felt compelled to institute a third round of quantitative easing (QE3)in the third quarter. Maintaining loose monetary policy has not been as effective as the Fed would hope during this household and corporate deleveraging cycle. Companies have been vocal in regard to their greater concern about the future of tax and regulatory policies.

    As we look ahead, we are mindful of near term potential risks, i.e., the U.S. fiscal cliff, Europe struggling with sovereign debt and growth issues, heightened Middle East tension and a more muted outlook for third quarter corporate earnings. We are positioned for a slower economic growth environment. We see some signs for long-term optimism as housing seems to have regained some footing, energy independence is increasingly possible and the repatriation of U.S. jobs is gaining traction. Longer term we continue to believe equities will be a strong performing asset class supported by compelling long term valuations.

    The entire Letter can be accessed directly from our website at the following link: 3rd Quarter 2012 Investor Letter.


    Monday, October 08, 2012

    More Weakness Seen With Modern Portfolio Theory

    Niels Jensen's, of Absolute Return Partners, market letter to investors notes how Modern Portfolio Theory (MPT) has become less effective over time. Over the past few years we have written several posts (here and here) on the problems with MPT. One chart in the Jensen's market letter displays the increasing correlation between asset classes that has developed since 2000 thus limiting the effectiveness of diversification as outlined in Modern Portfolio Theory.

    From The Blog of HORAN Capital Advisors

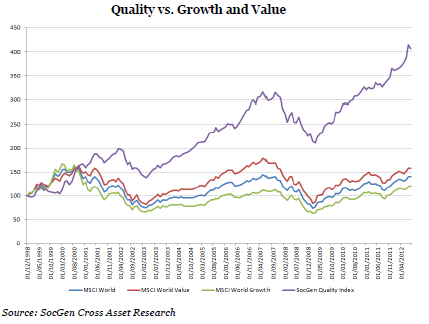
    Additionally, the market letter notes the outperformance of "quality" stocks versus say growth or value. As the letter states, quality refers to the strength of a company's balance sheet as well as the sustainability of its dividend policy.

    From The Blog of HORAN Capital Advisors

    A key for investors is to understand the approach taken by their investment manager in constructing their investment portfolio.

    Source:

    When Career Risk Reigns (PDF)
    Absolute Return Partners LLP
    By: Niels J. Jensen
    October 2012
    http://www.arpllp.com/core_files/The_Absolute_Return_Letter_1012.pdf


    Sunday, October 07, 2012

    Weak CEO Confidence, Weaker Market Ahead?

    Last week The Conference Board released its CEO Confidence Measure and noted a decline to 42 in the third quarter versus 47 in Q2. A reading below 50 reflects more negative responses than positive ones. The report notes a third of the CEO's surveyed indicated they were curtailing capital spending plans. Lynn Franco, Director of Economic Indicators at The Conference Board noted,
    "This latest report reflects ongoing concern about the strength of the economy. CEOs’ assessment of current conditions remains weak and they have grown increasingly pessimistic about the short-term outlook. Sluggish growth and a persistent cloud of uncertainty have played a role in CEOs curtailing spending plans this year.”
    Historically, when this Measure reached this level of pessimism, the equity market was not too far from a near term peak.

    From The Blog of HORAN Capital Advisors


    Saturday, October 06, 2012

    Dividend Payments Increase In Third Quarter

    In a report recently released by Standard & Poor's, they note more companies increased their dividend payments in the third quarter versus the same quarter last year. The number of positive actions (439) equals the number in Q3 2007. The report notes:
    "...dividend net increases (increases less decreases) were $8.8 billion in the third quarter of 2012, setting what is believed to be a new record dividend quarterly payout in aggregate dollars for U.S. domestic listed common stock issues..."
    From The Blog of HORAN Capital Advisors
     Data Source: Standard & Poor's

    As we will discuss in our soon to be released third quarter investor letter, investors have been searching for yield, especially retired investors, and have sought out dividend paying stocks. If Congress allows the budget to go over the so called fiscal cliff, retired investors will be harmed significantly due to the tax increase on dividends.The Sober Look website notes beginning in 2013, the U.S. will have the highest top dividend tax rate in the world if the tax increases subject to the fiscal cliff go into effect.

    From The Blog of HORAN Capital Advisors