Tuesday, February 07, 2012

January A Risk On Month

As we noted in our fourth quarter investor letter, the new phrase repeated throughout 2011 was “risk on/risk off,” simply defined as buying riskier investments during positive market moves and selling riskier investments during downward moving equity markets. “Risk on” assets include stocks, commodities and high-yield bonds; whereas “risk off” assets include cash, U.S. treasuries and gold. Specifically, in a "risk on" environment, stocks that have higher betas tend to be favored by investors. Higher quality dividend paying stocks tend to move out of favor during these "risk on" phases relative to the higher beta investments.

January was certainly a case in point where "risk on" was the operative strategy. In January the average return for dividend payers in the S&P 500 Index trailed the non payers by 3.30 percentage points.

payers vs non payers 1 2012


Sunday, February 05, 2012

Presidential Election Year Stock Market Return

More times than not, in a presidential election year the stock market has had better performance when the incumbent party wins. As noted in a recent T. Rowe Price report, "the S&P 500 Index has risen in 12 of the 16 election years since World War II. While that’s about the same percentage of all up years in that time, the index had an average gain of 9.2% when the incumbent party won and just 2.2% when it lost, according to Ned Davis Research." The report also notes that the market has declined in two of the last three presidential election years.

From The Blog of HORAN Capital Advisors

Source:

The Stock Market In Presidential Election Years (page 7)
T. Rowe Price Report
Winter 2012
http://individual.troweprice.com/public/Retail/xStaticFiles/Winter2012PriceReport.pdf


Saturday, February 04, 2012

Milton Friedman On Capitalism 32 Years Ago

A two minute excerpt from a 1979 Phil Donahue show where Milton Friedman talks about capitalism and socialism.


Friday, February 03, 2012

Labor Market Only Marginally Better

Although the equity market liked the employment report this morning, the labor market is far from where it needs to be to absorb the jobs lost since the last recession. The 243,000 jobs that were added was the highest in the last nine months; however, the number of employed is far below the level prior to the recession--5.6 million below.

From The Blog of HORAN Capital Advisors

Certainly the addition of 200,000+ new jobs is a positive, but this recovery remains one of the weaker recoveries in terms of job creation. The participation rate remains at a level last reached more than 20 years ago. The employment to population ratio and the average duration of unemployment also remain at problematic levels.

From The Blog of HORAN Capital Advisors


Sunday, January 29, 2012

Stock Buybacks Do Not Benefit Future Stock Performance

In a recent research report by Thomson Reuters they note that a company's stock buyback activity generally does not add value subsequent to the buyback. A reason cited is the fact companies generally have more cash on hand in good economic environments and this tends to be after the stock price has already reflected a more positive operating environment. The report concluded:
"...most companies in the S&P 500 index have not been successful in adding value through stock buybacks in the time frames we observed. The positive correlation between buyback activity and price suggests a combination of poor market timing as well as policies that increase repurchases when firms have more free cash flow. This may be partially explained by the need for officers of public companies to make some use of the cash on hand, including keeping less of it due to the possibility of being taken over. The negative correlation between repurchases and forward returns shows that most buybacks did not pay off within the year after purchase."
Even for the market (S&P 500 Index) overall, the increased buyback activity occurs at ever increasing price levels.

From The Blog of HORAN Capital Advisors

One interesting aspect of the buyback activity at this point in time is it does seem to be at a sufficient level that it makes up for the lack of investor fund flows into equity mutual funds. As the below chart notes, cumulative outflows in equity mutual funds is running at a little over $400 billion dollars since 2006. Buybacks over that same time period total approximately $2.1 trillion through the 3rd quarter of 2011 as reported by Standard & Poor's (PDF).

From The Blog of HORAN Capital Advisors

A few companies were highlighted in the Thomson report as having timed their buybacks successfully. One example is St. Jude Medical (STJ). As the below chart shows, the company tended to successfully execute its buyback on dips in the company's stock price.

From The Blog of HORAN Capital Advisors


On the other hand, Exxon Mobil's (XOM) buyback timing seems to occur after the company's stock price has rallied.

From The Blog of HORAN Capital Advisors

For investors then, buybacks tend not to be a good predictor of future stock price performance. We have written several posts in the past about some of the pitfalls in company stock buyback programs. Ideally, investors should focus on a company's dividend practices. When a company increases its dividend, it is making a long term commitment of its future cash flow; hence, a more significant statement about future earnings prospects.

Disclosure: Long XOM and no position in STJ


Friday, January 27, 2012

Fourth Quarter 2011 Investor Letter

Fortunately for investors, the calendar has turned to a new year and 2012 has gotten off to a strong start in January. As our 4th Quarter Investor Letter notes, 2011 was a flat but volatile year for the market (S&P 500 Index); however, as of 12/31/2011, the 3-year annualized return for the S&P is 14%. Not bad for a 3-year time period. The disparity in valuations between stocks and bonds is near record levels as we discuss in our Investor Letter.

The Letter can be accessed directly from our website at the following link: 4th Quarter 2011 Investor Letter

We hope you find the content of our letter insightful as we look to 2012.


Sunday, January 15, 2012

High Ratio Of Public Debt To GDP Constrains Economic Growth

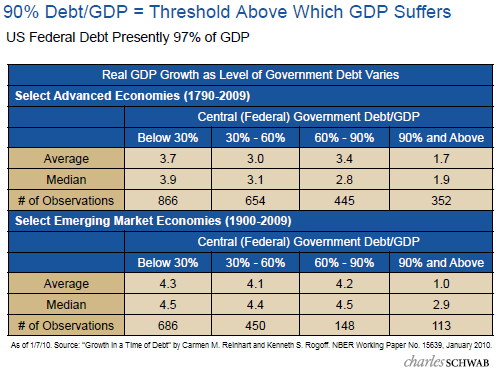
Approximately two years ago Carmen M. Reinhart and Kenneth S. Rogoff completed a comprehensive study, “Growth in a Time of Debt”, which looked at public debt levels around the globe and the resultant impact on economic growth for the respective economies. The study noted the historical consequences of various debt levels relative to an economy's GDP growth with the impact of increasing public debt levels on a country's economy being different for emerging and developed economies. The study authors concluded economic growth does tend to suffer significantly when a country's debt to GDP level exceeds 90%. For some emerging economies, debt to GDP levels over 70% begin to constrain growth. In the U.S. public debt to GDP is now over 90%.

From The Blog of HORAN Capital Advisors

Reinhart and Rogoff noted in their study:
"The simplest connection between public debt and growth is suggested by Robert Barro (1979). Assuming taxes ultimately need to be raised to achieve debt sustainability, the distortionary impact imply is likely to lower potential output. Of course, governments can also tighten by reducing spending, which can also be contractionary. As for inflation, an obvious connection stems from the fact that unanticipated high inflation can reduce the real cost of servicing the debt. Of course, the efficacy of the inflation channel is quite sensitive to the maturity structure of the debt. Whereas long-term nominal government debt is extremely vulnerable to inflation, short term debt is far less so. Any government that attempts to inflate away the real value of short term debt will soon find itself paying much higher interest rates...

...In principle, the manner in which debt builds up can be important. For example, war debts are arguably less problematic for future growth and inflation than large debts that are accumulated in peace time. Postwar growth tends to be high as war-time allocation of manpower and resources funnels to the civilian economy. Moreover, high war-time government spending, typically the cause of the debt buildup, comes to a natural close as peace returns. In contrast, a peacetime debt explosion often reflects unstable underlying political economy dynamics that can persist for very long periods."
Finally, as the below chart shows, debt levels in Europe (emerging and developed) and the U.S., have seen significant growth since just 2003.

From The Blog of HORAN Capital Advisors

An important outcome of these higher debt levels will be how each country decides to reduce its dependence on debt (balance governmental budgets), while at the same time not implementing policies that constrain private sector growth.


The Dangers Of Leveraged ETFs

From time to time questions arise about using leveraged ETFs in one's portfolio strategy. We caution longer term oriented investors to not use these type of ETF investments. For example, if an investor believes the market will rise in the near term, why not consider a two or three times ultra bull ETF. In this case an investor would expect the ETF to generated two or three times the return of the underlying index. Well, for an investor, it is not that simply due to how the math calculation works. Let's look a 2x's ultra long or bullish ETF example.
  • Lets assume at the beginning of day 1 an index is trading at $100. At the end of the day the index closes at $90 or down 10%. The leveraged ETF would close at $80 or down 20%.
  • On day 2 the index rises to $99 or up 10%. The 2x's leveraged ETF would increase to $96, that is $80 * 1.20=$96.
  • Over the two day period though the index is down 1% while the leverage ETF is actually down 4% or four times worse than the index return versus the expected two times worse return.
From The Blog of HORAN Capital Advisors

One problem with many of these leverage ETFs is they reset daily and individual investors generally do not rebalance their portfolios on a daily basis. So as one can see, the performance of these ETFs over a period longer than one day can differ significantly from their stated daily performance objectives. More on this topic can be found on the SEC's web site in an article they wrote titled, Leveraged and Inverse ETFs: Specialized Products with Extra Risks for Buy-and-Hold Investors.


Saturday, January 07, 2012

Forecast For 2012 By Ed Hyman And Bob Doll

The recent WealthTrack interview conducted by Consuelo Mack features Ed Hyman, Chairman and Founder of ISI Group, and Bob Doll of BlackRock. Ed Hyman has been rated the #1 economist by Institutional Investor for 32 years running. Both strategist see the U.S. as the best house in a bad neighborhood for investors. Hyman notes the US economic data has been better, but not great, every week for the past three months. For more on their insights for 2012, readers can view the below video.


Monday, January 02, 2012

Equity Risk Premium Near An Extreme

The equity risk premium recently reached levels last seen at the height of the financial crisis in 2008. The high risk premium level suggests equities are attractive at this point in the market cycle. One key is whether corporate earnings can continue to make new record highs in 2012. Earnings growth is expected albeit at a slower rate than achieved in 2011. Given the level of stock buybacks and more importantly, company dividend increases, it seems equities could do well looking forward. The buyback and dividend actions by companies provide some level of favorable insight into company earnings expectations. As is typically the case, unforeseen events can derail a favorable market environment. The known risks are numerous and will continue to result in somewhat volatile price action (sovereign debt issues, political rhetoric in the U.S., dealing with the U.S. budget deficit and debt levels, just to name a few), but our forecast suggests equity prices should end 2012 higher.

From The Blog of HORAN Capital Advisors


Sunday, January 01, 2012

Dogs Of The Dow For 2012

The Dogs of the Dow in 2011 significantly outperformed the Dow Jones Industrial Average Index (DJIA) and the S&P 500 Index on a price only basis in 2011. The Dow Dogs returned 12.2% versus the DJIA return of 5.5%. The S&P 500 Index was essentially flat on the year.

The Dow Dog strategy consists of selecting the ten stocks that have the highest dividend yield from the stocks in the Dow Jones Industrial Index (DJIA) after the close of business on the last trading day of the year. Once the ten stocks are determined, an investor would invest an equal dollar amount in each of the ten stocks and hold them for a year. The strategy has generated mixed results over the years.

The Dogs of the Dow for 2012 have two new additions, Procter & Gamble (PG) and Kraft (KFT). The two stocks eliminated from the Dow Dogs are Chevron (CVX) and McDonald's (MCD). Below is a list of the Dogs of the Dow for 2012.


Saturday, December 31, 2011

Moderate Inflation Benefits Equities

During moderate periods of inflation, equities tend to generate decent performance results. I posted the below chart in a post, Where To Invest In An Inflationary Environment, in mid 2010 that details the performance of various investment categories based on different inflation ranges going back to 1972.

From The Blog of HORAN Capital Advisors

Since mid year 2010 inflation has been trending higher with the latest year over year report showing inflation running at nearly 3.5%.
From The Blog of HORAN Capital Advisors

The blog at Crossing Wall Street selected the below chart as the Overlooked Chart of the Year. The chart compares the S&P 500 Index to the market’s expectation for inflation (the 10-year TIP spread). Of late, there has certainly been a high correlation to higher inflation expectations and the S&P 500 Index return.

From The Blog of HORAN Capital Advisors

Determining the true level of inflation is also a frequent topic. The Shadow Government Statistics (SGS) site makes an effort to track data on indexes when the calculation methodology is changed. In 1990, the CPI calculation was changed and a comparison of the current CPI versus the 1990-based calculation can be found on the SGS site.


Friday, December 30, 2011

Equity Performance in 2011

With the close of trading today, following is a quick look at the 2011 price performance of a few select equity markets around the globe.

From The Blog of HORAN Capital Advisors
Source: Reuters


Monday, December 26, 2011

Watching The Valuation Of Dividend Payers

The investment mantra this year has been to focus on dividend paying stocks. Over the long run, payers have had a tendency to outperform the non payers and this has certainly been the case this year. On the other hand though, valuations do matter and the below chart provides investors with a cautionary view of simply buying "any" investment that has yield.

From The Blog of HORAN Capital Advisors


Saturday, December 17, 2011

Investors Favoring Bond Funds

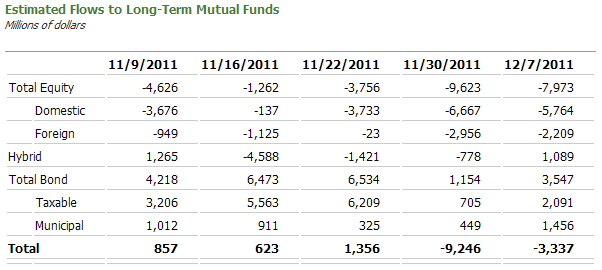
Recent mutual fund flow data shows investors continue to favor bonds over equities.

From The Blog of HORAN Capital Advisors
Source: ICI
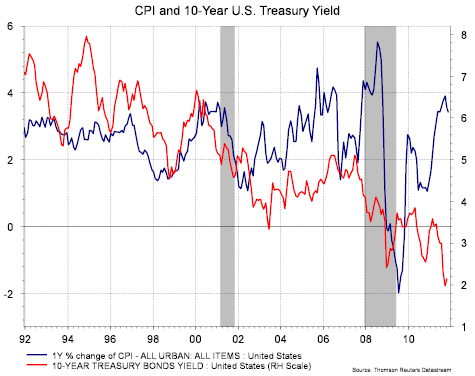
With the sovereign debt issues in Europe top of mind for investors, they continue to bet the best of the worst fixed income investments are U.S. Treasuries. One risk investors face with fixed income investments is the negative impact of a rise in rates. The 10-year U.S. Treasury yield is a meager 1.85% in spite of the fact the consumer price index is running at a year over year rate of 3.4%. Investors are in for a rude awakening when rates do begin to move higher (bond prices have an inverse relationship to the move in interest rates).

From The Blog of HORAN Capital Advisors


Thursday, December 15, 2011

Fragile Employment Market

The improvement in the unemployment rate earlier this month was certainly positive on the surface. The rate declined to 8.6% from the previously reported 9%. The improvement though came largely from the 300,000 individuals that simply stopped looking for a job. As a result, these additional people are not counted among the unemployed. As the below chart shows, the number individuals not in the labor continues to rise.

From The Blog of HORAN Capital Advisors

This fragile state of the consumer also shows up in the number of individuals on food stamps.

From The Blog of HORAN Capital Advisors


Sunday, December 11, 2011

Dividend Aristocrat Changes For 2012

Going forward S&P has changed the methodology on how they determine which companies qualify as Dividend Aristocrats. S&P notes they will only count regular dividend payments when determining the calendar year total dividend payments of a company. Special cash dividends will no longer be considered.

The table below contains a list of Standard & Poor's Dividend Aristocrats for 2012. The rebalance will take place at the market's close on December 16, 2011. The green highlighted companies are the additions and the yellow highlighted company is the deletion. S&P has added ten new Aristocrats while eliminating one, CenturyLink, Inc.


Barron's Income Investing Blog highlights some year to date dividend comments from Howard Silverblatt, Senior Index Analyst for S&P:
  • Year-to-date (YTD) dividend payers in the S&P 500 have returned 1.72%, compared to the non-payers loss of 4.63%.
  • The actual dividend payment YTD is up 16.2%.
  • The indicated dividend rate (based on the current rate) is up 16.8% YTD, but still off 4.9% from the June 2008 high.
  • From 1995 the S&P 500 indicated dividend yield has averaged 43% of the U.S. 10-year Treasury note, the current rate is 105%.
  • 215 issues have a current yield higher than the 10-year Treasury.


Disclosure: Long ABT, APD, ADP, BDX, CTL, CB, BEN, GPC, ITW, JNJ, LOW, MCD, NUE, PG, WMT


The Need For Cutting Spending In Washington

Much of the rhetoric coming out of Washington is focused on the need for more revenue, specifically from individual tax payers. The millionaire tax discussion is emblematic of this focus. As the below chart shows though, individual tax receipts into the U.S. Treasury are up 22% on a year over year basis through the end of September with overall receipts up nearly 7%.

From The Blog of HORAN Capital Advisors

Additionally, individual receipts for the government are near the level received in 2007. On the other hand, government spending has grown 2% on a year over year basis.

From The Blog of HORAN Capital Advisors

From The Blog of HORAN Capital Advisors

In short, Washington needs to have a greater focus on cutting spending, while at the same time promoting policies that are favorable to businesses to enable greater employment growth.


Sunday, December 04, 2011

Future Strength In Retail Sales?

A common view from pundits on the strength in retail sales on Black Friday and Cyber Monday is much of the increase represented consumers buying forward. In other words, the common take on the strong sales report was it likely won't continue into December. If history is any guide, the below chart might indicate additional retail sales growth is likely for the balance of the weeks leading up to Christmas.

From The Blog of HORAN Capital Advisors

The dollar value of total cyber sales increased 22% versus last year and dollars spent per buyer increased 9%.

From The Blog of HORAN Capital Advisors

Since consumers account for 70% of GDP, these retail sales figures suggest Q4 GDP could surprise on the upside.

Source:

comScore
Cyber Monday Spending Hits $1.25 Billion to Rank
as Heaviest U.S. Online Spending Day in History

November 29, 2011
http://www.comscore.com/Press_Events/Press_Releases/2011/11/Cyber_Monday_Spending_Hits_1.25_Billion


Many Corporate And Consumer Positives

I noted in a post a few weeks ago about the positive trend in the JOLTS (Job Openings and Labor Turnover Survey) report which was released by the US Department of Labor and indicated job openings, as of the end of September, were at their highest level since 2008. Additionally, jobless claims, a key leading indicator, have now moved below 400,000 on a four-week moving average basis, which signifies an improving job market. The ADP Private Payroll report showed a 206,000 job gain in November, well above estimates and the best reading since March 2010. The broader November jobs report indicated the US economy added 120,000 jobs and that the unemployment rate declined to 8.6% from 9.0%, the lowest rate since March 2009.

On the corporate side the October Index of Leading Economic Indicators rose 0.9%. This was the sixth monthly increase in a row. Nine of index’s 10 components saw increases for the first time since May of 2003. As noted by the conference board,
“the LEI is pointing to continued growth this winter, possibly even gaining a little momentum by spring. The lack of confidence has been the biggest obstacle in generating forward momentum, domestically or globally. As long as it lasts, there is a glimmer of hope.”
From The Blog of HORAN Capital Advisors

Other positive corporate data points:
  • Industrial production rose 0.7% in October
  • Chicago PMI rose to 62.6 from 58.4, a seven-month high, and the new orders component rose to its highest level since March at 70.2
  • The Institute for Supply Management’s (ISM) Manufacturing Index rose to 52.7, the highest level since June
  • New orders increased to 56.7 from 52.4
Lastly, a number of our articles are republished by SeekingAlpha. Yesterday they republished our post, Market Driven By Emotions Versus Fundamentals. What was interesting is the number of bearish comments (contrarian indicator?) and one comment about the macro environment having a controlling influence on the markets direction.

The biggest potential market negative seems to be the debt crisis in the Eurozone. On the other hand, the economic environment in the U.S. continues to improve in spite of the downward revision to third quarter GDP from 2.5 to 2.0. The revision was largely attributable to a decline in private inventories, which reduced overall GDP by 1.55 percentage points. This type of revision likely means higher growth in Q4 and into early 2012 as businesses have to rebuild inventory levels to keep up with what appears to be improving demand. Our post, Market Driven By Emotions Versus Fundamentals, details some of this demand by touching on the strength in retail sales on Black Friday and Cyber Monday.

From The Blog of HORAN Capital Advisors

From The Blog of HORAN Capital Advisors

There are many positive data points for investors to consider. Certainly the issues in Europe, not to mention in Washington, are not to be made light of. However, the magnitude of the market's advance last week might be some indication of the attractiveness of U.S. equity valuations. Market volatility is high though, so investors should take a disciplined approach if they are building equity positions.


Friday, December 02, 2011

Market Driven By Emotions Versus Fundamentals

I write this shortly after the Dow Jones Industrial Average rockets higher by nearly 500 points, or 4+%, in just one day, I think back to the concerns raised in recent interactions with some investors expressing concern about the market’s volatility. In August and September, 40% of the trading days in the S&P 500 Index saw daily price swings of plus or minus 2%. This level of volatility was last seen in the early 1930’s. Increasingly, the market seems to be trading more on emotion than on company fundamentals. The rally at the end of November was fueled by the announcement that central banks around the globe would provide a liquidity back stop for the European debt issues. The European crisis is contributing to investors trading on short-term emotion while they worry about a repeat of the negative performance seen in 2008 and 2009. One can certainly see similarities; however, we believe there are more recognizable and important differences.

Liz Ann Sonders, Chief Investment Strategist at Charles Schwab noted in a recent report,
“the problems in the eurozone are nothing new: too much debt from eurozone member countries to over-leveraged European financial institutions. Adding to the woes is the lack of global competitiveness among many of the zone's members, thanks to the tying of 17 vastly different economies and policies to one (too-strong) currency. The lack of a single fiscal authority within the eurozone that's capable of enforcement or supervision has allowed the problems to fester and the can to be continually kicked down the road (emphasis added).”
There are many differences in Europe’s problems now and the subprime crisis in the U.S. in 2008. On the positive side, much was learned from the crisis in the U.S. and one outcome is the banks in the U.S. are much better capitalized today. Additionally, the crisis in Europe is one of a top down crisis versus the U.S. crisis which started at the bottom with Lehman Brothers, etc. In short then, European governments have a little more time in crafting a solution.

For investors, we recommend focusing on the fundamentals both economically and at the company level. Economically in the U.S., the data continues to come in better than expected. The November ISM manufacturing index report was stronger than expected (52.7 vs. 51.8) and joins a growing list of indicators that suggest moderate economic growth in the fourth quarter of around 3%. Retail sales on Black Friday exceeded expectations and cyber Monday sales were up a better than expected 24%. The labor market continues to show improvement as can be seen in the below charts: ADP’s Private Employment change for November continues to show improvement and announced corporate layoffs continue to decline.

From The Blog of HORAN Capital Advisors

From The Blog of HORAN Capital Advisors

At the company level, valuations for U.S. equities continue to look more attractive. The below chart represents a broader market P/E measure. The NIPA P/E ratio measures earnings from the GDP calculation and divides it into the S&P 500 Index. Using this measure, valuations are at levels last seen in the early 1980’s. In addition to attractive P/E valuations, corporate balance sheets have record levels of cash. This cash is being returned to shareholders in the form of higher dividend payments and stock buybacks.

From The Blog of HORAN Capital Advisors

In conclusion, the economic data continues to come in better than expected and stock valuations are attractive. Certainly, the news coming out of Europe is going to be market moving and volatility will likely remain high. However, in the longer term, company fundamentals will be the ultimate guiding force for future equity valuations and fundamentals look strong.


Friday, November 25, 2011

Investor Sentiment Not As Bad As I Expected

Given all the negative news one is hearing and reading about, I expected investor bullish sentiment to be much worse than actually reported by AAII. Much of the European news is negative and today, at the close of trading, the Dow Jones Industrial Average reported its worst Thanksgiving week performance (-4.8%) since the markets began observing the Thanksgiving holiday in 19421.

As the below chart details, the bullish sentiment declined to 32.7% this week versus last week's reading of 41.9%. Bearish sentiment rose to 38.3% versus the prior week's level of 31.0%. This results in a bull/bear spread of -5.6%. Market bottoms have generally occurred when the bullish sentiment reading falls into the 20%+ range and the bull/bear spread widens to a negative 20+%.

From The Blog of HORAN Capital Advisors

Additionally, the CBOE Equity Put/Call Ratio, although elevated, was reported at .72 on Wednesday. In the case of the equity/put call ratio, a level above 1.0 is a pretty good sentiment level suggesting the market may be oversold.

From The Blog of HORAN Capital Advisors

Lastly, the percent of S&P 500 stocks trading above their 50 day moving average has declined from over 90% at the beginning of November to 21% on Wednesday. The market appears oversold by this measure, however, not significantly.

From The Blog of HORAN Capital Advisors

1The Wall Street Journal


The Euro Crisis: Revisiting Pitfalls Of The Gold Standard

The current issues impacting the Eurozone countries harkens back to the problems with the gold standard in the 1930s. Many believe the U.S. depression in the 1930s was worsened by the fact the U.S. and many other countries were on the gold standard. With the gold standard exchange rates were fixed i.e., depreciating ones currency was not an option. The gold standard did not create the depression; however, it most likely pushed the country into a depression. For more on this, one can read, "The Gold Standard and the Great Depression" in Contemporary European History by Barry Eichengreen and Peter Temin.

With the Euro, currency depreciation is not available to countries like Greece. As a recent Bloomberg BusinessWeek article noted, the option available to these stressed countries is cutting wages and government benefits. Now I am not saying this is a bad idea; however, significant economic contraction occurs. BusinessWeek notes,
"The most unfortunate difference between then and now is that the euro, unlike the gold standard, is a raccoon trap: Its designers deliberately left out an exit procedure. That means you can get in, but you can’t get out without leaving a part of yourself behind. Eichengreen points out that Britain was growing again by the end of 1932, just over a year after abandoning gold under duress. Today a country—say, Greece—that quit the euro would take far longer to right itself. That’s because unlike Britain, to get relief Greece would have to default on its euro-denominated debts and damage its credit rating. "The Greek government," Eichengreen says, 'will be hard-pressed to find funds to recapitalize the banking system. Greek companies won’t be able to get credit lines. The new Greek government is going to have to print money hand over fist. At some point they would be able to push down the drachma and become more competitive. But the balance is different now.'"
In the end, the worst part of the Euro union was the fact it was/is a monetary union and not a fiscal union. The decisions in Europe will be difficult; however, in order to prevent a contagion, the ECB will likely need to structure a facility not too dissimilar than the unpopular TARP program in the U.S. For the ECB though, they would be making loans to countries like Greece and Italy. The alternative is kicking out profligate countries and this would be economically difficult for Europe.

Source:

The Euro: As Good (and Bad) as Gold
Bloomberg BusinessWeek
By: Peter Coy
November 17, 2011
http://www.businessweek.com/magazine/the-euro-as-good-and-bad-as-gold-11172011.html


Thursday, November 24, 2011

Tom Gallagher Interview: Fiscal Policy Currently Has More Influence Than Monetary Policy

Consuelo Mack interviews Tom Gallagher on this week's WealthTrack. Tom was formally with ISI Group until retiring recently and is now a principal at The Scowcroft Group. While at the ISI Group, Tom was voted the #1 analyst on Washington matters by Institutional Investor from 2001-2010. In the interview, Tom notes government policies have rarely been this important or influential in the economy and markets. He discusses what to expect from the White House, Congress and the Federal Reserve and what it means for your investments in this deleveraging environment. He notes where investors focus in the run up to the technology bubble was on capital gains, in this environment, income return from ones investments is where ones focus should be at this point in time.


Tuesday, November 22, 2011

Fearful Investors

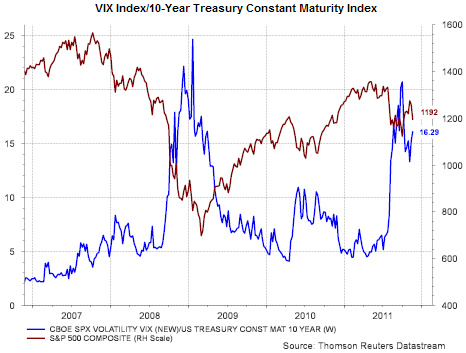
One index measure investors review to gauge the level of fear in the market is the VIX Index. Currently, the VIX is trading at 31.78, down a little over 1 point today. High levels in the VIX translate into a fearful market and can be indicative of a short term market bottoms. In the early part of 2010, the market's first encounter with the Euro crisis, the VIX hit 48. The S&P 500 Index bottomed shortly after this. In other words, the VIX can be viewed as a contrarian indicator.

Another variation of the VIX is to look at the VIX Index divided by the 10-year Treasury Index. Again, high levels in the VIX show investor fear in the equity markets. A low level in the 10-year Treasury indicates bond investors generally have an anemic growth and inflation outlook over the longer term. Consequently, a high ratio number is a contrarian investment measure. The below chart contains a graph (blue line) of this ratio along with a graph of the S&P 500 Index (red line).

From The Blog of HORAN Capital Advisors

h/t: Calafia Beach Pundit


Sunday, November 20, 2011

Job Openings Continue To Rise (JOLTS)

At the end of September, the Bureau of Labor Statistics reported (PDF) there were 3.4 million job openings. This compares to 2.2 million job openings at the end of the most recent recession or a 54% increase.

From The Blog of HORAN Capital Advisors

This improvement in job openings is certainly a positive sign economically; however, companies indicate they are having a difficult time finding qualified employees as noted in this Cincinnati Enquirer article: Wanted: Anyone who can qualify.


Tuesday, November 15, 2011

Dividend Growth Equities Attractive At This Point In The Market Cycle

For dividend investors, one of the keys is to invest in those companies that have a sufficiently high dividend yield that is sustainable and that have high dividend growth rates. Investors focusing only on high yielding stocks run the risk of investing in a company that can not sustain its dividend and then face a dividend cut. Dividend cuts most often have a negative impact on a company's stock price.

As noted by Sudhir Nanda, head of quantitative equity research at T. Rowe Price, "This makes intuitive sense. Companies with growing dividends are signaling confidence about their future earnings. They tend to be stable businesses, well positioned in their markets, and able to perform throughout market cycles, which make them good candidates for long-term growth." The below table details the extra performance gained by those companies that have these dividend characteristics.

From The Blog of HORAN Capital Advisors

Over the long run, dividend growth stocks have outperformed non-growth payers, non-dividend payers and dividend cutters as I have noted in several past posts. Below is a chart separating the stocks by dividend policy for equities in the Russell 1000 Index.

From The Blog of HORAN Capital Advisors

For investors, one factor to keep in mind is dividend paying stocks tend to underperform the overall market in volatile upward market spikes. However, in volatile down market periods, the higher quality dividend growers generally hold up better; and thus tend to outperform over a complete market cycle.

There are many reasons why dividend growth stocks appear attractive in this market environment, not the least of which is they tend to be less volatile. Companies are sitting on record levels of cash and are likely to use some of this cash for increased dividend payments.

The obvious is stocks are not bonds; however, investors looking to increase their allocation to equities should consider dividend paying stocks. On a year over year basis through September 30th, S&P 500 dividend payments are up over 14%. Year to date through November 8th, for companies that have increased their dividend, S&P reports the median increase is 14.55% and the average increase is 27.82%; 27 companies have at least doubled their dividend. This is an attractive growth rate of income investors aren't likely to find in bonds. More on this strategy can be found in my article, Dividends As An Alternative To Low Bond Interest Rates.

Source:

Dividend Growth Stocks May Be Timely As Economy Sputters (PDF)
T. Rowe Price Report
Fall 2011
http://individual.troweprice.com/public/Retail/xStaticFiles/Fall2011PriceReport.pdf


Sunday, November 13, 2011

Third Quarter Earnings Strong, But Q4 Growth Revised Lower

For the third quarter of 2011, 454 companies in the S&P 500 have reported results with 70% reporting earnings above expectations. The estimated earnings growth rate for Q3 is 17.7% according to Thomson Reuters.

From The Blog of HORAN Capital Advisors
 Source: Thomson Reuters

Companies are expressing less optimism about fourth quarter earnings though. Thomson Reuters reports there have been 70 negative EPS announcements for Q4 compared to 22 positive announcements. This equates to a 3.2 negative to positive ratio. This is the highest level of N/P since Q4 2008 when the ratio stood at 3.4. The long term average N/P for the S&P 500 Index is 2.3. Below is a breakdown of the  revised earnings growth rates for Q4 by S&P 500 sector.

From The Blog of HORAN Capital Advisors


Saturday, November 12, 2011

Could The Debt Crisis Come To The U.S.?

italian bond yieldMuch of the volatility impacting global markets of late is the result of the European sovereign debt issues. Italy is the latest country to see its bond rates soar.

According to a recent article in the Wall Street Journal, Italy has €1.9 trillion ($2.6 trillion) in government debt or nearly one-quarter of all euro-zone public debt. Over the course of the next year, Italy must refinance over 15% of its outstanding debt obligations. Given the magnitude of Italy's budget deficit and the recent rise in Italian bond yields, suggests investors are not confident of Italy's ability to deal with these maturities. The size of these debt obligations could be overwhelming for the EU on top of dealing with the debt issues in Greece. This is the type of contagion the EU is trying to prevent.

If history is any guide, past debt defaults by countries have occurred at levels where country debt to revenue levels were much lower. In a November report by Absolute Return Partners they highlighted the debt to revenue ratios of countries today versus these prior country defaults.

From The Blog of HORAN Capital Advisors

One might ask why Japan is not experiencing a crisis. For one, it has a more diverse economy and more importantly, its interest rates remain at very low levels. However, if Greece and Italy are an example, rates can rise very quickly. As noted in Absolute Return Partners' November report, "'A country is bust when the markets decide,'" as stated by Albert Edwards, Societe Generale Cross Asset Research.

So how does the U.S. debt structure compare with countries in Europe that are encountering refinancing risk. If one looks at the country debt level, both on and off balance sheet debt, the U.S. is only behind France in terms of liabilities.

From The Blog of HORAN Capital Advisors

Of potential concern for the U.S. is the level of debt maturing over the course of the next five years.

From The Blog of HORAN Capital Advisors

Compared to many other countries, the percentage of short term debt maturing in less than five years is largest for the U.S.

From The Blog of HORAN Capital Advisors

Of particular concern for the U.S. is the level of its budget deficit in spite of the fact revenues into the treasury continue to grow. The U.S. currently borrows nearly 39 cents for every dollar it spends. Additionally, interest expense is $241 billion or 6% of the government's budget. Given the low level of interest rates on the Treasury's debt, the 10-year Bond is just over 2%, it would not take much of an interest rate spike in the U.S. to negatively impact the government's budget.

Absolute Return Partners highlighted comments from the Fed's summer Jackson Hole Wyoming meeting where the Bank for International Settlements concluded,
"...the debt problems facing advanced economies are even worse than we thought. Given the benefits that governments have promised to their populations, ageing will sharply raise public debt to much higher levels in the next few decades. At the same time, ageing may reduce future growth and may also raise interest rates, further undermining debt sustainability. So, as public debt rises and populations age, growth will fall. As growth falls, debt rises even more, reinforcing the downward impact on an already low growth rate. The only possible conclusion is that advanced countries with high debt must act quickly and decisively to address their looming fiscal problems. The longer they wait, the bigger the negative impact will be on growth, and the harder it will be to adjust."
For the U.S. then, they must address their deficit issues sooner versus later. One significant component will be to create an environment that has a positive influence on economic growth. Additionally, the growth rate in entitlement expenditures must be curtailed. The solutions offered by the ill conceived deficit committee in Washington will certainly be important.


Sunday, November 06, 2011

High Unemployment Is Becoming A Long Term Structural Issue

It appears the high level of unemployment and the underemployment level (U-6) are becoming a long term structural issue. The U-6 has trended somewhat lower; however, seems stubbornly stuck above 16%. Additionally, the unemployment rate seems stuck above 9%.

From The Blog of HORAN Capital Advisors

The mismatch between skills and job openings seems to be more structural as time goes on. As noted by the BLS, the relationship between the unemployment rate and the vacancy rate is known as the Beveridge Curve, named after the British economist William Henry Beveridge (1879-1963). The economy’s position on the downward sloping Beveridge Curve reflects the state of the business cycle. The BLS goes on to note that during an expansion, the unemployment rate is low and the vacancy rate is high. During a contraction, the unemployment rate is high and the vacancy rate is low. The position of the curve is determined by the efficiency of the labor market. For example, a greater mismatch between available jobs and the unemployed in terms of skills or location would cause the curve to shift outward, up and toward the right (emphasis added).

From The Blog of HORAN Capital Advisors

The potential upward shift that may be occurring can be seen in the below chart from July.

From The Blog of HORAN Capital Advisors
Source: Fidelity

This structural change in employment is likely a trend that won't be reversed in a short period of time. Many of the unemployed have been displaced from construction related fields where the unemployment rate is over 20%. Little improvement is seen in construction, both commercial and residential, near term.