Updated: 8/15/09
Below is an updated graph of the 8-period moving average of the bullish sentiment data compared against the S&P 500 Index.
Posted by
David Templeton, CFA
at
9:33 PM
3
comments
Labels: Sentiment
Posted by
David Templeton, CFA
at
11:14 PM
0
comments
Labels: General Market
One question many investors are asking is how long and how high can this market advance. Some of the sentiment indicators are suggesting investors are getting more bullish. Since investor sentiment tends to be a contrarian indicator, the more bullish they are, the closer we are likely getting towards the end of this market advance. What about magazine headlines?
In Barron's this morning, there are several bullish leaning articles:
Posted by
David Templeton, CFA
at
12:21 PM
0
comments
Labels: General Market
Posted by
David Templeton, CFA
at
8:02 PM
0
comments
Labels: Sentiment
Posted by
David Templeton, CFA
at
10:48 PM
0
comments
Labels: Dividend Analysis
Posted by
David Templeton, CFA
at
11:59 PM
0
comments
Labels: Economy , General Market
- July payments were down 31%, marking the lowest July payment since 2002. Companies have been cautious, with the average increase down to 8.5%. This is compared to an average increase of 13.7% in 2008 and 18.2% in 2007.
- Year-to-date, there has been 71 dividend cuts (61 reductions totaling US$-46.1B and 10 suspensions costing US$-1.2B). The Q2 2009 reductions in payments of 23.4% is the worst since the 24.4% decline in Q3 1958.
Posted by
David Templeton, CFA
at
8:30 PM
0
comments
Labels: Dividend Return
Posted by
David Templeton, CFA
at
5:16 PM
0
comments
Labels: Investments
Posted by
David Templeton, CFA
at
3:57 PM
0
comments
Labels: Investments
Posted by
David Templeton, CFA
at
1:07 PM
0
comments
Labels: Dividend Analysis
Posted by
David Templeton, CFA
at
9:41 PM
0
comments
Labels: Sentiment
Posted by
David Templeton, CFA
at
9:20 PM
0
comments
Labels: Dividend Analysis
Posted by
David Templeton, CFA
at
6:57 AM
0
comments
Labels: Economy , General Market
Posted by
David Templeton, CFA
at
12:50 PM
0
comments
Labels: General Market , Investments
Posted by
David Templeton, CFA
at
9:15 PM
0
comments
Labels: General Market , Sentiment
Posted by
David Templeton, CFA
at
8:07 PM
0
comments
Labels: Dividend Analysis
In June, the ALFFI climbed five points to 52.45 from 47.48 in May — which itself was a 10 point+ increase from April. This is the highest reading since last October (when we saw 63.15). Four of the six ALFFI’s components registered gains last month, with the core intermediate producer price index and the CRB posting declines. This index is designed to predict changes in the direction of the Federal Reserve’s target rate. It certainly seems as if the next move will be to the upside.
Posted by
David Templeton, CFA
at
2:09 PM
4
comments
Labels: Bond Market , Economy , General Market
When approaching a cyclical turning point in U.S. economic growth, the growth rate of the U.S. Long Leading Index (USLLI) typically turns first, followed by the growth rate of the Weekly Leading Index (WLI), growth in the U.S. Short Leading Index (USSLI) and growth in the U.S. Coincident Index (USCI). Notably, the levels of the USLLI, WLI and USSLI are all rising. In fact, the chart below shows that by May, USLLI growth (top line) had already surged to a four-year high. Meanwhile, WLI growth (second line) has spurted to a two-year high, having crossed into positive territory. Following in their footsteps, USSLI growth (third line) has shot up to a one-year high, though it's still in negative territory...
...But the sequential upswings in the leading indices aren't just about less negative growth -- we have pronounced, pervasive and persistent upswings in a succession of leading indices of economic revival, the most powerful possible predictor of a business cycle recovery. What's impressive here is the degree of unanimity within and across these leading indices, along with the classic sequence of advances in those indices. Such a combination of upturns doesn't happen unless an end to the recession is imminent.
If so, why is there such broad pessimism among analysts? The problem is a widespread inability to distinguish among leading, coincident and lagging indicators, along with the vast majority of economic indicators that don't fall neatly into any of those three categories. Thus, indicators are typically judged by their freshness, not their foresight. Because most market-moving numbers are coincident to short leading, while corporate guidance is often lagging, it's no surprise that analysts don't discern any convincing evidence of an economic upturn.
The arguments marshaled by standard-bearers of the pessimistic consensus hold little water. Usually, their "analysis" is based on gut feel, bolstered by any seemingly plausible argument that would support their case...
Posted by
David Templeton, CFA
at
10:23 PM
1
comments
Labels: Economy , General Market
Posted by
David Templeton, CFA
at
9:32 PM
0
comments
Labels: Sentiment
Posted by
David Templeton, CFA
at
9:11 PM
0
comments
Labels: General Market , International
Posted by
David Templeton, CFA
at
9:52 PM
0
comments
Labels: Economy , General Market
Posted by
David Templeton, CFA
at
9:29 AM
0
comments
Labels: Technicals
Posted by
David Templeton, CFA
at
11:31 PM
0
comments
Labels: Sentiment
- During June, the NO-I jumped to a reading of 18.4, bringing the second-quarter average sharply into positive territory (at 16.7).
- The New Orders minus Inventory Index...has offered the most-promising indication of an economic trough.
- This barometer accurately identified the troughs in 1990-91 and 2001 recessions.
Posted by
David Templeton, CFA
at
8:32 PM
2
comments
Labels: Economy
- ...federal deficits will likely average as much as 6% of GDP through 2019, contributing to a jump in debt held by the public to as high as 82% of GDP by then - a doubling over the next decade. Worse, barring aggressive policy actions, deficits and debt will rise even more sharply thereafter as entitlement spending accelerates relative to GDP. Keeping entitlement promises would require unsustainable borrowing, taxes or both, severely testing the credibility of our policies and hurting our long-term ability to finance investment and sustain growth.
- the federal deficit has ballooned to US$1.8 trillion or 13% of GDP in fiscal 2009. But the bulk of the threat is structural: The fiscal stimulus package included spending increases with minimal bang for the buck, leaving more debt than growth.
- most important, by 2019 the full force of rising entitlement outlays and debt service will begin to hit the budget. No rosy growth scenario will provide sufficient resources to meet all the claims on future federal revenue. And while tax hikes or a broader tax base will likely be part of the solution, the real cure is to curb the growth of entitlement spending.
- in 2010, some 100 million Americans will be enrolled in Medicare, Medicaid and SCHIP (the State Children's Health Insurance Program), and outlays amount to 5% of GDP. Longer term, Medicare enrollment will rise significantly as the population ages. More importantly, future per capita cost growth for both programs is well in excess of per capita GDP, meaning that outlays for these three programs will double to 10% of GDP by 2035 and nearly double again by 2080. Translated into budget outcomes, according to CBO, these programs will account for virtually all of the likely growth in primary federal spending - total spending less interest on debt held by the public - in relation to GDP, and thus all the likely expansion of the deficit and debt. In contrast, social security cost increases will play a relatively minor supporting role.
Posted by
David Templeton, CFA
at
11:28 PM
0
comments
Labels: Economy
Posted by
David Templeton, CFA
at
8:16 PM
0
comments
Labels: Dividend Analysis
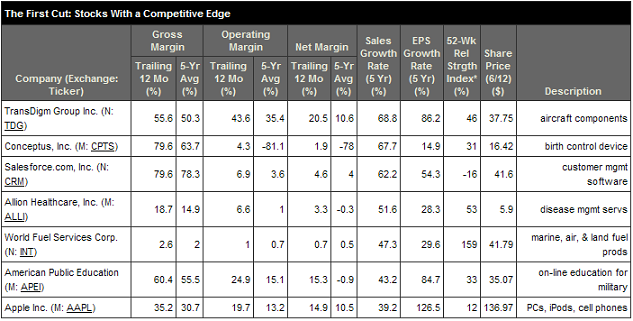
"Earnings are dependent on the ability of a company to convert sales into profits. Converting a large and growing proportion of sales into earnings often points to firms that have a competitive advantage, due to brand-name loyalty, a limited niche, or even patent protection. The First Cut this issue screens for companies turning a larger percentage of sales into gross profits, operating profits and net profits."
- Gross profit margin: calculated by dividing gross income (sales less the cost of goods sold) by sales. It reflects the firm’s basic pricing decisions and its material costs.
- Operating profit margin: calculated by dividing operating income by sales. Operating income represents income generated after all costs except interest, taxes, and non-operating items. The operating margin reflects the relationship between sales and management-controlled costs (the cost of goods sold, as well as operating costs including selling, administrative and general expenses; research and development expenses; and depreciation).
- Net profit margin: calculated by dividing net income by sales. It indicates how well management has been able to turn sales into earnings available for shareholders.
Posted by
David Templeton, CFA
at
3:03 PM
0
comments
Labels: Investments
Posted by
David Templeton, CFA
at
12:46 PM
2
comments
Labels: General Market , Sentiment , Technicals
Posted by
David Templeton, CFA
at
6:20 PM
2
comments
Labels: General Market