The month of January was not kind to U.S. equity investors. The S&P 500 Index ended the month down 3.00% and the Dow Jones Industrial Average was down 3.58%. The small cap and mid cap indices did not fare much better. On the surface, European equities appeared to be a bright spot with the S&P Europe 350 Index up 7.27%. However, for a U.S. investor not hedging the Euro/Dollar currency exchange, virtually all of this gain was lost in the currency translation back to the Dollar. The S&P Europe 350 Index was up a marginal at .09% in US Dollars.
From a sector perspective, the defensive sectors were the bright spot as can be seen in the below graphic. For the month utilities were up 2.37% and Health Care was up 1.23%, A bit surprising was the weakness seen in the consumer discretionary sector which was down 3.06%. Consumers seem to be restraining their spending even though they are realizing a large savings at the gas pump.
 |
| From The Blog of HORAN Capital Advisors |
Source: S&P Dow Jones Indices
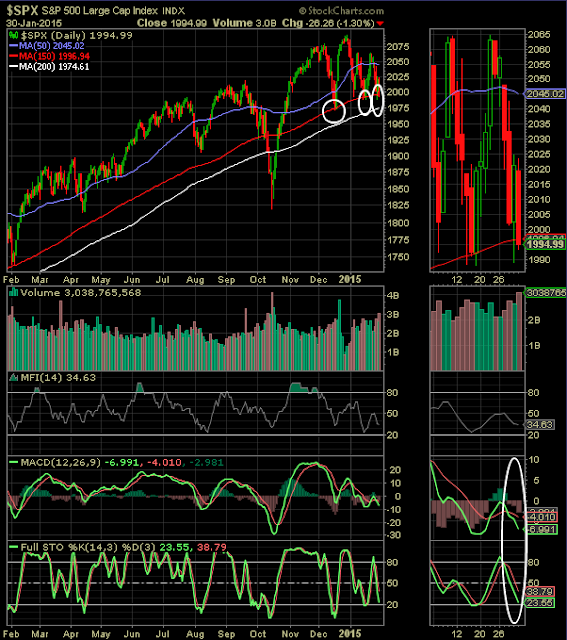
From a technical perspective, the market is not at an extreme oversold level but has approached an important support level, the 150 day moving average. On Friday, the S&P 500 Index closed at 1994.99 which is just below the 150 day M.A of 1996.94 as can be seen in the below chart. The 50 day M.A. has served as important support for the market over the past three years.
 |
| From The Blog of HORAN Capital Advisors |
Other technical indicators, such as the MACD and stochastic, are nearing levels indicative of a market that is nearing a potential bounce. In my mind though, these technical indicators could see a little more weakness before the market does move higher. The percentage of stocks trading above their 50 and 150 moving average also are not at extreme levels, but are at levels where market recoveries occurred in the rally during the last several years.
 |
| From The Blog of HORAN Capital Advisors |
Of a bit of concern is individual investor sentiment seems to be shaking off this resent pullback. For example, the American Association of Individual Investors reported bullish investor sentiment increased seven percentage points to 44.17% last week, which is above the long term average of 39%. Additionally, the bull/bear spread widened to 21.78% from 6.35% in the prior week. The long term bull/bear ratio average is 8.6%.
 |
| From The Blog of HORAN Capital Advisors |
Lastly, the CBOE equity put/call Ratio declined as of Friday to .68, which means a slight increase in investor bullishness. This, along with the AAII sentiment indicator, is a contrarian one and both would suggest a little market weakness before a bounce ensues. As noted before on our blog, these sentiment indicators are most predictive when at extreme levels though.
 |
| From The Blog of HORAN Capital Advisors |
Consumers are a critical component to economic activity and what they say has not yet translated into what they are actually doing. However, positive consumer sentiment is likely to lead to an improving consumer sector as we move out of winter and into the summer. As Econoday noted last week, Friday's University of Michigan consumer sentiment report was another strong and positive one.
"Consumer sentiment held on to its very strong surge at the beginning of the month, ending January at 98.1 vs the mid-month reading of 98.2 and compared against 93.6 in December. The current conditions component extended its first half gain to 109.3 vs 108.3 at mid-month and against 104.8 in December. The comparison with December points to strength for January consumer activity. The expectations component ends January at 91.0 vs 91.6 at mid-month and 86.4 in December. Price expectations are low, at 2.5 percent for 1-year expectations, up 1 tenth from mid-month but down 3 tenths from December, while 5-year expectations remain at 2.8 percent, unchanged from both mid-month and December. Consumer spirits are now very strong but have yet to translate to a similar pickup in consumer spending."
 |
| From The Blog of HORAN Capital Advisors |
Source: Econoday
For investors then, the market's action around the 150 day moving average in the days ahead will be important. The near oversold levels reached by the MACD and the stochastic indicators, just naming a few, are indicative of a market that is nearing a position where an oversold bounce could occur. Certainly of concern is the fact the S&P 500 Index has been making lower highs and lower lows so far this year.

No comments :
Post a Comment