Thursday, April 30, 2009

Bullish Investor Sentiment Stuck In A Range

This week's sentiment survey released by the American Association of Individual Investors indicated an increase in individual investor bullish sentiment. The bullishness level increased to 36.09% versus last week's level of 31.82%. For the week of April 16th, the bullishness level stood at 44.14%.

The bull/bear spread was reported at -8% versus last week's spread of -7%. The spread became more bearish as more investors indicated a bearish view of the market: 43.61% versus 38.64% last week.

The chart of the market and sentiment for the current period is beginning to play out like the June 2002 - March 2003 period. Maybe a coincidence or maybe the current market needs to come close to retesting the early March 2009 low.

(click to enlarge)


Wednesday, April 29, 2009

The Market Is Definitely Overbought, But...

What to do now is the question of the day for those investors with cash on the sidelines: and it is a lot of cash. Now is the time to take a step back and evaluate where the market was in early March and where it is today.

In early March, investors were selling. The media was talking about a major economic and market meltdown at that time. And I will be the first to admit, I was not too constructive on the market in early March either. Since that time though, the market has embarked on a significant advance. Some cautionary technicals noted in the below chart are the MACD is negative and volume has been declining.

(click to enlarge)

S&P 500 Index April 9, 2009Today the S&P 500 Index closed at 873 which is above its 150 day moving average of 869. The 50 day moving average appears to have bottomed and started to move higher. These factors are just a couple of positive technical factors.

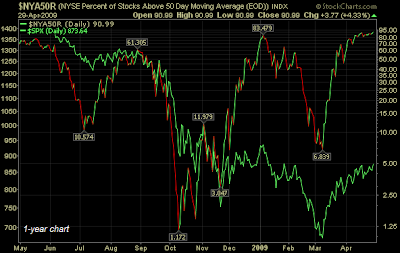
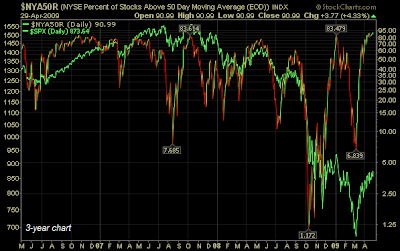
Additional cautionary data is the fact that over 90% of the NYSE stocks are trading above their 50 day moving average. At the March 9th low only 7% of NYSE stocks were trading above their 50 day moving average. As the below chart notes, when the 50 day percentage gets into single digits, it is generally a good time to begin building positions in stocks. On the other hand, when this average is above 80%, the S&P does have a tendency to sell off or at least consolidate some recent gains.

(click to enlarge
1-year chart)


NYSE percentage stocks above 50 day moving average(click to enlarge
3-year chart)

NYSE percentage stocks above 50 day moving averageNow is the time to be selective in the stocks that are being purchased. There are companies trading at attractive values, but paying attention to stock fundamentals and dividend characteristics are important at this juncture in the market.


Monday, April 27, 2009

Credit Markets Slowly Improving

Efficiently functioning credit markets are integral to sustaining growth for the economy. Certainly, the Fed and Treasury are doing their part in pushing this improvement forward. There will be consequences down the road, i.e., higher inflation? For the time being though, getting the economy (GDP) growing again is the Fed's primary goal.

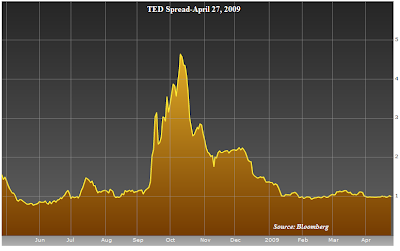
The TED spread, the difference between 3-month LIBOR and the 3-month Treasury bill rate, has narrowed significantly from its peak in October of last year.

(click to enlarge)

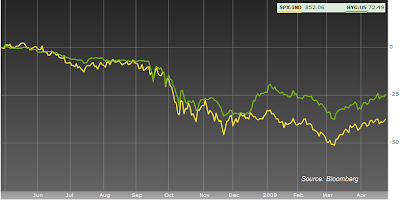
TED spread April 27, 2009One outcome of the improved credit markets has been an improvement in the performance of high yield debt. One measure of the high yield debt market is the iShares iBoxx $ High Yield Corporate Bond ETF (HYG). High yield bonds tend to have volatility characteristics not to dissimilar from stocks. The recent improvement in the performance of the HYG ETF is also an indication of a better functioning credit market.

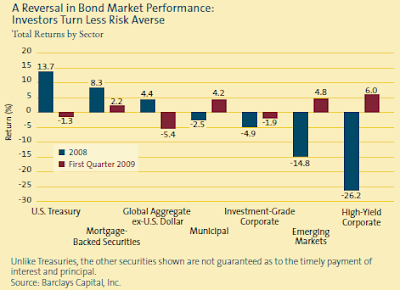
HYG and S&P 500 Index chart April 27, 2009And what a difference a year makes. The high yield market was one of the worst performing segments of the fixed income markets in 2008, but, the first 3 months of this year have high yield leading the fixed income performance segment.

(click to enlarge)

segments of bond market performance 3/31/2009Source: T. Rowe Price Report (pdf)

And lastly, a look at some spread data.

credit spreads April 27, 2009Source: Dallas Federal Reserve (pdf)

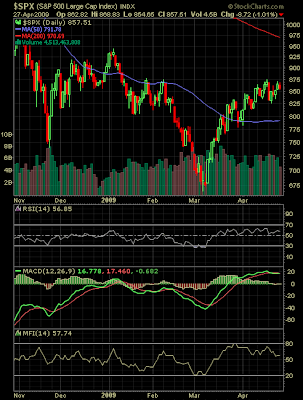
The economy could certainly be at an inflection point where "less bad" economic data is viewed as a positive. In other words the rate of change or second derivative of a number of data points is now positive. If the economy continues to show improvement, just maybe, stocks can finish the year in positive territory. That is not to say their won't be pullbacks along the way. The market has bounced hard off the early March lows.

(click to enlarge)

S&P 500 Index chart April 27, 2009But, if an investor is looking for some "equity like" diversification, high yield might be considered as a part of ones investment portfolio.


(Disclosure: I hold a long position in HYG)


Thursday, April 23, 2009

Dividend Increases Keep Coming: Johnson & Johnson & Kellogg

Not all dividend paying companies are reducing their dividend or forgoing dividend increases.

Today Johnson & Johnson (JNJ) announced a 6.52% increase in the company's quarterly dividend. The new quarterly dividend is 49 cents per share versus 46 cents per share paid in the same quarter last year. The estimated payout ratio is 40% based on 2010 estimated earnings of $4.86. The 5-year average payout ratio is 40%. The company carries an S&P Earnings & Dividend Quality Ranking of A+.

In addition to JNJ's announcement, Kellogg (K) stated they would be increasing the company's 3rd quarter 2009 dividend 10.29%. The new quarterly rate of 37.5 cents per share compares to 34 cents per share paid in the 3rd quarter of 2008. The estimated payout ratio is 48% based on 2010 estimated earnings of $3.10. The 5-year average payout ratio is 49%. The company carries an S&P Earnings & Dividend Quality Ranking of A.

(click table/chart to enlarge)

Johnson & Johnson and Kellogg dividend analysis table April 2009
Johnson & Johnson stock chart April 2009
Kellogg stock chart April 2009


Tuesday, April 21, 2009

J. M. Smucker Co. Increases Dividend 9.4%

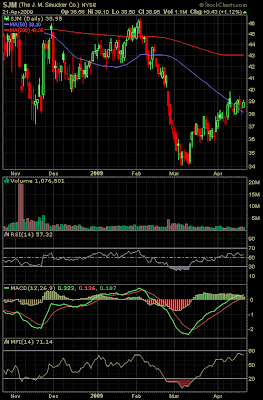
Today, The J. M. Smucker Co. (SJM) announced a 9.38% increase in the company's quarterly dividend. In the 4th quarter of 2008, SJM acquired Procter & Gamble's Folgers coffee business. Near that same time, Standard & Poor's added SJM to the S&P 500 Index.

Smucker does not technically meet my definition of a dividend growth stock since the company has not maintained uninterrupted dividend growth over the course of the past 10-years. SJM went from June 2000 through June 2002 without increasing the dividend. On the other hand, over the course of the last five years, the company has grown the dividend just under 7% per year.
  • The most recent announcement has the company increasing the quarterly dividend to 35 cents per share payable June 2009 versus 32 cents per share in the same quarter last year.
  • The projected payout ratio is approximately 41% based on estimated April 2010 year end earnings of $3.36 per share. The 5-year average payout ratio is 38%.
  • The company has a S&P Earnings & Dividend Ranking of A+
J. M. Smucker dividend analysis table April 2009
J. M. Smucker stock chart April 2009


Monday, April 20, 2009

Festival of Stocks #137

Welcome to the April 20, 2009 edition of festival of stocks. I received a fairly large number of article submissions and included most of them below.

STOCKS

Ben Graham NCAV formula stocks, Cheap Graham Stock Ideas posted at Old School Value.

A southeast utility stock analysis, Progress Energy, Inc. (PGN) posted at Dividends Value.

ChinaMed - Retooling and Rebounding posted at ZachStocks.

Research In Motion Has Growth posted at FastSwings.com - Steve Patterson.

Stock price comparison and Fair Value Estimates for Best Small Companies posted at Old School Value.

Thor Industries Company Update posted at Bootstrap Investing.

INVESTING

There are Bullish Days Ahead But Bear Is Lying In Wait For The Kill posted at Jeflin's Investment Blog.

When Will The Economy Turn? posted at The Penny Daily.

On the Repeal of Mark-To-Market Accounting posted at The Iconoclast Investor.

The Importance of Return on Capital posted at MagicDiligence - Optimizing Joel Greenblatts Value Stock Strategy.

An example of distressed debt investing with regards to valuing Six Flags and their debt Distressed Debt Analysis - Six Flags posted at Distressed Debt Investing.

The Japanese Banking Crisis of the 1990's: Are We Facing a Similar Stagnation? posted at The Personal Financier.

Why have bank shares risen so far, so fast? posted at Monevator.com.

Investing Tips For The Beginning Stock Picker posted at The Digerati Life.

S & P Index and Crude Oil Market Trends: Next Steps? posted at The Smarter Wallet.

A Reminder on Why I Shouldn't Buy Ultrashort ETFs posted at My Wealth Builder.

Volatility Index Continues to Fall posted at FastSwings.

Do Americans Support Capitalism, and Which Capitalism? posted at Britannica Blog.

Vanguard Launched FTSE All-World ex-US Small-Cap ETF posted at The Sun’s Financial Diary.

How Municipal Bond Investors Have Avoided the Recession posted at Fine-Tuned Finances.

Advanta High Yield Notes: 8.5% - 11% Yield Worth the Risk? posted at Darwin's Finance.

An argument against reinvesting dividends posted at Make me money.

TRADING

A video on How Day Trading Works According to Einstein posted at Top Dog Trading.

What Is Forex Trading? posted at Investment-For-Beginners Blog.

Consumer Reports America’s Best Brokers posted at Blueprint for Financial Prosperity.

Global Watch List monitor to track trades around the globe posted at Internet Stock Trading for Beginners.

Zecco, TradeKing and ShareBuilder Review posted at Cash Money Life.

Transfer an account to TradeKing and receive up to $150 in Transfer Fees posted at Cash Money Life Deals.

FINANCIAL PLANNING

What is the Rule of 72? posted at FIRE Finance.

Learning to be Happy with Less posted at KCLau's Money Tips.

In order to fix ones debt problems there are 25 Debt Reduction Tips For Your Immediate Action Plan posted at Money Ning.

Being prepared for retirement means Leaving Your Money in Your Retirement Accounts! posted at Cash Money Life.

If you are a big spender on a budget Here's the "Naked Truth" About Money posted at SectorMatic Money Journal.

REAL ESTATE

New home buyers receive Free Money from the Government posted at Out of Debt Christian.

Bidding on foreclosed property then you need to know How To Make An Offer In Today’s Real Estate Market posted at Tallahassee Real Estate Blog.

How To Construct A Well-Written Real Estate Offer posted at Really Better Real Estate.

That concludes this edition of the Festival of Stocks. Submit your blog article to the next edition of festival of stocks using our carnival submission form. Past posts and future hosts can be found on our blog carnival index page.


Sunday, April 19, 2009

Market Signaling Better Economic Environment Ahead?

The Chart of the Day charting service published a chart last week noting market performance two months before the start of a recession and the period following a recession. As noted on the chart, the stock market (S&P 500 Index) tends to begin its decline several months before the onset of a recession. The chart illustrates the average performance of the S&P 500 since 1945 following the beginning of a recession (blue line). The extend of the market's decline following the start of the recession for the 2001 recession and the most recent recession that began in December 2007 has been more severe.

market performance before and after recessionsSource: Chart of the Day

I am not sure I would go all in based on this chart, but an investor should note the market will anticipate an improving economic environment.


Wednesday, April 15, 2009

Diversification and Correlation During Market Crisis Periods

One factor that has been painfully clear in this market downturn is the high correlation of nearly all asset classes. The result for investors is nearly all the asset classes experienced significant declines during the recent market contraction. So what is the purpose of diversification if it does not minimize the negative portfolio returns during stress market periods? The answer begins with the question as to what are investors trying to diversify.

During periods of market stress there tends to be two factors that influence the price of investments:
  • there is a flight to quality and
  • a high demand for liquidity
This flight to quality and demand for liquidity causes investors to flock to the safest investments. For fixed income this tends to be government bonds and for equities it tends to be high quality equities. These high qulaity equities tend to be large cap blue chip dividend growth stocks.

A recent paper by Barclays Global Investors titled, Is Diversification Dead?, provides more detail on the conundrum for investors as it relates to the diversification issue.

Is Diversification Dead
In the end though, it is difficult to predict when the market will experience these significant drawdowns. For investors, building the foundation of the equity portion of their investment portfolio in high quality dividend paying stocks is one way to potentially gain some assurance they will not experience significant market value erosion in market downdrafts.

As I have written several times before, when the market rallies off of a bottom during these corrective phases, the higher quality equity investments will likely lag the broader market returns though.


Tuesday, April 14, 2009

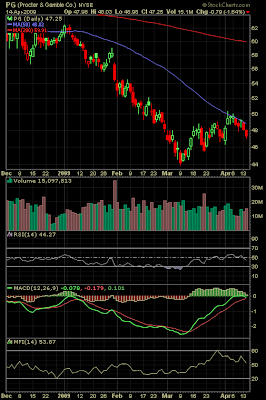
Procter & Gamble Announces 10% Dividend Increase

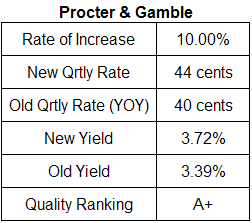
After the market close today, Procter & Gamble (PG) announced the company's quarterly dividend will be increased 10% to 44 cents per share versus 40 cents per share in the same quarter last year. The increase is in line with the company's 10-year historical dividend growth rate of 9.8%.
  • The projected payout ratio is 43% based on the June 2010 year end earnings estimate of $4.07. The company is estimated to earn $4.23 per share for the year ending June 2009. The 5-year average payout ratio is approximately 40%.
  • P&G carries an A+ S&P Earnings and Dividend Quality Ranking.
(click to enlarge)

Procter & Gamble dividend analysis table April 2009
Procter & Gamble stock chart April 2009


Monday, April 13, 2009

Consumer Sentiment and Spending Positively Correlated

It is not surprising that a recent paper published by the Chicago Federal Reserve notes a high positive correlation between consumer spending and consumer sentiment. Keep in mind this does not mean there is a causal relationship, merely a correlated one.

The spending data detailed in the below chart is through 2006. The most recent BLS data is through 2007 and notes a 2.6% increase in 2007 which was lower than the 4.3% increase in 2006.

consumer sentiment and spending chart May 2009The paper notes the top household income quartile is most impacted by changes in the stock market (i.e., S&P 500 Index).
"Higher income consumers are more sensitive to associated changes in the stock market, as reflected in the Standard and Poor’s (S&P) 500 Index; a 1 percentage point increase in the index is associated with a 0.43 percentage point increase in consumption spending for this group."
Additionally, the policies out of Washington are likely having an impact on consumer sentiment as it relates to the top two income quartiles. Policies that are not favorable for corporate earnings; thus, negatively impacting the stock market, are likely to constrain consumer sentiment and spending. The paper notes:
"...it might be useful for policymakers to understand the differences in the macroeconomic indicators for different groups...sentiment is particularly informative with regard to consumption spending in a context of greater uncertainty in income..."

Source:

Trends in Consumer Sentiment and Spending
Chicago Fed Letter
By: Maude Toussaint-Comeau, economist, and Daniel DiFranco, associate economist
May 2009
http://www.chicagofed.org/publications/fedletter/cflmay2009_262.pdf


Sunday, April 12, 2009

Market Volume In Downtrend

The market's recent move higher since March 9th has certainly been impressive. A number of technical indicators are supporting this positive trend; however, volume continues in a downtrend. The more pronounced volume decline can be seen on the below chart of the weekly S&P 500 Index ($INX), keeping in mind this past week was a holiday shortened one.

(click to enlarge)

s&p 500 index weekly chart April 9, 2009The daily chart shows resistance at the 875 level for the S&P 500 Index ($INX). Additionally, the Money Flow Index has been trending lower since reaching near 80 on March 26th.

(click to enlarge)

s&p 500 index chart April 9, 2009Given the improvement in investor sentiment, the declining MFI and the lower trending volume, I would not be surprised to see the market digest some of the recent gains near term. Earnings reporting season swings into full gear and some reports could trigger some corrective action.


Thursday, April 09, 2009

Investor Bullish Sentiment Trend Moving Higher

Although the American Association of Individual Investors sentiment survey reported a drop in bullish sentiment (35.71% vs. 42.66%) this week, the 8-period moving average continues to trend higher. This 8-period average of the bullish sentiment came in at 29.2% this week versus last week's reading of 27.4%.

(click to enlarge)


In addition to the improving trend in bullish sentiment, investors seem to be putting their feelings into action. The Investment Company Institute reports money market cash levels have declined to $3.834 trillion for the period ending April 1, 2009 versus the March 4, 2009 level of $3,903 trillion.


Tuesday, April 07, 2009

First Quarter Not Kind To Dividends

Today Standard & Poor's reported first quarter dividend activity and it certainly was not favorable. Not only were a record number of companies slashing their dividends, other payers were not increasing dividends as well. Howard Silverblatt, Senior Index Analyst at Standard & Poor’s notes:
"...since 1955, the average has been 15 increases for every decrease. Now its three increases for every four decreases.”
Following are some statistics on the first quarter dividend activity:
  • a record 367 of the approximately 7,000 publicly owned companies that report dividend information to Standard & Poor’s Dividend Record decreased their dividend payment. This represents a 332% increase from the 83 issues that decreased their dividend during the first quarter of 2008.
  • a record low 283 issues announced they will increase their dividend payment – a 52.7% drop from the 598 issues that reported dividend increases during the first quarter of 2008.
Source:

S&P: Q1 Worst Quarter for Dividends Since 1955;
Companies Reduce Shareholder Payments by $77 Billion

Standard & Poor's
By: Howard Silverblatt & David R. Guarino
April 7, 2009
http://www2.standardandpoors.com/spf/pdf/index/040709_US-Dividends.pdf


Saturday, April 04, 2009

Dividend Aristocrats Mostly Underperforming Year To Date

Standard & Poor's Dividend Aristocrats are underperforming the broader U.S. domestic indexes. on a year to date basis. Through April 4th, the Aristocrats have generated a return of -7.20% compared to the S&P 500 Index return of -6.70% and the Nasdaq Index return of +2.80%. The Aristocrats have managed to outperform the Dow Jones Industrial Average Index that has returned -8.60% so far this year. Although financials are the worst perming sector in the S&P 500 Index year to date, only four of the bottom ten performers are financial stocks.


Thursday, April 02, 2009

Dividend Aristocrat Universe Shrinking

Given the difficult economic environment, stocks of companies that pay a dividend have increasingly elected to reduce or eliminate dividends in order to conserve cash.

S&P reports actual first quarter dividend payments for companies in the S&P 500 Index were down 15.99% and this is the worst rate of decline since the -24.44% decline in the third quarter of 1958. David Blitzer, chairman of S&P's index committee, indicates S&P may need to loosen the criteria used to judge whether companies qualify for the Aristocrats Index. The big hurdle is a company has to have demonstrated annual increases in the dividend for at least 25 years.

S&P makes adjustments to the Aristocrats Index in December and only companies that paid more this year compared with 2008 will be retained . S&P's Aristocrats list currently contains 52 companies. Based on dividend cuts by some of the Aristocrats and "no increase" by companies in 2008, the potential list of firms that will be eligible for the index could fall below 40. This would be the lowest number of firms since 1992.

The 2009 Dividend Aristocrats list is detailed below.


Full Screen View

Bloomberg reports, "the Dividend Aristocrats Index returned an annualized 9.1 percent a year since 1989, compared with 6.6 percent for the S&P 500 Index, the main benchmark for American equities. It lost as much as 49 percent from its 2007 peak, while investors in the S&P 500 retreated as much as 57 percent." In spite of the fact the markets have declined by a significant amount, the Aristocrats have outperformed the S&P 500 Index.

Consequently, I believe S&P should not reduce the criteria used to determine the eligibility of companies for the Aristocrats membership. Companies that can increase their dividend every year over at least 25 years tend to be firms that have or project a strong earnings and cash flow profile. In the end it isn't the number of stocks you own, but owning the right stocks.


S&P ‘Dividend Aristocrats’ Dwindle as Payouts Are Cut
Bloomberg
By:
Elizabeth Stanton
April 2, 2009
http://www.bloomberg.com/apps/news?pid=20601213&sid=a4VGpAMPzUy0&refer=home