Sunday, November 30, 2008

Dividend Aristocrats Outperforming Through November

A preliminary review of the year to date performance of S&P's Dividend Aristocrats shows they are outperforming the major U.S. domestic indexes. Through the first eleven months of 2008, the Aristocrats have generated a capitalization weighted return of -22.4% versus a -39.0% return for the S&P500 Index. The return for the Dow Jones Industrial Average and the NASDAQ composite index is -33.4% and -42.1%, respectively.

The spreadsheet below details performance information for each ofthe Aristocrats. It shouldbe noted the Anheuser-Busch was removed from the S&P 500 Index as of November 18th due to it being acquired by InBev (INBVF).


Saturday, November 29, 2008

High Quality Dividend Stocks Near 52-Week Low

In an environment where the economy is going through a deleveraging process, investing in higher quality firms that rely on lower levels of debt can be beneficial from an operating perspective. Below is a small list of A+ rated companies with market caps greater than $5.0 billion and debt to cap less than 35%.


CompanySymbolS&P RankMarket CapDividend YieldDebt/Cap% Above 52-week Low
Sysco CorpSYYA+$13.4B3.94%31.9%13.1%
Johnson & JohnsonJNJA+$161.7B3.16%23.7%12.5%
PepsicoPEPA+$85.3B3.10%31.6%14.0%
General DynamicsGDA+$19.9B2.79%14.0%8.1%
Stryker Corp.SYKA+$15.6B.86%.4%10.0%
DanaherDHRA+$17.2B.22%21.0%13.8%


Friday, November 28, 2008

Bear Market Recoveries: Returns Occur Early In New Cycle

Once a bear market cycle ends, a large portion of the returns in the next bull market occur early in the new bull market cycle.

Schwab Center for Financial Research, with data from Morningstar, Inc. (MORN) reviewed total monthly returns of the S&P 500 Index ($INX) from January 1926–September 2008. Cash is represented by total returns of the 30-day T-bill. The 15 historical bear markets analyzed are defined as periods with cumulative declines greater than 10% and durations of at least six months, and do not include the current market.

As the below table notes, a large portion of the bull market returns historically occur in the first year following the bear market.

(click to enlarge)

bear market recovery table
Given the recent market volatility, it is prudent to review ones overall asset allocation. During this review, one of the hardest temptations to overcome can be the desire to move more investment assets to cash. Certainly if funds are needed near term, cash needs to be set aside. Keep in mind though, large returns tend to occur in short bursts and early in the new bull cycle. In just the last five trading days, the S&P 500 Index is up 19.1%.

Source:

Ready for the Rebound? (PDF)
By:Bryan Olson, CFA
Charles Schwab & Co.
November 17, 2008
http://www.schwab.com/cms/P-727392.35/2008_11_SPC_Investing_Insights_newsletter.pdf?cmsid=P-727392


Thursday, November 27, 2008

Gasoline Declines From Record High

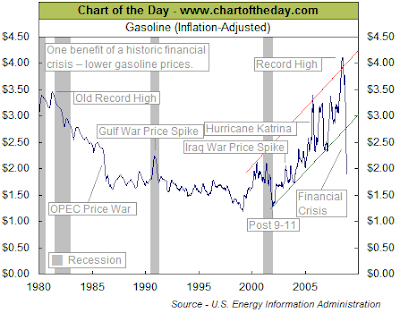
The average price of a gallon of unleaded gasoline has declined over $2.00 during the course of the last 4+ months. As the below chart notes, we are approaching levels seen in September 2001.
  • This decline in gasoline prices represents a savings of over $300 billion in gasoline costs for consumers. This is equivalent to a tax cut of the same amount.
  • U.S. driving mileage is running 89 billion miles per year less now than it was a year ago. The price decline represents only a 1.3% decline in total U.S. oil use.
  • The total decline in U.S. oil use is running roughly 5% according to the EIA. As a result, the difference between the 1.3% and 5% must be a result of less driving by individuals and/or less use by trucking companies.
(click to enlarge)

gasoline price chart as of November 26, 2008Source: Chart of the Day

Source:

Less Driving and Lower Gas Prices are Not the Important Factor
Energy Investment Strategies
By: Jim Kingsdale
November 21, 2008
http://www.energyinvestmentstrategies.com/2008/11/21/less-driving-and-lower-gas-prices-are-not-the-important-factor/


S&P 500 Stocks With Market Cap Less Than $1 Billion

As a follow up to my earlier post today on Liz Claiborne's (LIZ) upcoming removal from the S&P 500 Index on December 1, 2008, following is a list of stocks in the S&P 50 with market caps below $1 Billion. Are these stocks potential candidates to be removed from the Index?


Retail Out Of The S&P 500 Index

Yesterday, Standard & Poor's announced Liz Claiborne (LIZ) will be removed from the S&P 500 Index after the close of trading on December 1, 2008. Replacing Liz Claiborne is Dun & Bradstreet (DNB). Liz Claiborne drops down to the S&P Smallcap 600 Index.

Retail stocks have seen their market capitalization shrink due to an underperforming consumer. Is it possible other retail related stocks are at risk of being removed from the S&P 500 Index?

Following is a screen that details some consumer stocks in the S&P 500Index that have a market capitalization less than $5.0 billion.


Individual Investor Sentiment Improves

The American Association of Individual Investors reported investor bullish sentiment increased as of the period ending November 26, 2008. The bullishness level improved to 31.25% versus last week's level of 24.37%. The bull/bear spread narrowed to -14% versus -33% last week.

(click to enlarge)


Wednesday, November 26, 2008

McCormick & Co. And Becton Dickinson Increase Dividend

Both McCormick & Co. (MKC) and Becton Dickinson (BDX) announced increases in their quarterly dividends today.

McCormick & Co.

McCormick & Co. announced a 9.1% increase in the company's quarterly dividend.
  • The new quarterly dividend increases to 24 cents per share versus 22 cents per share in the same period last year.
  • The projected dividend payout ratio is approximately 41% based on November 2009 estimated earnings per share of $2.36. This payout compares favorably to the 5-year historical payout ratio of 41%.
  • MKC carries an S&P Earnings & Dividend Quality Ranking of A+
Becton Dickinson

Becton Dickinson announced a 15.8% increase in the company's quarterly dividend.
  • The new quarterly dividend increases to 33 cents per share versus 28.5 cents per share in the same period last year.
  • The projected dividend payout ratio is approximately 27% based on September 2009 estimated earnings per share of $4.88. This payout compares favorably to the 5-year historical payout ratio of 26%.
  • BDX carries an S&P Earnings & Dividend Quality Ranking of A and is one of S&P's Dividend Aristocrats.
(click table/chart for larger image)

McCormick & Co. and Becton Dickinson dividend analysis table November 2008
McCormick & Co. and Becton Dickinson stock charts November 2008


Tuesday, November 25, 2008

Investing Carnival For November 25, 2008: Ready For A Bounce?

Welcome to the November 25, 2008 edition of the investing carnival. There were a large number of submissions this week and I had to leave a few out in order to keep the carnival at a reasonable length. The articles were submitted over the course of last week. The tone of many of these articles seem to be predictive of the market bounce experienced the past two trading days.

Dividend Investing

Top dividend stocks with reasonable payout ratios (MagicDiligence - Optimizing Joel Greenblatts Value Stock Strategy)


Stock Analysis

A potentially huge reward with an asset play in Value Vision Media Inc (VVTV). (Old School Value)

An in depth analysis of Sysco Corp (SYY). (Dividends 4 Life)

Even Berkshire-Hathaway's (BRK/A) stock is suffering in this market. (Intelligent Speculator)

Is Baidu.com's recent decline a buying opportunity? (Intelligent Speculator)

Screening the Forbes Best Small Companies list for investment opportunities. (Old School Value)

Can Citigroup regain its footing? (Smart Money).

Smith & Wesson & Ruger-are they shooting blanks? (Tough Money Love » Hard Truth and Tough Love for Money Problems and Personal Finance)

The losers in the Volkswagen and Porsche merger battle. (My Simple Trading System)


Investing

A review of the book Investing for Dummies. Maybe a good read for all investors? (Living Almost Large)

Insight into performing fundamental stock research. (Finance-Information)

Financial issues impacting individuals beyond just the stock market. (KCLau's Money Tips)

A primer on the Price to Earnings ratio or P/E. (Investing School)

10 better investments than the market. (Learn The Stock Market And How to Trade)

More bold predictions from Jim Rogers. (Subprime Blogger)

Does one quarter of negative GDP growth equal a recession? (The Political and Financial Markets Commentator)

Inflation protection strategies for ones portfolio. (FIRE Finance)

Tips on staying afloat in this market. (Beating The Stock Market)

Reduce fund expenses with Vanguard Admiral shares. (Free Money Finance)

Investments for a depression like economy. (Zignals blog)

Advice on getting your investments back on track. (The Iconoclast Investor)

Investing through TreasuryDirect. (Wealth Junkies)

Is your 401(k) account safe. (The Digerati Life)

A review of the best asset allocation on a historical basis. (Ripe Trade)

When analyzing a company, read the footnotes in the financial statement. (Value Investing and Entrepreneurship by Qovax)

The importance of choosing the right asset allocation. (The Sun’s Financial Diary)


Value Investing

Obama's energy plan may benefit these stocks. (The Green Investing Blog)


Alternative Investments

Don't fall for stock option "get rich quick" schemes. (Michael James on Money)


Wealth Accumulation

10 steps to building ones wealth. (Money Blue Book)

Tips on saving money by reducing household expenses. (Money Blog)

If one consolidates their debt, they need to cut their expenses too. (Finance Tips 101)


That concludes this edition. Submit your blog article to the next edition of investing carnival using the carnival submission form. Past posts and future hosts can be found on our blog carnival index page.

* image at beginning of post courtesy of CNN Money


Monday, November 24, 2008

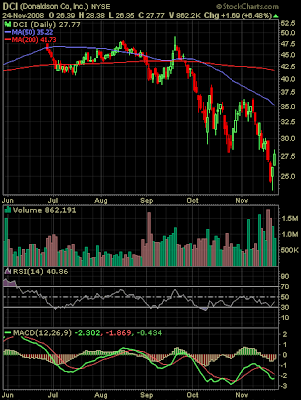
Donaldson Co. Increases Dividend 4.5%

Last week Donaldson Co. (DCI) announced a 4.5% increase in the company's December quarterly dividend to 11.5 cents per share. The new dividend compares to 11 cents per share paid in the same quarter last year. The projected payout ratio, based on estimated earnings of $2.27 for the year ending July 2009, is in line with the 5-year historical payout ratio of 20%. DCI is one of the companies in the S&P 1500 that has increased its dividend for at least 10-years. The company carries an S&P Earnings & Dividend Quality Ranking of A+.

(click table/chart for larger image)

Donaldson dividend analysis table November 2008
Donaldson stock chart November 2008


Sunday, November 23, 2008

Don't Overreach For Dividend Yield

(I originally posted this article on The DIV-Net website on November 16, 2008)

The recent decline in equity prices and near record low interest rates, have enticed stock investors to focus on higher yielding dividend paying stocks. One must keep in mind though, a stock's dividend yield is not the same as comparing yields on certificates of deposit.

"After all, if one invests primarily for current income, it might seem logical that stocks with the highest yields would be best. The popularity of the “Dogs of the Dow” approach would seem to support that assumption. However, the Dow Dogs approach is designed to beat major averages through price appreciation; the high yield under that approach is merely an indicator of possible undervaluation."
The stocks that trade at higher yields tend to be the ones that are at the highest risk of a dividend cut. Ideally, stocks with lower yields and the ones that grow the dividend on a regular basis tend to be the type of stock that outperforms the market over the long run.

This year's performance of the high dividend yield approach of the Dogs of the Dow strategy offers some evidence that a high yield approach does not always mean higher total return. The year to date return as of November 21, 2008 for the Dow Dogs equals -50.0% versus the return on the Dow Jones Index of -39.3%.

The dividend-discount model is based on the assumption that dividends ultimately drive share price. If a firm doubles its dividend over a certain time, its stock price should also double if interest rates do not change.

Thus, the percentage rate of dividend growth drives and equals the expected rate of increase in share price. From that equivalence, we can derive this formula for expected percentage total return:

Expected Total Return =
Expected Dividend Growth Rate +
Current Dividend Yield

One event that is occurring with companies and the overall economy is the process of deleveraging. In this environment investors should likely look to invest in those firms that have lower debt levels. The risk of only investing in low debt level firms is when the market/economy improves, leverage can actually enhance a company's earnings, resulting in better performance in a somewhat leveraged company. For those interested, this leverage factor enhances ROE through the equity multiplier as detailed in the Dupont Model.

A few financial measures useful for dividend oriented investors to review are:
  • Common shareholder’s equity as a percentage of total capital
  • Short-term debt as a percentage of total debt (or of total capital)
  • Dividend payout ratio
  • Dividend growth rate
  • Frequency of dividend increases
  • Price-to-book-value ratio
There is no perfect model to use when evaluating dividend paying firms. However, watching the trend in the above factors, like payout ratio, frequency of dividend increase, etc., can provide clues into when a company might be anticipating earnings weakness in the future. Don't simply get trapped buying the highest yielding stocks, then suffer through a dividend cut. Company's that cut their dividend tend to see a contraction in the company's stock price.

Source:

Equity Income Investing: Beware of Yield Overreaching ($)
AAII Journal
By: Donald Cassidy
May 1999
http://www.aaii.com/includes/DisplayArticle.cfm?Article_Id=822


Saturday, November 22, 2008

Sysco Increases Dividend 9%

On Wednesday Sysco (SYY) announced it will increase its first quarter 2009 quarterly dividend by 9.09%. The new quarterly dividend increase to 25 cents per share versus 23 cents per share in the same quarter last year. A detailed analysis of Sysco can be found at the Dividends4Life website.

(click chart for larger image)


Friday, November 21, 2008

Nike's Dividend Sprints Higher

Nike (NKE) announced the company's January 2009 dividend is increasing 8.7%. The new quarterly dividend of 25 cents per share is 2 cents higher than the 23 cents per share paid in the same period last year. The projected dividend payout ratio will equal 25% based on May 2009 year end earnings of $3.99. The 5-year historical average payout ratio equals 19%. Nike carries an A+ S&P Earnings and Dividend Quality Ranking.

(click for larger image)

Nike dividend analysis table November 2009
Nike stock chart November 2009


Historical Stock Market Corrections

The Chart of the Day detailed prior stock market corrections going back to 1900 for the Dow Jones Industrial Average. Corrections are defined as those that decline more than 15%. As the below chart notes, this correction is the fourth worst correction since 1900; however the length or duration of the correction is below the average of prior corrections.

  • Since 1900, the Dow has undergone a major correction 26 times or one major correction every 4.2 years.
  • Of the 26 major stock market correction since 1900, the current stock market correction currently ranks as the fourth largest in magnitude (only the corrections beginning in 1906, 1929, and 1937 were greater) and is the most severe stock market correction of the post-World War II era.


Thursday, November 20, 2008

Big Drop In Investor Sentiment

Just a quick note regarding the American Association of Individual Investors' sentiment report released this morning. Individual investor bullish sentiment feel to 24.37% versus last week's reading of 38.33%. The bull/bear spread came in at -32.77% compared to last week's level of -4.17%. Along with my post on the investor sentiment cycle yesterday and this data point, maybe this serves as some confirmation that we are in the discouragement phase of the sentiment cycle.


Wednesday, November 19, 2008

Where Are We In The Investor Sentiment Cycle?

It is often said that the market is driven by fear and greed. These emotional influences tend to create the peaks and valleys that are all to typical in the stock market cycle. At the end of the day though, fundamental stock and economic factors will determine the long run performance of the market. However, in these stress periods, it is important to try and determine where the investor is emotionally in terms of market sentiment.

In a recent comment by Charles Kirk of The Kirk Report, he felt the market has entered the discouragement phase. As the below chart notes, the discouragement phase comes after the capitulation phase and begins the market bottoming process.

Investor Sentiment Cycle ChartSource: Invivo Analytics

The Invivo Analytics site contains a full discussion of The Investor Sentiment Cycle.

As the below chart of the weekly performance of the S&P 500 Index notes, most of this years loss has occurred in the last eight weeks.

(click for larger image)

S&P 500 Index chart November 19, 2008
Could this eight week decline of nearly 35% be an indication the market has gone through the panic phase? If so, maybe the market goes through a bottoming process (discouragement phase) over the next several weeks. It would certainly be nice to see this play out and have the market start climbing that "wall of worry".


Monday, November 17, 2008

John Hussman's View Of The Market

John Hussman's weekly commentary, he notes the market is at a point where he can "begin" to take on some equity risk. He notes though:
"That's not to say that I believe stocks have “hit their lows.” We always have to allow for the market to move significantly and unexpectedly, and there is plausible downside risk from here. Our activity as investors is not to try to identify tops and bottoms – it is to constantly align our exposure to risk in proportion to the return that we can expect from that risk, given prevailing evidence."
He still has the equity in the company's Strategic Growth Fund (HSGFX) hedged 70-80%.

The commentary, The Stock Market is Not in "Uncharted Territory" begins:
One of the fallacies about the recent financial turbulence is that the markets are in “uncharted territory” and that there are no historical precedents for the volatility, panic, or economic uncertainty that we've observed. To make statements like this is to admit that one has not examined historical evidence prior to the 1990's. The fact is that we've observed similar panics throughout market history. This decline has been deeper and more rapid than most, but that is largely a reflection of the rich valuation and overbought condition that characterized the market in 2007 (see the July 16, 2007 comment A Who's Who of Awful Times to Invest).
The entire commentary is a worthwhile read.

Source:

The Stock Market is Not in "Uncharted Territory"
Hussman Funds
By: John P. Hussman, Ph.D.
November 17, 2008
http://www.hussmanfunds.com/wmc/wmc081117.htm


Lancaster Colony Increases Dividend

Today, Lancaster Colony (LANC) announced the company's December quarterly dividend is increasing 1.8% to 28.5 cents per share. This is a half cent increase over the 28 cent quarterly dividend paid in the same quarter last year. The estimated payout ratio equals 56% based on June 2009 estimated earnings of $2.03. The 5-year average payout ratio is approximately 50%. and the company has an S&P Earnings & Dividend Quality Ranking of B.

(click for larger image)

Lancaster Colony dividend analysis table Noember 17, 2008
Lancaster Colony stock chart November 17, 2008


Sunday, November 16, 2008

Spam: The New Economic Indicator

Hormel Spam ProductThe New York Times recently reported that Hormel Foods Corporation (HRL) plant that produces Spam has been operating at a furious pace to keep up with the demand for its inexpensive Spam products. Workers at the plant have been told to expect the pace to continue and will only have Thanksgiving Day and Christmas Day off in the coming months.

Through war and recession, Americans have turned to the glistening canned product from Hormel as a way to save money while still putting something that resembles meat on the table. Now, in a sign of the times, it is happening again, and Hormel is cranking out as much Spam as its workers can produce.
When the demand for Spam falls, maybe this will be a sign of better economic times ahead.

Source:

Spam Turns Serious and Hormel Turns Out More

The New York Times
By: Andrew Martin
November 14, 2008
http://www.nytimes.com/2008/11/15/business/15spam.html?_r=1&partner=rss&emc=rss&oref=slogin


Saturday, November 15, 2008

BetterInvesting's Most Active Stocks: November 15, 2008

BetterInvesting allows its members to indicate which stocks are attracting interest among club members. For the period ending November 15, 2008, 183 transactions were reported by members as attracting the most interest. The small sample of investors indicates Walgreen (WAG) is being sold rather than accumulated.

(click for larger image)

Stocks mentioned above:

General Electric (GE)
Walgreen (WAG)
Johnson & Johnson (JNJ)
Pepsico (PEP)
Cognizant Technolgy Solutions (CTSH)
Pfizer (PFE)
Fastenal (FAST)
Caterpillar (CAT)
BP PLC (BP)
Intel (INTC)


Friday, November 14, 2008

China Slowdown: A Drag On Global Growth

A large player in the global/emerging growth story has been China's economic growth. Just as China was instrumental in the growth of the emerging markets, the countries recent slowdown is impacting global economic growth as well.

(click chart for larger image)


The China government may report economic data in a more favorable light than what is actually occurring in the country. Consequently, growth could be much slower than reported. On Monday, China did announce a $586 billion economic stimulus package. This is an indication of how slow the GDP growth is in China. A few recent posts touch on the real impact China's slowdown is having on factories and unemployment.
One index to watch that might provide a clue to a pickup in global growth is the Baltic Dry Index. As the below chart notes shipping prices have declined significantly over the last several months. This is an indication that demand has fallen for overseas shipping vessels that often transport important commodities like iron ore and coal. More information on the Baltic Dry Index can be found at the below link.

Baltic Dry Index chart Nov


Thursday, November 13, 2008

When Does The Individual Investor Capitulate?

Interestingly, the individual investor sentiment as reported by the American Association of Individual Investors remains at levels that would suggest the market could correct further. This is only a technical indicator; however, the current bullishness reading of 38.33% remains above levels seen in other bear market bottoms--24.5% in 2002 and 16.5% in 2005. The current reading is down from last week's level of 44.83%. The bull/bear spread deteriorated to -4% versus last week's reading of 12%.

(click graph for larger image)


Wednesday, November 12, 2008

Lack Of Confidence Is A Major Issue Impacting The Market

Over the course of the last month and a half I have written a few posts citing the lack of confidence as a key element in the market's current weakness. To be sure, there are fundamental factors that need to be addressed to get the economy on firmer footing as well. Some of those factors:
  • reduction in consumer and government debt levels
  • unwinding of derivatives exposure
  • stopping the bailout of every company
One major issue that is pulling down confidence is the overhang of the potential new tax policies that will be coming out of Washington under the new Obama administration. Raising taxes in an environment of economic weakness historically has not proved a positive for an economy that is in recession.
  • Obama's desire to uncap the payroll tax has very negative implications for businesses and individuals.
  • Eliminating the deductibility of 401(k) contributions reduces the incentive to save. It is saving, and not spending, that more individuals need to make more of a habit.
  • Increasing benefit costs related to health care provided by employers. This policy does not promote hiring.
In times of economic weakness, raising taxes and instituting policies that discourage employers from hiring will not stimulate economic growth. President-Elect Obama and his advisers would be wise to make a statement that they will not raise taxes in any form on individuals and business during economic times like we are in currently.

Related Posts:

Washington Needs To Trim The Fat

Income Tax Uncertainty Weighing On Market

Updated 11/15/2008:

Wall Street Journal article, Targeting Your 401(k)


Tuesday, November 11, 2008

S&P 500 Index: More Changes

Standard & Poor's has been busy recently with changes to the composition of the S&P 500 Index. S&P noted in the case of General Growth Properties (GGP) that the company's market cap had declined to $128 millon making it the smallest company by market cap in the S&P 500 Index. The changes occur after the close of trading on the date noted in the table. Below are the upcoming changes to the Index.

(click tables for larger image)

S&P 500 Index Changes November 12 & 14, 2008
S&P 500 Index Changes November 13, 2008

Companies mentioned:

General Growth Properties (GGP)
Cephalon (CEPH)
Wynn Resorts (WYNN)
Dentsply (XRAY)
Ashland (ASH)
Hercules (HPC)


Sunday, November 09, 2008

One Factor On My Mind With This Market

I am a bit of a contrarian when it comes to buying stocks. There are many factors I use when evaluating stock investments and a large number of them indicate some stocks are trading at compelling valuations. However, one factor that is on my mind is the fact many investment newsletters and magazine investment articles indicate investors should be buying stocks at this time. Historically, market bottoms do not occur when investment pundits are bullish.

I took a look at an article in the April 17, 2000 BusinessWeek titled, Time To Keep A Cool Head. In the article it was noted:
"The most dangerous thing an investor can do is overreact in this kind of market," says Rick Adkins, a certified financial planner with Arkansas Financial Group. Instead of panic selling when share prices are plunging, wait a few days until you can make a rational decision to sell, not an emotional one.

Reasons not to sell are often forgotten at times of market turmoil. For one, many institutional investors are "looking to tap the irrational behavior of the individual investor," says Adkins. That means savvy money managers may be waiting to gobble up the shares you sold at bargain prices. That seems to be what happened earlier this week, when Janus Capital Corp. and others began buying stocks voraciously around midday Tuesday.

...In the last decade or so, the stock market has usually rebounded within days of a big sell-off. You can't count on a fast snap-back every time, of course. But if you start dumping shares, odds are you'll buy them back later at a higher price. (emphasis added) "If you thought that the stock you bought was good value yesterday, it's likely to be a good value today unless something fundamental has changed in the company's prospects," says Harold Evensky, a partner with Evensky, Brown & Katz, a financial planning firm.
At the time the above article was written, the S&P 500 Index was off a little over 8% from its high. Subsequent to the article, the market declined an additional 30+%.

What are some of the investment advisers saying today?

T. Rowe Price. Market Turmoil: T. Rowe Price's Perspective (PDF)
“There are very attractive opportunities now,” says Bill Stromberg, director of global equities and of global equity research. “Companies in the heartland of industrial America, many technology companies, and many health care companies are thriving in this environment and reporting pretty good earnings. We’re trying to take advantage of widespread selling to pick them up cheap.
Charles Schwab & Co. 6 Tips for 401(k) Investing in Today's Volatile Market
  • I agree with this article's advice on rebalancing ones investment portfolio back towards ones target asset allocation. I think a key question is where are we in the investment cycle as noted in the below chart.
(click chart for larger image)

market cycle graph
BusinessWeek, September 18, 2008. Buy, Sell, or Stay Put? Advice From The Pros.
Stephen Wetzel, a financial planner and adjunct professor of financial planning at New York University, is far less circumspect. "I'm buying like a crazy man: value stocks, financial services, value funds, muni bonds, some international small cap. You don't get opportunities like this very often."
Certainly we have seen a substantial pullback in the global markets over the course of the last 12-months. And, having broached this topic, maybe we are at the bottom. I would be more encouraged if more bear market articles were being written though. On the other hand, selectively building positions in high quality companies that have seen their valuations decline to attractive levels, is likely an acceptable strategy at this point in the market cycle.


Look Forward And Not Back When Formulating Investment Decisions

(The following article was originally published on The DIV-Net website on November 2, 2008)

There is no argument that this is a bear market. During times like this, investors do have a tendency to shape their investment expectations based on historical events. Given the magnitude of the market's decline, it may seem comfortable to remain on the investment sidelines. Historically though, large market advances have occurred in the periods following bear markets.

As the below table outlines, the magnitude of this bear market puts the decline as one of the five worst--declining 43%. However, returns one year following the market trough have averaged 46% over the last 13 bear markets.

(click table for larger image)


  • Every bear market is different, and the beginning of a new bull market is only known with the benefit of hindsight.
  • However, bear markets have inevitably given way to market rebounds.
Source:

Bear Necessities: Down Markets Often Breed Opportunity ($)
Market Analysis, Research & Education
A unit of Fidelity Management & Research Company
October 21, 2008
http://personal.fidelity.com/products/publications/


Saturday, November 08, 2008

Diversification Not Working In This Cycle

It is often noted by investment experts that diversifying ones investments across the different asset classes (small, mid, international, etc.) will provide an investor with better returns. And not just better returns, but better returns on a risk adjusted basis.

In this bear market cycle, the below tables note that no market has been spared this year or since the market peak in October of 2007.

(click table for larger image)

Global Equity Market Returns table through October 31, 2008
Not surprisingly then, correlations have increased across all markets as noted in the table below. Standard & Poor's observations detail the magnitude of some of the moves higher in correlations for some of the markets:
  • The MSCI-EAFE index, a developed international equity benchmark, is now moving in unison with the S&P 500 index 89% of the time, up from 80% on August 31.
  • The MSCI Emerging Markets index’s correlation to the 500 has jumped to 81% from only 68% two months ago.
  • The MSCI Frontier Market index, long touted for its ability to “zig” when the 500 “zags,” has seen its 500 correlation surge to 63% from a mere 9% on August 31.
  • Lower capitalization stocks have offered no refuge, as the MSCI Global ex-U.S. Small & MidCap index has seen its correlation to the 500 rise to 87% from 74% two months earlier.
(click for larger image)

Global Equity Market correlations as of October 31, 2008It is not uncommon for global markets to become more correlated in severe bear markets. Maybe this higher correlation will be a positive when markets begin to recover?

Source:

Dwindling Diversification ($)
The Outlook
Standard & Poor's
By: Alec Young, International Equity Strategist
November 12, 2008
http://www.outlook.standardandpoors.com/NASApp/NetAdvantage/servlet/login?url=/NASApp/NetAdvantage/index.do


Friday, November 07, 2008

S&P 500: Out With Technology In With Financial

Today Standard & Poor's announced Unisys Corp. (UIS) would be replaced in the S&P 500 Index by People’s United Financial Inc. (PBCT). The UIS will be removed after the close of trading on November 10th and PBCT will be added after the close of trading on November 12th. Could this be a contrarian indicator indicating more favorable returns for technology?

(click for larger image)

Unisys and Peoples United Financial added to S&P 500 Index


Thursday, November 06, 2008

Bullish Investor Sentiment Moves Higher

The American Association of Individual Investors reports investor bullish sentiment increased for the period ending November 6, 2008. Bullish sentiment increased over seven percentage points to 44.83% versus last week's level of 37.14%. Most of the improvement came from lower bearish sentiment. The bull/bear spread improved to +12% versus last week's spread of -3%.

(click graph for larger image)


Wednesday, November 05, 2008

Obama Policy And Sector Rotation

With much amazement today, most pundits were asking themselves what would be the Obama policies and what would be their impact on the economy and market in the days to come. I would have hoped the media would have asked those question prior to the election and not after.

One thing is important though, and it was best said by a Naval officer from Afghanistan about his service to this country, "I don’t do this for the Commander in Chief. I do this for my country, and I will continue to do so." The message in this is we all will continue to support this country and her president and certainly wish the best of success to President-Elect Obama as he navigates through these tough economic times.

As new policies are put into place though, there will be certain market sectors that do better than others. Consequently, as portfolios are tweaked going forward, increasing or decreasing exposure to the appropriate market sectors could be important. Following is a link to the Prophet.Net website that contains a graphic that details the trend in relative strength by sector/subsector. A snapshot of the graphic is contained below.


Lastly, Todd Sullivan's ValuePlays website contains a post on the "Obama Trade" titled So, The Election is Over Where to Invest that may be of interest to some readers as well.


Tuesday, November 04, 2008

Dividend Payers Outperform Non-payers In October

The dividend payers in the S&P 500 Index outperformed the non-payers in October 2008 on an average return basis. The payers' return equaled -20.39% versus the non-payers' return of -21.87%. However, the average return for both payers and non payers came in worse than the Index weighted return of -16.80%. As the below table details, this was the case for the year to date and 12-month periods as well.


Emerson Electric Increases Dividend 10%

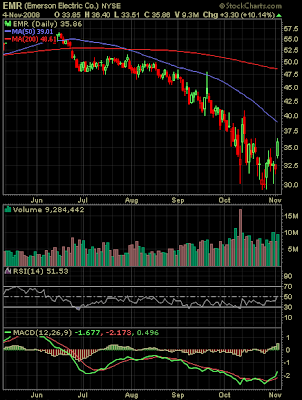
Today, Emerson Electric (EMR) announced a 10% increase in the company's 4th quarter dividend. The new quarterly dividend increases to 33 cents per share versus 30 cents per share in the same quarter last year. The projected payout ratio is approximately 40% based on 2009 estimated earnings of $3.28. The 5-year average payout ratio is approximately 49%. EMR carries an S&P Earnings & Dividend Ranking of A.

(click for larger image)

Emerson Electric dividend analysis table November 4, 2008
Emerson Electric stock chart November 4, 2008


Sunday, November 02, 2008

Dividends Critical Component Of Total Return

Standard & Poor's recently published a paper noting that dividends are not only a critical component of total return, but dividends serve as a cushion in down markets. The paper notes:
  • Historically, dividends have contributed nearly one-third of the equity return of the S&P BMI World Index, while capital appreciation has contributed approximately two-thirds.
  • When bond yields are low, income oriented investors can switch to dividend paying stocks to enhance current income.
  • Dividends allow investors to capture the upside potential while providing downside protection in the down markets.
In looking at the period "August 1989 to September 2008, dividends contributed approximately 28% of the total equity return of the S&P BMI World Index, while price appreciation contributed roughly 72%. From August 1999 to September 2008, dividend income accounted for as much as 52.05% of total return."

The below chart details the contribution of dividends to the monthly total returns of the S&P BMI World Index over the last 19 years.

(click chart for larger image)

dividend income percent of total return BMI World IndexAnd the fact dividends serve as a cushion is noted below:

(click chart for larger image)

dividends as cushion in down marketsLastly, the compounding of dividends adds significantly to the total return of ones investment. For the 18-year period from January 1990 to December 2008 the price only return for the S&P BMI World Index totaled 101.77% versus the total return (dividends included) on the World Index over that same time period of 146.58%.
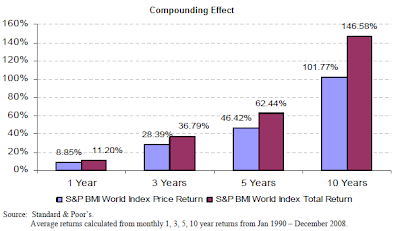
(click charts for larger image)

dividend compounding effect on total return BMI World Index
dividend cumulative return BMI World Index
In the end, pursuing an investment strategy that incorporates dividend paying stocks can serve to enhance ones return in down markets. Additionally, the S&P report notes the importance of dividends to the overall return of an index or more specifically stocks.

Source:

Dividend Investing (PDF)
Standard & Poor's
By: Aye M. Soe and Srikant Dash, CFA, FRM
October 2008
http://www2.standardandpoors.com/spf/pdf/index/Dividend_Investing.pdf


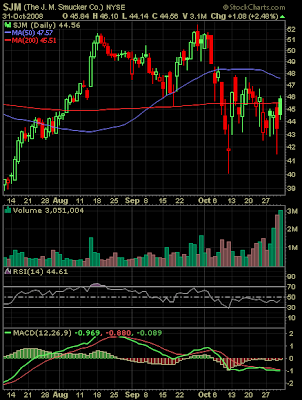
J. M. Smucker Co. To Be Added To S&P 500 Index

Last week, Standard & Poor's announced it would be adding J.M. Smucker Co. (SJM) to the S&P 500 Index after the close of trading on Wednesday November 5, 2008. SJM is acquiring the Folgers coffee business from Procter & Gamble (PG) effective midnight Novemebr 5, 2008. Smuckers will replace Terex (TEX) in the Index.

(click chart for larger image)

J. M. Smucker stock chart October 31, 2008
Source: Standard & Poor's (PDF)


Saturday, November 01, 2008

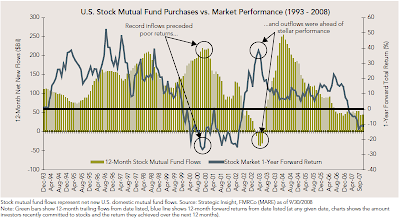
Investor Fund Inflows Highest At Market Tops

Not too surprisingly, mutual fund investors tend to ramp up their fund purchases at the top of the stock market cycle. The below chart shows the one year forward return (blue line) along with the current period mutual fund flows.

(click chart for larger image)

mutal fund cash flows and market return
The result of this poor market timing is investors' long run returns tend to be lower than the market returns since they miss the top performing market days.

(click chart for larger image)

chart performance if missing the best performing market daysIt has been said a number of times in this recent market environment, that the best time to buy stocks is when it feels the most uncomfortable. October made this difficult to believe given the punishment the market took in that month. In fact, Friday's (10/31/08) positive market advance was the first time the Dow Jones Industrial Average recorded two consecutive up days since September 26th.
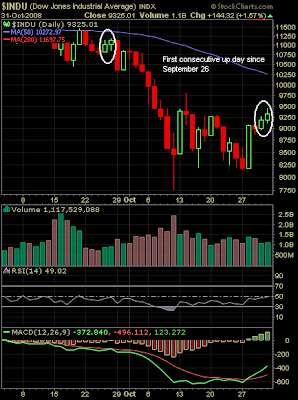
(click chart for larger image)

Dow Jones Industrial Average chart October 31, 2008
Overcoming the emotional aspects of the market can be tough; however, maybe investment opportunities are surfacing in this type of market environment.

Source:

Stock Market: Exit At Your Own Risk ($)
Market Analysis, Research & Education
A unit of Fidelity Management & Research Company
October 16, 2008
http://personal.fidelity.com/products/publications/


Dividend Aristocrats Outperform In October And YTD

Preliminary performance results for S&P's dividend aristocrats shows they continued to outperform the broader U.S. market indexes in the month of October.

dividend aristocrats performance summary October 31, 2008Detail on the individual aristocrats is accessible in the below spreadsheet. The full aristocrats spreadsheet is viewable by clicking the Aristocrats link.