As noted in the chart below, the S& 500 Index remains in a downtrend since mid-October 2007.
(click on chart for larger image)

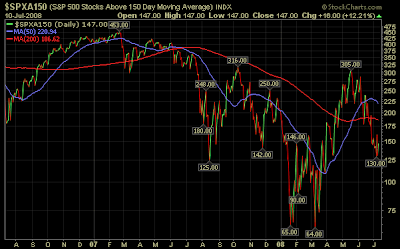
However, given the intermediate oversold level of the S&P 500 Index, it is possible we could see a bounce higher in the market in the near term. The percentage of S&P stocks trading above their 50 day moving average is 10 percentage points below the level hit in March of this year when the market bounced off of a low. On the other hand, the percentage of stocks trading above their 150 day moving average is quite a bit higher than the level reached in March 2007 (see below charts.)
(click on charts for larger image)


No comments :
Post a Comment