Thursday, January 31, 2008

Bullish Investor Sentiment Turns Up

In the American Association of Individual Investors sentiment survey released today, bullish sentiment turned higher to 30.08% versus last week's 25.14%. The long term average of bullish sentiment is 39%. However, the 8-period moving average declined to 29.8% versus the prior reading of 31.1%. The bull/bear spread also improved to -19% after recording readings in the -30% range for the prior four week's.

(click on chart for larger image)

investor sentiment January 31, 2008


Wednesday, January 30, 2008

McGraw-Hill Companies Increases Dividend 7.3%

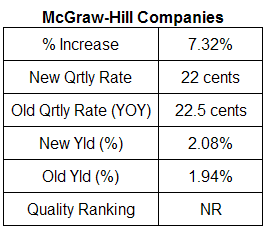
McGraw-Hill Companies (MHP) announced a 7.3% increase in the companies quarterly dividend. The new quarterly dividend increases to 22 cents per share versus 20.5 cents per share in the same period last year. The payout ratio of 30% (based on 2008 estimated earnings per share of $2.94) is in line with the 5-year average payout ratio for MHP of 30%. The company does not carry an S&P Quality Ranking as the company owns the rating agency Standard & Poor's.

(click on table/chart for larger image)

mcgraw hill dividend analysis table January 30, 2008
mcgraw hill stock chart January 30, 2008


Tuesday, January 29, 2008

Dividend Aristocrats Performance Update: January 29, 2008

It has been several months since updating the performance of the Standard & Poor's dividend aristocrats. Given all the news surrounding sub prime loans and the housing market more broadly, one would think financials are the leading underformers. In fact, not one financial stock is listed in the bottom ten performing aristocrats for the 3-month period ending January 29, 2008. Admittedly, a number of financials have generated strong price performance in the month of January; thus, reducing the extent of the underperformance in some financial stocks.

The 3-month period is chosen since this captures a large part of the market's decline. During this time period, the S&P 500 Index is down 11.3% and the NASDAQ Index is down 15.9%. The aristocrats generated a negative return of 10.1%.

(click on table for larger image)

s&p dividend aristocrats performance January 29, 2008


Monday, January 28, 2008

Arthur J. Gallagher Increases Dividend 3.2%

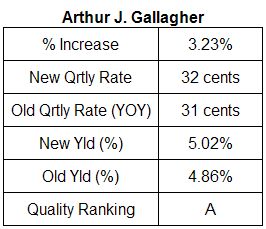
Today Arthur J. Gallagher (AJG) announced it was increasing the company's quarterly dividend by one cent per share or 3.2%. The new quarterly dividend will equal 32 cents per share versus 31 cents per share in the same period last year. The payout ratio is approximately 80% based on estimated 2008 earnings per share of $1.61. The company carries an S&P Quality Ranking of A.

(click on table/chart for larger image)

Arthur J. Gallagher dividend table January 28, 2008
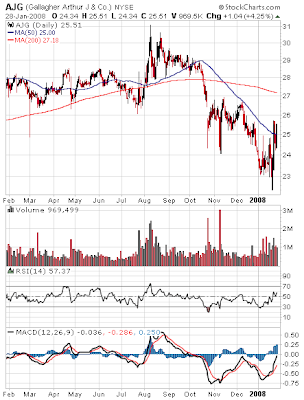
Arthur J. Gallagher stock chart January 28, 2008


Saturday, January 26, 2008

Inventory to Sales Ratio Not Indicating a Recession

One data point economist look at in ascertaining the strength of the economy is the inventory to sales ratio. As noted by a recent report from Argus Research:
"If the I/S ratio rises, it is generally a sign that spending is slowing since inventories (numerator) are rising amid lackluster demand. Higher I/S ratios, therefore, imply economic softness. Businesses (retailers, wholesalers, and manufacturers) don’t want to be caught with deep inventories amid a pullback in spending. The latest available data suggest that the inventories/sales ratio is 1.24, or 1.24 months of available stock give the current pace of sales. And since this measure is approaching an all-time low, and is not exhibiting any recessionary upward trend like it did leading up to the 2001 recession, we believe that a major economic downturn is not in the cards."
(click on graph for larger image)

inventory to sales ratio January 2008
Source:
Market Watch
Argus Research
January 25, 2008


Praxair and Microchip Technology Announce Dividend Increases

Earlier this week, Praxair (PX) and Microchip Technology (MCHP) announced increases in the company's quarterly dividend.

Praxair
  • increased quarterly dividend 25% to 37.5 cents per share versus 30 cents per share in the same quarter last year.
  • the projected payout ratio on 2008 estimated earnings of $4.13 is approximately 36%. The 5-year average payout ratio is 31%.
  • the company carries a S&P Quality Ranking of A.
Microchip Technology
  • increased quarterly dividend 20.8% to 32 cents per share versus 26.5 cents per share in the same quarter last year. The company began paying a dividend in October 2002. The dividend has been increased every quarter since October 2003.
  • the projected payout ratio on 2008 estimated earnings of $1.42 (March 2008 year end) is 90%. The 5-year average payout ratio is 16%. Last year's payout ratio was 35%.
  • the company carries a S&P quality Ranking of B+.
(click on table/chart for larger image)

Praxair and Microchip technology dividend analysis table January 26, 2008
Praxair and Microchip technology stock chart January 26, 2008


Thursday, January 24, 2008

Bearish Sentiment Moves Higher

In today's release of the American Association of Individual Investors' sentiment survey, it is reported bearish sentiment jumped to a level not seen since 1990. The bearishness level rose to 59.02% versus last week's level of 54.44%. The bullishness level moved slightly higher to 25.14% versus last week's 24.30%. The bull/bear spread also widened to a negative -34% versus -30% last week. A graph of the bullishness level is detailed below.

(click on chart for larger image)


Wednesday, January 23, 2008

Market Finds Support?

What a wild day for the markets today. Is it possible this was the capitulation trading day; thus, establishing the point at which the market charts a new trend higher? The Dow Jones Industrial Average was down 300 points this morning then up 300 points in the afternoon. At the close of trading the Dow ended up almost 299 points.

In looking at the broader S&P 500 Index, volume did spike higher in today's trading although the S&P is trading below a longer term uptrend.

(click on chart for larger image)

S&P 500 Trend chart January 23, 2008
In addition to the spike in volume today, the S&P 500 Index successfully retested yesterday's low. From a technical perspective this does provide a support point for the market. That is not to say the market can't trade lower over the near term, but today's trading was a positive from a technical perspective.

(click on chart for larger image)

S&P 500 Index chart of test of low January 23, 2008


Tuesday, January 22, 2008

Core Earnings versus Net Earnings

Over the past nine months or so, numerous companies have announced special charges or write offs for mortgage related items. These charges have the affect of reducing a company's reported net profits.

Following the Enron debacle, which began with the company's bankruptcy filing on December 2, 2001, Standard & Poor's developed the concept of "core earnings." S&P's goal with the core earnings approach is to remove non-core earnings and add back core expenses to reported earnings. According to an article in Better Investing magazine,
"Examples of noncore earnings include capital gains, profits from exchange rate fluctuations and pro forma income on investments of pension plans. Expenses left out by some companies included stock options (which weren’t booked as expenses but served as a form of compensation) and restructuring charges."
For an example of the magnitude of some adjustments, the table below provides an analysis of IBM's (IBM) and DuPont's (DD) results from 2002-2006.

core versus reported earningsSource: Better Investing

As one compares one company versus another, they should factor in the quality of earnings. A company with no adjustments on an regular basis may be a better investment than one with adjustments reported on a frequent basis year after year.

Source:

The Case for Core Earnings
Better Investing
By: Michael C. Thomsett
February 2008
http://www.betterinvesting.org/Public/Tool+Resources/Articles/0208btlpublic.htm?print=1


Monday, January 21, 2008

Dow Jones Industrial Average Circuit Breakers

At the beginning of each calendar quarter the New York Stock Exchange establishes the level at which stock market trading will be halted based on the percentage decline in the Dow Jones Industrial Average. According to the NYSE:
"In response to the market breaks in October 1987 and October 1989 the New York Stock Exchange instituted circuit breakers to reduce volatility and promote investor confidence. By implementing a pause in trading, investors are given time to assimilate incoming information and the ability to make informed choices during periods of high market volatility."
The circuit breaker levels for the first quarter of 2008 are detailed below. Will these breakers be triggered on Tuesday?

(click on chart for larger image)

NYSE circuit breakers first quarter 2008


Capitulation?

One factor missing from the recent decline in the U.S. equity markets was a capitulation trading day. A capitulation trading day is one where the markets decline (even if only intra day) on heavy trading volume.

Today's trading in the Asian an European markets have seen significant declines in market indices across the board. Will this lead to a capitulation trading day in the U.S. markets on Tuesday?

(click on tables for larger image)


Source: Yahoo! Finance (1 21 2008)


Sunday, January 20, 2008

Festival of Stocks #72

Welcome to the January 21, 2008 edition of Festival of Stocks. The Festival of Stocks is a weekly blog carnival featuring recent posts by contributing investment blog authors.


EDITOR'S CHOICE

The Sun, in the Center at Political Calculations
* Commentary *
The price dividend growth rate ratio will set the pace for what investors can expect from the stock market.


Market Response to Recessions at A Dash of Insight
* Economy *
The most important question for investors and traders is how much of the slowing economy is already reflected in forecasts, earnings projections, and stock prices. If the recession really is underway, hasn't the market already reflected reduced earning potential?

COMMENTARY

Patrick Byrne “screws up” Overstock.com and the board of directors rewards him at the Fraud Files blog
The Fraud Files blog reviews a recent press release/8-K filed by Overstock.com. Fraud Files notes Patrick Byrne, OSTK's CEO, admits poor management performance but the Board gives him options anyway.
Stocks: OSTK


Invest In What You Know at Free Stock Market Investing Tips
If you are going to beat the market, you will need to do something better than most investors out there. This is no easy task. Remember, most money is managed by professionals. To beat the market, you need to know something that most professionals don't know about the stocks you trade.


Increase your Return in the Stock Market at TheWildInvestor
Anybody can make money in the stock market, but can you make 40%+ returns? With some simple guidelines, you too can improve your chances of great returns. Time to Bottom Fish at Smart Investing & Money Management
Strategies to find bargains in a bear market.


How I've beat the S&P 500 five years running and why you should (and should not) be impressed at The Dough Roller
Beating the S&P 500 isn't all its cracked up to be.


How To Learn To Make A Good Investment at Personal Development
Describes the most effective method for learning to invest well.


Market Timing - When is the Best Time to Invest New Money at Physician Entrepreneur
When is the best time to invest in the stock market? Data shows that timing the market is less important than having a systematic investment plan and sticking with it.


All Inverse Exchange Traded Funds at StockWeb
If you are not focused on specific companies and you are bearish with some industry or with some world stock market index you can try inverse ETFs.


Getting Tired Of The Stock Market Volatility at My Wealth Builder
I think the market will continue to be volatile and choppy for an extended period, before it finally has a major decline. Waiting for the capitulation trading day.


Investing – Home Run vs Home Ruin, Micro Cap vs Large Cap at Debt Free
10-Bagger stocks are not found in OTC-BB listings; however, micro-cap stocks may yield some surprising winners.


ECONOMY

Baltic Index Down 37% Since Mid November at Bespoke Investment Group
Every once in a while, an economic term or indicator that was previously not widely followed finds its way into the mainstream financial conversation. One indicator du jour is the Baltic Dry Freight Index. Many economists consider the index to be a good leading indicator of economic activity. If not as many people are looking to move cargo, ships will be in less demand, causing a drop in the price that shippers can charge. However, declines in the index do not necessarily mean that a recession is on the horizon.


EDUCATION

Top 10 Pages To Read First In Investors Business Daily at Millionaire Neumes
Investor's Business Daily newspaper is packed with information and can be overwhelming to a new user. Here are the 10 pages I always read.


FINANCIAL ANALYSIS

When Is A Lot of Cash A Bad Thing? at Dividends4Life
Shareholders no longer will tolerate companies building large cash reserves as they have in the past.
Stocks: TSR


NEW WEB BLOGS

Campus Stocks - Social Networking for Student Investors at 5 Percent Stocks
Five Percent Stocks establishes new social networking website for student investors. He he notes in his post, "now has come the time for these universities to battle it out on the stock ticker.


STOCKS

AeroGrow Invents New Industry and Continues Growing at Nabloid: Advice From Beyond
Nabloid discusses a potentially up and coming new product sold by Aerogrow. This company company sells indoor gardens to individuals with Aergrow's gardens using an aeroponics process to supply a nutrient solution and water to the plants in this table table indoor garden product.
Stocks: AERO


Reliance Power: An Indian IPO at Living Off Dividends
Why India's largest IPO brings back memories of Enron.
Stocks: RELFF


TAXES

50 Tools and Resources for Freelancers During Tax Season at Bootstrapper
Estimated payments, deductions, and extra forms is enough to make your head spin. This collection of advice, tools, and resources could ease your stress and get you on the right track for this year’s tax season.


ANALYSIS TOOLS

How to Estimate Earnings Growth with Excel at luminouslogic.com
This post explains how to use an Excel program to evaluating a company's financial statements and forecast future financial results.


Thanks to all who submitted great investing and finance related posts. To submit your blog article to the next edition of the Festival of Stocks you can use the carnival submission form. Past posts and the next hosts can be found on the blog carnival index page. If you are interested in hosting a Festival of Stocks post, visit Value Investing News' host page.


Saturday, January 19, 2008

Market Correction: Closer To The End Than The Beginning?

Anyone invested long equities in the stock market since late last year has undoubtedly experienced a decline in the value of their investment portfolio. A number of factors have contributed to the decline not the least of which is the sub prime mortgage and real estate situation.

From an economic perspective, we have not seen two quarters of negative GDP growth yet. An important data point to watch for will be advance 4th quarter GDP that is reported on January 30. Preliminary 4th quarter GDP will be reported on February 28 and the final GDP will be reported on March 27. The early GDP figures have a tendency to be revised.

(click on chart for larger image)

Whether we are headed for a recession or an economic slowdown, are there sectors within the equity market that are better places to allocate ones portfolio? The chart below details sector and industry group performance during recessions that occurred between 1945-2002. As the chart details, there were only a few industry groups that generated positive returns: tobacco, nondurable household products, food, beverages and railroads (old industry classification).

(click on table for larger image)

sector and industry returns in recessions
Additionally, one must keep in mind the equity market has forecasted economic weakness from time to time. On the other hand, equity market weakness has been wrong more times than not. Standard and Poor's notes in a BusinessWeek article:
Unfortunately for strategists with an intermediate-term time horizon (six to 12 months), while there have been 11 recessions since 1945, there have been 49 pullbacks, 16 corrections, and 10 bear markets. Therefore 64 of these 75 market sell-offs incorrectly anticipated the 11 eventual recessions. What's more, these alignments usually didn't last very long. Pullbacks typically recovered in about two months, while corrections righted themselves in fewer than four months. So it is imperative that we be confident of a recession before we call for defensive posturing.
As S&P notes, there have been 75 market sell offs and only 11 lead to eventual recessions.

(click on table for larger image)

index returns in recessions since 1945
index returns from 2007 market high to January 18, 2008
Keeping in mind it is difficult to forecast or time economic slowdowns or recessions, could the economy be further into this slowdown or correction and nearer the end?

Source:

Are Stocks Signaling a Recession?
BusinessWeek
By: Sam Stovall
November 27, 2007
http://www.businessweek.com/investor/content/nov2007/pi20071127_357004.htm


Thursday, January 17, 2008

Has The Market Reached An Oversold Level?

When looking at some technical factors for the markets, it appears the percentage of stocks above their 50 and 200 day moving average are nearing oversold levels. The oversold levels detailed in the charts below would not be sufficient reason to go all in for the equity markets, but the charts indicate we may be nearing a market bottom, if only for a short term bounce. A number of fundamental economic factors still weigh on the future growth prospects for the economy, one being the issues surrounding real estate.

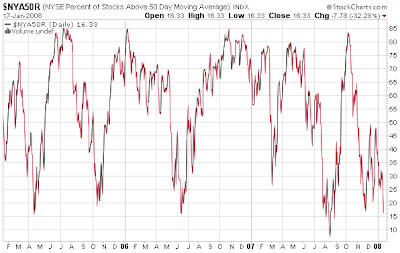
The number of NYSE stocks trading above their 50-day moving average declined to 16%. This is still above the oversold level hit in August 2008.

(click on charts for larger image)

NYSE % stocks above 50 day moving average January 17, 2008
The chart below shows 21% of NYSE stocks are trading above their 200-day moving average.

NYSE % stocks above 200 day moving average January 17, 2008The above chart shows historical data back three years. A longer term view is noted below. The chart and commentary is courtesy of The Big Picture website in the post titled, NYSE % of stocks > than 200 Day Moving Average. The chart shows the 21% of stocks above their 200 day MA is still higher than lows achieved in 2998 and 2002.


NYSE % stocks above 200 day moving average January 17, 2008


Bullish Sentiment Rises: January 17, 2008

The American Association of Individual Investors reported bullish investor sentiment rose to 24.26% versus last week's 19.63%. Although the bullishness level rose, it remains below its long term average of 39%. Additionally, the bull/bear spread narrowed to negative 30% from last week's negative 39%. The 8-period moving average declined to 31.5% versus last week's 31.7%.

(click on chart for larger image)


Tuesday, January 15, 2008

US Bancorp Raises Dividend 6.25%

Who would have thought a 6.25% dividend increase for a bank would be viewed as a positive action. Generally, I like to see double digit dividend growth on a year over year basis, but in this environment, 6.25% seems like a good outcome.

Although US Bancorp (USB) reported lower quarterly earnings of 53 cents per share versus the prior year's result of 62 cents per share, the bank seems to have a good handle on its mortgage related exposures. The bank did announce that 4th quarter results included a $107 million asset write down related to the purchase of some asset backed commercial paper held in money market funds managed by a USB subsidiary.

Analyst estimate 2008 earnings will come in around $2.74 per share versus 2.43 in 2007. The estimated payout ratio on 2008 earnings is approximately 62%. The 5-year average payout ratio is approximately 48%.

(click on table/chart for larger image)

US Bancorp dividend analysis January 15, 2008
US Bancorp stock chart January 15, 2008


Citigroup: We See The Turn Card

If you are a Texas Holdem fan, after two cards are dealt to each player at the table and bets are made, the dealer shows three cards called the flop. After the flop and bets are made, the dealer shows a fourth card referred to as the turn. After bets are made again, the dealer plays the last card called the river.

In today's announcement from Citigroup (C) it seems we may have simply seen the turn card with the river yet to be played. Following is a table from the presentation provided in the company's conference call today. How much of the $37.3 billion, if any, will need to be written off at a future date?

(click on chart for larger image)

Citigroup sub prime exposure January 15, 2008
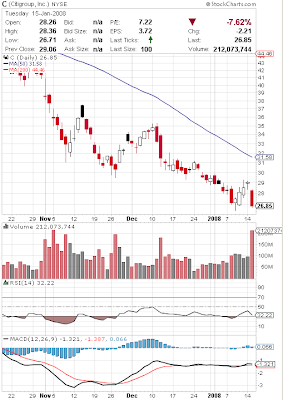
In Citi's conference call, the company reported a loss of $9.83 billion or a loss of $1.99 per share. The loss includes an $18.1 billion pre tax charge for credit costs on sub prime related exposures. Additionally, the company reported it raised a total of $14.5 billion in public and private convertible preferred stock. Lastly, the company cut the quarterly dividend by nearly 41% to 32 cents per share versus 54 cents per share in the same quarter last year. The stock did not react favorably to the news as noted in the stock chart below.

(click on chart for larger image)

Citigroup stock chart January 15, 2008


Sunday, January 13, 2008

S&P Raises Recession Risk

On January 4th Standard & Poor's increased its recession risk forecast to 50% from 40%. S&P believes a recession may not occur from a definitional standpoint (at least 2 consecutive quarters of negative GDP growth), but will feel like one (?). I suppose perception is reality. In any event, S&P believes consumers' spending is tapped out due to higher oil prices and the difficult state of the housing market.

While foreign economies have picked up the slack coming from the U.S., they note:
The danger is that the foreign economies may weaken more than expected. Europe and Japan have both relied on trade surpluses to offset soft domestic demand. Can these regions improve their domestic demand enough to offset the weaker exports to the U.S.?
S&P's recommended sector weightings are noted below.
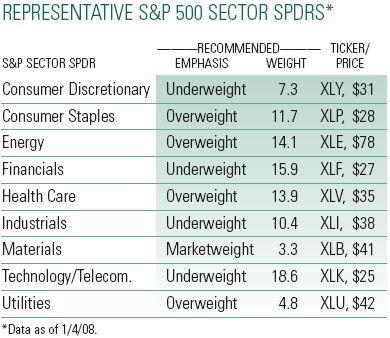
S&P sector weight recommendation January 4, 2008
Source:

Recession Risk Rises
The Outlook Online
Standard & Poor's
January 16, 2008
http://www.outlook.standardandpoors.com/NASApp/NetAdvantage/mkt/OutlookMarketInsight.do?subtype=
OWMO&pc=NET&tracking=NET&context=Company&docId=12613253


Saturday, January 12, 2008

Fundamental Factors In Uncovering Growth Stocks

Eight fundamental factors are highlighted in a Navellier & Associates client newsletter as important in uncovering growth stock winners. A recent American Association of Individual Investors article, Finding Growth Stock Winners: Focus on 8 Fundamental Factors ($), also highlighted these factors utilized by Louis Navellier in his investment discipline. The AAII article is an excerpt from Chapter 1 of Navellier's book The Little Book That Makes You Rich: A Proven Market-Beating Formula for Growth Investing.

The AAII article notes:
These indicators measure the financial health of a company, how well their products are selling, and whether they are able to maintain and even increase a very high level of profitability. A company that scores very high across all eight of these mental model variables is highly likely to have all the characteristics of a potential 10-bagger growth stock.
The eight factors evaluated by Navellier are:
  • Positive Earnings Revisions
  • Positive Earnings Surprises
  • Sales Growth
  • Operating Margin Growth
  • Strong Cash Flow
  • Earnings Growth
  • Earnings Momentum
  • Return on Equity
Why does Navellier use the above eight factors and not simply one magic bullet variable?
"These indicators measure the financial health of a company, how well their products are selling, and whether they are able to maintain and even increase a very high level of profitability. A company that scores very high across all eight of these mental model variables is highly likely to have all the characteristics of a potential 10-bagger growth stock.

I cannot emphasize enough that you need to use all of these variables when seeking market-beating growth stocks to add to your portfolio. Why not just focus on one or two variables that have performed the best over time?

There will be periods of time when the market favors stocks with earnings momentum, and periods where operating cash flow or earnings before interest, taxes, depreciation and amortization (EBITDA) are the darlings of the day. As soon as the dance cards are full and everyone can be found chasing after the same thing, the band will stop and the party will be over.

Instead you should focus on all eight variables. The amount each variable counts may be changed or tweaked over time, but all eight variables need to be considered.

By concentrating on the numbers, and just the numbers, you can take the guesswork out of picking winning stocks."
Source:

Navellier Market Outlook Letter
Navellier & Associates
December 31, 2007
http://www.savefile.com/files/1314535

Finding Growth Stock Winners: Focus on 8 Fundamental Factors ($)

American Association of Individual Investors
By: Louis Navellier
January 2008
http://www.aaii.com/login/index.cfm?CALLER=/includes/DisplayArticle.cfm&denied=jrnl&Article_Id=3329&CFID=6034584&CFTOKEN=84844249


Friday, January 11, 2008

Investing In A Volatile Market

It goes without saying, but the U.S. equity markets have experienced quite a bit of volatility as 2008 gets started. Most of this volatility has been on the downside too with the S&P 500 Index already down nearly 5% this year. An essential investor reaction in this kind of market should be to stick to the long term strategy that one is following. Certainly, if this type of market results in losing sleep at night, an investor should evaluate their overall investment program.

Janus recently discussed this topic in an article in the company's quarterly newsletter. The sub title to the article is "How to be an Unemotional Investor." Keeping ones emotion out of investment decisions generally leads to less volatile investment returns. The article cites three guidelines:
  • Stick with your strategy: Develop a personalized investment strategy and stick with it through market ups and downs. Remember that you invested in stocks to steadily build and preserve wealth over decades, not to try to jump in and out of the market on a whim.
  • Maintain a long-term perspective: What investors fear most is not market volatility, but losing money. Historically, however, investing over longer periods of time has actually reduced the risk of loss. In fact, while the market has suffered 23 losing years since 1926, there has never been a 15-year period when the stock market lost value. This record illustrates the importance of maintaining a long-term perspective, rather than panicking and redeeming your investment during market downturns.
  • Keep your emotions in check: Volatility is far from a recent phenomenon. Over the last 80 years (through December 2006), the S&P 500.® Index has produced annualized gains of 10.3%. That's an impressive display of long-term growth, but it doesn't mean that stocks rise 10% every year. In fact, in only six of the 80 years between 1927 and 2006 has the Index's return been within three percentage points of its long-term performance average (i.e., between 7.3% and 13.3%). So whether the market is in a nosedive or skyrocketing to new heights, let yourself be guided by reason and a sensible investment plan, not your emotions.
Source:
Dealing with Market Volatility
Janus Report
Winter 2007
https://ww4.janus.com/Janus/Retail/StaticPage?jsp=jsp/Common/JanusReportHTML.jsp&assetname=JanusReportDealingMarket


Thursday, January 10, 2008

Bullish Investor Sentiment Near Extreme Low

The American Association of Individual Investors sentiment survey reported low bullish investor sentiment today. The level of bullishness declined to 19.63%. This compares to last week's bullishness sentiment level of 25.71%. This low sentiment level last seen in mid-1995.

(click on graph for larger image)

investor sentiment January 10, 2008


Tuesday, January 08, 2008

Another Down Day On Wall Street

It is an understatement to say the market seems unable to find a bottom. As the chart below shows, the market remains firmly in a downtrend and has broken through the triple bottom support. The next support level is near the March 5, 2007 close of 1,374. Although this was a quick move to the downside, volume of over 4 billion shares suggest this maybe wasn't a capitulation trading day though.

(click on graph for larger image)


S&P 500 technical chart January 8, 2008
S&P 500 stocks trading above their 50-day and 200-day moving averages are approaching oversold levels though.

(click on graph for larger image)

percentage of S&P 500 stocks trading below 50 and 200 day MA January 8, 2008
The market is approaching an oversold level when looking at the percentage of stocks trading below their 50 and 200-day moving averages. Additionally, bullish investor sentiment is at low levels. In the end, the market may be setting itself up for a bounce to the upside as we move into earnings season. As noted in the below chart for Apollo Group (APOL), the company had a positive earnings report after the close today. The stock jumped 7.8% or $5.34 in after hours trading.


Apollo after hours stock quote January 8, 2008


Saturday, January 05, 2008

Links To Strategies For A Volatile Market

The S&P 500 Index has declined -3.84% to start off 2008. Following are links to articles covering investment strategies for volatile markets.


Updated 1/5/2008 @ 8:38 PM EST


Friday, January 04, 2008

Number of Dividend Increases Decreased In 2007

Standard & Poor's reported the number of companies increasing their dividends fell 5.7% in 2007 versus 2006. Of the 7,000 or so firms that report dividend actions to S&P, 1,857 increased the dividend in 2007 versus 1,969 in 2006.
  • "The decline in dividend increases reflects the current trend of favoring stock buybacks at the expense of committing to long-term cash dividends," says Howard Silverblatt, Senior Index Analyst at Standard & Poor’s.
  • Standard & Poor’s data reveals that negative actions - such as dividend decreases and suspensions - picked up in 2007 amidst heightened concern over the current difficulties within the Financials and Consumer Discretionary sectors. Dividend extras - such as one-time dividend payments and special dividends - increased 1.0% (versus 14.3% in 2006) to 628 from 622 during 2006.
  • Howard Silverblatt notes that, while dividend increases within the general market have declined, over 60% of the S&P 500 companies increased their dividend payment in 2007. In addition, Silverblatt estimates that S&P 500 dividend payments will increase 9.3% in 2008.
  • "History shows that S&P 500 issues have a greater likelihood to pay dividends than the general market, 78% versus less than 39% for the general market," adds Silverblatt. "In addition, S&P 500 issues have a much greater propensity to increase their dividend rate than the general market."
Source:

S&P: Dividend Growth Lags in 2007 as Fewer Issues Pay (PDF)
Standard & Poor's
By: David R. Guarino and Howard Silverblatt
January 3, 2008
http://www2.standardandpoors.com/spf/pdf/index/010307_DividendGrowth.pdf


Thursday, January 03, 2008

Pessimistic Investor Sentiment

Individual investors continue to be pessimistic about the market as noted in the Sentiment Survey from the American Association of Individual Investors. In today's sentiment survey release, the bullish sentiment level declined to 25.71% versus last week's 30.0% bullishness level. The bull/bear spread widened to a minus -29.53%. This compares to last week's bull/bear spread of -20%. Additioanlly, the level of bearish reach 55.24%. This is the highest bearishiness level since November 1990.

(click on chart for larger image)


From a sentiment perspective, this contrarian indicator suggests we are near a level where the market could experience a technical bounce. On the other hand, the percentage of S&P 500 stocks trading above their 50-day moving average is not quite at an oversold level as noted in the chart below.

(click on chart for larger image)

percentage of S&P 500 stocks trading above 50-day moving average


Wednesday, January 02, 2008

National City Bank: The Dangers of Chasing Yield

I feel as though I am piling on by writing about National City Bank's (NCC) dividend cut announcement. In any event NCC announced today that the company was reducing the quarterly dividend by nearly 49%. The new quarterly dividend was reduced to 21 cents per share versus 41 cents per share in the prior quarter. On a year over year basis, the dividend was reduced from 39 cents per share in the first quarter of 2007. Prior to the dividend cut, NCC was trading at a yield of 9.96%. After the cut, the stock trades at a yield of 5.39%. In trading today, the stock price fell 5.29%.

It should be noted that National City was featured by Standard & Poor's as one of the 195 companies in the S&P 1500 Index that had increased the dividend annually for the past 10-years.

(click on chart for larger image)

National City Bank stock chart January 2, 2008


Dividend Payers Outperform Non Payers In 2007

The dividend paying stocks in the S&P 500 Index outperformed their non paying counterparts in 2007. The "average" return for the dividend payers equaled .73% versus a negative -.77% for the non payers. The capitalization weighted return for the index, 5.49%, resulted in outperformance versus both the payers and non payers though.


Tuesday, January 01, 2008

Top Financial Bloggers Eligible For Stock Picking Contest

Asif Suria of SINLetter.com is sponsoring a stock picking contest for top financial and business bloggers. Additionally, subscribers to his site can enter the contest as well. The evaluation period for the stock contest is the first quarter of 2008. Additional information can be found on his site where the stock picking entry rules are outlined.

Several of my picks deviate from my traditional dividend growth focused investments since the time period being evaluated is rather short term, i.e., three months. Many times out sized gains in the short run are experienced with stocks that have high betas relative to the market. Additionally, some of my picks, such as First Marblehead (FMD), have significant business risk. In FMD's case, the tight securitization market has negatively impacted their business prospects of late.


(This information and content should not be construed as a recommendation to invest or trade in any type of security. Neither the information, nor any opinion expressed, constitutes a solicitation of the purchase or sale of any security or investment of any kind. All individuals are advised to conduct their own independent research before making any investment decision. It should be assumed I have a financial interest in the position I take on any investment position)


Dogs of the Dow for 2008

In 2007 the Dogs of the Dow strategy fell far short of expectations. For the year, the Dogs returned a negative -1.4% versus the Dow Jones Index return of 6.4%. For 2008, the only change to the Dow Dogs is Merck (MRK) being replaced by Home Depot (HD). Home Depot's yield is 3.34% versus Merck's yield of 2.62%. The calendar year returns for the Dog strategy can be found at the Dogs of the Dow website.

The 2008 dogs are detailed below:

(click on table for larger image)


S&P 500 Index Sector Returns For 2007

Only two sectors within the S&P 500 Index failed to generate a positive return in 2007: Consumer Discretionary and Financials. Although the Energy sector was the best performing out of all S&P sectors, the grain component of the CRB Index out did energy. The CRB Index component detail noted below is provided by Barry Ritholtz at his website The Big Picture.

The cause for the weak financial sector performance is fairly obvious given the mortgage and subprime mortgage issues. With respect to the consumer discretionary sector, is the market foretelling a weak consumer spending environment as 2008 unfolds?

(click on table for larger image)

S&P 500 Index sector returns 2007 and CRB Index component returnSources:

Performance of Commodity Sub-Groups
The Big Picture
By: Barry Ritholtz
December 31, 2007
http://bigpicture.typepad.com/comments/2007/12/performance-of.html

S&P 500 Index Return
Standard & Poor's
December 31, 2007
http://www2.standardandpoors.com/portal/site/sp/en/us/page.topic/indices_500/2,3,2,2,0,0,0,0,0,5,1,0,0,0,8,0.html