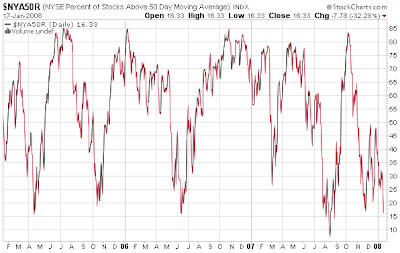
When looking at some technical factors for the markets, it appears the percentage of stocks above their 50 and 200 day moving average are nearing oversold levels. The oversold levels detailed in the charts below would not be sufficient reason to go all in for the equity markets, but the charts indicate we may be nearing a market bottom, if only for a short term bounce. A number of fundamental economic factors still weigh on the future growth prospects for the economy, one being the issues surrounding real estate.
The number of NYSE stocks trading above their 50-day moving average declined to 16%. This is still above the oversold level hit in August 2008.
The number of NYSE stocks trading above their 50-day moving average declined to 16%. This is still above the oversold level hit in August 2008.
(click on charts for larger image)

The chart below shows 21% of NYSE stocks are trading above their 200-day moving average.
 The above chart shows historical data back three years. A longer term view is noted below. The chart and commentary is courtesy of The Big Picture website in the post titled, NYSE % of stocks > than 200 Day Moving Average. The chart shows the 21% of stocks above their 200 day MA is still higher than lows achieved in 2998 and 2002.

No comments :
Post a Comment