Thursday, April 08, 2010

TJX Cos. Increases Dividend 25%

Earlier this week TJX Cos., Inc (TJX) announced a 25% increase in the company's second quarter dividend. The new quarterly dividend will be 15 cents per share versus 12 cents per share in the same period last year. The dividend payout ratio is projected to equal 19% based on estimated January 2011 earnings of $3.18. The projected payout compares to the 5-year average payout ratio of 16%. TJX carries an S&P Earnings & Dividend Quality Ranking of A+.


Bullish Investor Sentiment Essentially Unchanged

This week's sentiment survey reported by the American Association of Individual Investors saw a small uptick in bullish investor sentiment. The bullishness reading came in at 42.86% versus 41.30% last week. The 8-period moving average has moved higher for the third straight week., increasing to 38% versus 37.2% last week. The AAII survey represents the percentage of individual investors who are bullish, bearish, and neutral on the stock market for the next six months; individuals are polled from the ranks of the AAII membership on a weekly basis.


The Key Is Cash Flow

A recent article appeared in Forbes magazine that focused on the importance of cash flow versus earnings per share. The article, Investing Via Cash Flow, highlighted the success of Martin Saas, chairman of MD Saas. In the Forbes article, Saas notes, "investors get too fixated on the reported earnings...I am religious about cash flow. To me it's the most important number." Saas believes investors should start their review of the financial statement with the "cash flow from operations" statement.
This essentially consists of net income with noncash charges (like depreciation and deferred taxes) added back and cash-draining events (like an inventory pile-up) taken out. Now subtract maintenance-level capital expenditures. The company will tell you its total cap-ex; divining how that divides between maintenance and expansion is a tricky business, but you can strip out discretionary expenditures such as when oil companies increase drilling activity. What you're left with is free cash flow.
Source:

Investing Via Cash Flow
Forbes Magazine
By: Daniel Fisher
March 25, 2010
http://www.forbes.com/forbes/2010/0412/investing-cash-flow-sass-equities-ebitda-cash-does-not-lie.html


Sunday, April 04, 2010

The Impact Of Higher Taxes On Stock Prices

In an effort to look past the health care rhetoric, one aspect of the legislation that we know is coming is higher tax rates. In addition to the higher taxes that are a apart of the new legislation, the Bush tax cuts will expire after 2010 as well. So what does history say about higher taxes and stock prices.

It has been 23 years since capital gains tax rates were increased. The last increase occurred when Ronald Reagan was president. A big part of what Reagan did with taxes was lower the highest marginal tax rate on income from 50% to 28%. However, Reagan did increase the tax rate on capital gains from 20% to 28% beginning in January 1987. What occurred in 1986 was the unleashing of the corporate raider. A recent article in Financial Advisor magazine noted:
It was the age of the corporate raider and folks like T. Boone Pickens. Carl Icahn and Ronald Perelman were making the CEOs of America's biggest companies quake in their stretch limos. With a huge assist from Drexel Burnham Lambert's junk bond department in Beverly Hills, these characters were putting companies into play on a weekly basis. The rest of Wall Street was frantically scrambling to clone Drexel's incredible profit machine and struggling to create their junk bond units to finance LBOs....

When the 1986 tax act became law, these raiders sensed opportunity and took off on a bender that would last for more than two years. Shareholder value was their mantra. Almost every day, they would tee up companies and demand that their boards work over time to quickly complete the deal to give shareholders the full advantage of the soon-to-expire 20% capital gains tax rate. In actuality, most raiders were hoping that a bigger corporation, or so-called white knight, would swoop in and trump their offers.

Did the expiration of the 20% capital gains tax rate in January 1987 hurt stock prices? Hardly. From January to September, equities went crazy. Propelled perhaps by the big cut in income tax rates, the Dow climbed from 1,897 to over 2,700 on August 25 in a frenzy that looked like a runaway train going down Mt. Everest.
The fall out from this junk bond era is well know, but it is worth noting that stocks performed well during this time period. For bond holders, they should have some knowledge of history.
Fed chairman Paul Volcker discerned the all-too-obvious symptoms of an overheating economy and decided he'd had enough of all this nonsense. In April, he jacked up interest rates dramatically, triggering a $100 billion bath for bondholders around the globe.
One aspect that is different this time is income taxes will be on the rise. David Kelly, chief market strategist for J.P. Morgan Funds notes:
  • starting in 2013, the Medicare tax rate on households with income over $250,000 will be increased from 1.45% to 2.35%.
  • a new 3.8% Medicare tax will be introduced for this same group on investment income.
  • the tax rate on dividends and long-term capital gains will increase from 15% to 20% for households earning over $250,000 and with the new Medicare tax, these rates will rise to 23.8% for the same group.
  • Under current tax law, investors get to keep 85% of the income stream from taxable stock market investments. Under this new law this will be cut by 8.8% to 76.2%, reducing the value of the income stream by 10.4% (that is 8.8% of 85%).
  • using a number of broad assumptions, the value of the average stock should be reduced by one quarter of 10.4% or 2.6%—not good obviously, but also not an overwhelming reason to avoid stocks after a 12 month period in which they rose by over 70% and still appear undervalued.
Certainly, an investor's income stream will be impacted by the higher tax rates. The question becomes what are the alternatives to stocks and dividend paying stocks for that matter? If the Fed is preparing to raise interest rates (maybe not until later this year), what will be the impact on bonds? Additionally, with the precarious budget situation with a number of municipalities, tax free bonds may not be the safe haven expected by many investors. In short, don't let the tax tail wag the dog. Some perspective on history is contained in the article, Animal Spirits: The Last Time Capital Gains Taxes Rose.

Source:

Animal Spirits: The Last Time Capital Gains Taxes Rose
Financial Advisor Magazine
By: Evan Simonoff
March 25, 2010
http://www.fa-mag.com/blog/evan-simonoff/5357-animal-spirits-the-last-time-capital-gains-taxes-rose.html

Investment Implications of Health Care Reform
Financial Advisor Magazine
By: David Kelly, chief market strategist for J.P. Morgan Funds
March 22, 2010
http://www.fa-mag.com/online-extras/5344-investment-implications-of-health-care-reform.html


Dividends And Buybacks On The Increase

It is projected that dividends and stock buyback activity will increase in the second quarter of 2010 versus 2Q 2009. According to Howard Silverblatt, Senior Index Analyst at Standard & Poor's:

[expectations are that] second quarter 2010 dividend payments will be higher than second quarter 2009, but still 17% off 2Q 2008. A surge in increases is expected late in the third quarter if companies feel secure in their prospects to commit to future payments. 2010 payments are estimated to be up 5.6% to US$206B. This compares to payments of US$196B in 2009, US$248B in 2008, US$247B in 2007, and US$ 225B in 2006.

With respect to buybacks, Howard Silverblatt notes:
[buybacks are estimated to show] a 37% increase in fourth quarter 2009 over the third quarter 2009, which is 1% less than the fourth quarter of 2008 and 66% less than 4Q 2007. Looking at issues, MSFT (US$ 3.87B versus US$ 1.54B for Q3 2009), KO (US$ 1.51B versus minor) and PG (US$ 1.46B versus US$ 0.01B) returned, with HPQ increasing (US$ 2.7B versus US$ 2.1B), as CSCO (US$ 1.37B versus US$ 1.87B) and DTV (US$ 0.08B versus US$ 0.94B) reduced.

Overall, dollar purchases are ahead by over 39%, but are up 30% void of top issues. Lots of buyback announcements have occurred, but they come down to authorizations and a willingness to get back in the market – actual buys will depend on market conditions. Given that companies are still covering options to prevent dilution...

Source: Standard & Poor's


Friday, April 02, 2010

For Dividend Investors, It Is All About The Cash

As important as the stock yield percentage might be for investors, looking at dividend growth investments is more than simply looking at the yield on a particular stock. Certainly, history shows that a large part of the market's total return is attributable to the dividend return. Since 1926 the dividend component of the S&P 500 has accounted for one-third of the index's total return. An important aspect of focusing on dividends is it provides an investor insight into a company's cash flow.

One of the most important financial statements an investor can review when evaluating a company is the cash flow statement. A recent article reacquaints investors with the importance of this statement. One thing a company can't manipulate is cash. Cash is cash and cash is king as they often say.

As the article, Show Me the Money: Tracing a Firm's Cash Flow, shows, the cash flow statement provides investors with a wealth of information. Under the "financing section" of the statement, investors should pay particular attention to the activity surrounding the stock account. Many companies are once again announcing stock buybacks, but are the buybacks actually reducing the shares that are outstanding? Maybe the buybacks are simply offsetting potential dilution from option exercises.

The Show Me The Money article is timely for investors as many companies are once again focusing on dividends and buybacks as company fortunes seem to have stabilized.


Thursday, April 01, 2010

Dividend Payers Outperform Non Payers In First Quarter Of 2010

During the first quarter of 2010, the dividend payers in the S&P 500 Index outperformed the non dividend paying issues. The outperformance was small with the payers average return equaling 8.37% versus 8.35% for the non payers. In the month of March, no S&P 500 company reduced or suspended its dividend. This compares to March 2009 when 12 companies reduced their dividends.

What is interesting to note about the quarterly performance results is the dividend payers only outperforming month was January when the the payers were down 2.5% and the non payers were down 4.8%. Losing less money in down markets is one key to achieving longer term performance goals. Dividend payers are one way to take advantage of this performance advantage.


Uptick In Bullish Investor Sentiment

This week's individual investor sentiment as reported by the American Association of Individual Investors saw an uptick in bullish sentiment. The bullish sentiment reading increased 8.9 percentage points to 41.3%. This is slightly above the long term average of 39%. Additionally, the less volatile 8-period moving average of the bullish sentiment reading increased to 37.2% versus last week's average of 35.7%. This is the first increase in the 8-period average since January 14th.


Sunday, March 28, 2010

Misconception Surrounding The Importance Of The Asset Allocation Decision

Many investment advisers will indicate that one of the most important variables an investor needs to determine is their asset allocation. The reason behind this has to do with a study completed over 20 years ago by Brinson, Hood and Beebower that indicated that 93.6% of an investor's return is attributable to asset allocation. I wrote a post on this study a few years ago titled, Asset Allocation: Pros and Cons.

In a study reported in the March/April 2010 Financial Analyst Journal titled, The Equal Importance of Asset Allocation and Active Management and written by James Xiong, CFA, Roger Ibbotson, Thomas Idzorek, CFA and Peng Chen, CFA, it is shown that asset allocation is not nearly as important as many believe. In another article in the March/April 2010 FAJ, The Importance of Asset Allocation (PDF), Roger Ibbotson provides a summary of the aforementioned study.

In the summary several important conclusions are noted:
  • many investors mistakenly believe that the BHB (1986) result (that asset allocation policy explains more than 90 percent of performance) applies to the return level (the 100 percent answer). BHB, however, wrote only about the variation of returns, so they likely never encouraged this misrepresentation.
  • In general (after controlling for interaction effects), about three-quarters of a typical fund’s variation in time-series returns comes from general market movement, with the remaining portion split roughly evenly between the specific asset allocation and active management.
  • Do the BHB (1986) time series have any meaning at all in explaining the incremental importance of a specific asset allocation policy? Not necessarily. Perhaps the simplest illustration was given by Mark Kritzman (2006) in a letter to the editor of this journal titled “‘Determinants of Portfolio Performance—20 Years Later’: A Comment.” Kritzman constructed an example in which stock and bond returns moved up and down perfectly together (i.e., were equal to each other each year) while underlying securities did not. The BHB methodology incorrectly ascribed all 100 percent of the return variation to asset allocation, whereas, in fact, all the variation came from stock selection and general market movement.
  • The time has come for folklore to be replaced with reality. Asset allocation is very important, but nowhere near 90 percent of the variation in returns is caused by the specific asset allocation mix. Instead, most time-series variation comes from general market movement, and Xiong, Ibbotson, Idzorek, and Chen (2010) showed that active management has about the same impact on performance as a fund’s specific asset allocation policy (emphasis added).
Investors are encouraged to read the Ibbotson summary to get a clearer perspective on asset allocation decisions.


Thursday, March 25, 2010

Bullish Investor Sentiment Continues To Deteriorate

The market continues to advance in spite of continued weakness in the bullish investor sentiment reading from the American Association of Individual Investors. The weekly readings can be somewhat volatile, but looking at the 8-period moving average can smooth out this volatility. The 8-period M.A. of the bullishness reading has declined for ten straight weeks going back to January 14, 2010. Since this is a contrarian indicator, it will be interesting to see how this plays out over the course of the next quarter.


Data Source: AAII.com


Friday, March 19, 2010

Dow Rally Below Average In Duration & Magnitude

The Chart of the Day has an interesting chart this week that shows the current Dow Jones Industrial Average rally compared to past rallies back to 1900. It may come as a surprise to many investors, but this rally is below average in duration and below average in magnitude of the advance. The Chart of the Day notes:
  • each dot on the chart represents a major stock market rally as measured by the Dow
  • as the chart illustrates, the Dow has begun a major rally 27 times over the past 110 years which equates to an average of one rally every four years.
  • most major rallies (73%) resulted in a gain of between 30% and 150% and lasted between 200 and 800 trading days -- highlighted in the below chart with a light blue shaded box.


Air Products Increases Dividend 9%

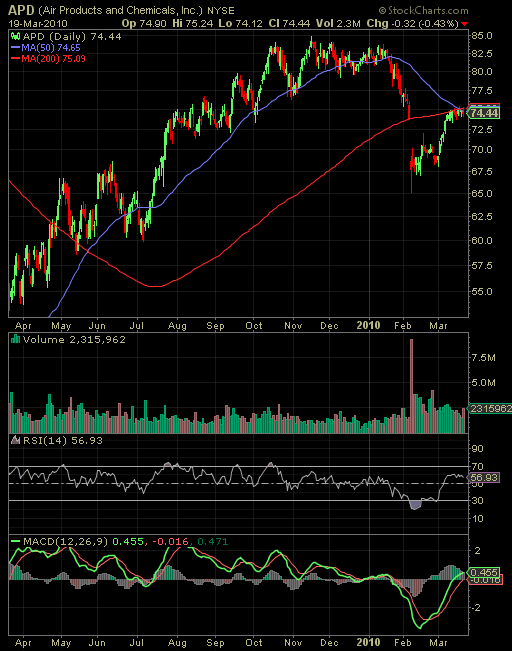
On Thursday Air Products & Chemicals (APD) announced a nearly 9% increase in the company's second quarter dividend. The new quarterly dividend increases to 49 cents per share versus 45 cents per share in the same quarter last year. The payout ratio is estimated at 40% based on September 2010 EPS estimates of $4.92. The 5-year average payout ratio is approximately 42%. The company carries an S&P Earnings & Dividend Quality Ranking of A and the company is one of S&P's Dividend Aristocrats.

As is always the case, investors need to perform their own due diligence before investing in any of the companies mentioned on this site. As it relates to APD, the company has a hostile takeover bid on the table for Airgas (ARG).


Disclosure: long interest in APD


Bullish Sentiment Continues Decline And Market Moves Higher

The individual investor bullish sentiment reading for the week ending 3/17/2010 fell 9.9 percentage points to 35.37%. This level is below the average of the bullishness reading of 39.3%. Since January 13th, the less volatile 8-period moving average of the bullishness reading has declined from 42.9% to this week's reading of 36%. As investors have become less bullish, the market continues to trend higher.


Tuesday, March 16, 2010

Six Notable Dividend Increases So Far In March

Following are six companies in the S&P 500 Index that have increased their dividends so far in March.


Source: Standard & Poor's

Long Interest: GD, PEP, QCOM, WMT


Sunday, March 14, 2010

Fairholme Fund's Bruce Berkowitz Interview

On Consuelo Mack's WealthTrack series, she interviewed Morningstar’s Domestic Equity Fund Manager of the Decade Bruce Berkowitz, founder and lead portfolio manager of the five-star Fairholme Fund (FAIRX). Her interview took place late last year but his advice for investors is invaluable. Berkowitz will explain how he has beaten the S&P by more than 200 percent over the past decade and where he is finding value now.


Better Investing's Most Active Stocks

From time to time I review Better Investing's most active stocks as reported by its members. According to members' recent buy and sell decisions, as reported by a small, informal sampling -- 107 transactions -- for the trailing 4-week period ended March 14, 2010, following are the most active stocks.

Better Investing's most active period ending March 14, 2010Companies Profiles:
  • Petmed Express (PETS)
  • Ford (F)
  • Walgreen (WAG)
  • Stryker (SYK)
  • Life Partners Holdings (LPHI)
  • Jacobs Engineering (JEC)
  • Bank of America (BAC)
  • Oracle (ORCL)
  • General Electric (GE)
  • Berkshire Hathaway (BRK.A)

Long interest: WAG, SYK, BAC, GE and BRK.A & B.


Thursday, March 11, 2010

Bullish Investor Sentiment Rises, But...

Although bullish investor sentiment spiked higher this week, the 8-period moving average continued to decline. The American Association of Individual Investors reported that bullish investor sentiment increased to 45.29% versus the prior week's reading of 35.86%. The bullish sentiment level plus one standard deviation is about 50%. The 8-period moving average of the bullishness reading actually declined to 36.6% versus the prior week's average of 36.9%. This is the ninth straight week the bullish 8-period average has declined.


Monday, March 08, 2010

Market In Denial Phase Of Sentiment Cycle

A reader posted a comment/question on my article about February's performance of dividend payers versus non payers curious if the market sentiment is one where investors are in the denial phase of the sentiment cycle. Several articles today made reference to the fact investors are leery of the market at this stage, in part due to the strong advance off of the March 2009 lows.
Below is a 2-year chart of the S&P 500 Index (SPX) with notations that coincide with a chart that was first publish in 1991 by technical analyst Justin Mamis in a book titled The Nature of Risk. The chart depicts investor sentiment at various stages in the market's cycle.


The market will hit resistance at around the 1,150 level on the S&P 500 Index. Additionally, the recent advance has been occurring on lower volume that may be a sign of investors in disbelief regarding further advance at this point in the cycle.


In short, I believe investors appear anything but confident or enthusiastic at this juncture. Even fund flow data shows investors are placing more money into bond funds than into equity funds.


Monday, March 01, 2010

Dividend Payers' Return Lags Non Payers In February

The average performance of dividend paying stocks in the S&P 500 Index ($INX) underperformed the non payers in February, 4.15% versus 4.74%, respectively. On a year to date basis, however, the payers are outperforming the non payers, 1.57% versus -.24%.

dividend payers versus non payers performance February 2010With respect to dividend actions, February was a much improved environment compared to February of 2009. February tends to be the busiest month for dividend news and the S&P 500 index companies saw 45 increases versus just 30 in the same period last year. Additionally, there were no dividend decreases in February versus 18 decreases in February 2009. For the three month period ending in February, there were 79 positive announcements and just two reductions versus 58 positive announcements and 41 reductions for the same period in 2009.


Source: Standard & Poor's


The Market Is Like A Puzzle

As one puts together a puzzle certain pieces will fit and others won't depending how far along one is in completing the puzzle. Investments aren't much different. Certain types of investments will fit into ones portfolio based on where the economy is in the economic cycle.

I read an interesting post today by Tadas Viskanta, the author of the site Abnormal Returns. His post titled, Play the Ball where it Lies, offers an interesting perspective for investors as they evaluate buy and hold decisions. One premise in the article notes that the markets are rarely "normal" so an investor needs to know why they are making specific investment decisions. At the end of the day, an investor should know why they own what they own. The brief article is a worthwhile read.