Wednesday, November 16, 2016

Powerful Sector Rotation May Need A Breather

The market action following last week's election has seen powerful rotation among stock market sectors and industries. In my last post I highlighted this movement along with stocks and industries that are benefiting from this rotation and industries that are not benefiting. I noted a potential caution due to the fact the targeted sectors seems to be a consensus trade by investors and the moves may be occurring too quickly. One area benefiting from the rotation is the financial sector at the expense of the technology sector as seen in the below chart.


Sunday, November 13, 2016

Investors Adjusting Investments As A Result Of The Election Outcome

This post is more of a chartfest to feature information I ran across over the weekend from various sources but related to investment topics relevant to potential policy changes under a President-Elect Trump administration. Investors know the equity market reacted favorably to the election outcome last week; however, some market segments did far better than others. Although the night is long, the futures market tonight is indicating a positive open for Monday. The Dow and S&P futures are higher by about .40% to .50% (this is 95 points on the Dow.)


Thursday, November 10, 2016

Toss Aside Your Political Leanings, The Equity Market Is

Tossing aside ones political leanings, the stock and bond market are telegraphing positive results from a Trump presidency as it relates to the economy. I briefly touched on the bond market in yesterday's post and below is another chart of the 10-year Treasury yield-the yield continues to move higher.


Wednesday, November 09, 2016

The Market The Day After The Election: Emotion Versus Fundamentals

In Monday's post I highlighted the importance of separating ones politics from their portfolio. The market's reaction to yesterday's election outcome is a perfect example why this is important. As election results trickled in last night and it became apparent Donald Trump would be the 45th President of the United States, equity futures sold off sharply. The day after election sell offs are not unique. The market sold off 2.4% after the 2012 election and sold off 5.3% after the 2008 election.

The Dow futures were down over 860 points at one point early this morning. In spite of this initial negative reaction, today the Dow Jones Industrial Average closed up 256 points at 18,589 after reaching an intraday all time high of 18,650. At the end of the day, stocks will trade on fundamentals and whether or not one is a Trump supporter, his policy proposals could be very bullish for the economy and stocks. Today's market action is a reflection of this potential positive. Additionally, stock prices follow earnings and it looks highly likely third quarter S&P 500 earnings growth will be positive for the first time since Q1 2015. Q3 2016 earnings growth is tracking to be up 3.9% and 7.5% ex-energy.

The bond market sold off rather sharply in a potential sign investors anticipate a faster pace of economic growth. The 10-year Treasury yield closed at 2.07% and is the highest yield since reaching 2.1% in January of this year.


The market will certainly not move higher in a straight line. Also, the Fed rate decision in December may also create some equity market volatility. However, the election outcome in and of itself may not be bad for the economy and thus could be good for stocks. Separating emotion from fundamentals remains an important characteristic for investors.


Monday, November 07, 2016

Election Day Is Finally Upon Us

In one day the S&P 500 Index recovered six of the nine days of losses incurred over the last two weeks. Today the S&P 500 Index recovered 46.34 points or 2.22% versus the 66.15 point loss (-3.07%) incurred from 10/25 through 11/4. Today's rally did not occur on exceptionally high volume, but the stochastic indicator has turned positive.


Charles Kirk of The Kirk Report made a couple of observations in his strategy note over the weekend.
  • Separate your politics from your portfolio as the combination of the two frequently proves unproductive and unprofitable.
  • If the market continues to decline after the election, it would do something we haven't seen in some time – namely that those selling into weakness have made the correct decision to do so. This market has consistently punished selling into weakness like we've seen of late so, if the market punishes those who haven't hedged, raised cash, and position more defensively, it would be the first sign that a top has been made for the market.
  • Kirk states, "My personal view is that the market will rally significantly no matter who wins the election. The way I think it will continue to go consistently down is in a contested type situation (like a Gore/Bush) which would continue this period of tremendous angst and uncertainty for markets worldwide. I could be wrong as I am often about such matters, but that’s my two cents worth"
Tomorrow is the election and recent market activity is suggesting continued volatility. LPL Research publish a post, What Happens Historically After Elections?, that is a worthwhile read for investors as election day is finally upon us.


Friday, November 04, 2016

Defensive Market Sectors Not So Defensive During Equity Market Pullback

With today's market close the S&P 500 Index has been down for nine consecutive trading days. The index is down 4.2% from the August 15 high, but remains up 4.1% year to date. However, during the pullback from the August high, most of the traditionally defensive sectors have been the worst performing ones. As can been seen in the below bar chart, REITs are down 11.1%, health care is down 10.9%, telecoms down 10.8% and consumer staples are down 5.5%.


Thursday, November 03, 2016

Investors Positioning For The Worst In U.S. Election Outcome


In five days the U.S. election will be behind us, absent a contested outcome. Through yesterday's close, the S&P 500 Index has been down seven consecutive days putting the Index down 4.2% from its August 15 close. This weakness in the markets is now showing up in technical indicators like the CBOE Equity Put/Call ratio. At the close Wednesday, the equity put/call ratio was reported at .99 which is an indication of extreme equity market bearishness from which rallies tend to occur.


Other technical market indicators are also indicating a market that is oversold or at least near oversold. As can be seen in the below market chart, the stochastic and money flow indicators are at levels that have coincided with an oversold market.


And lastly, the percentage of S&P 500 stocks trading above their 50 day moving average stands at 27%.

In summary, investors seem to be positioned for a market that reacts negatively to the election outcome. As the second chart above shows, the market's reaction to the BREXIT vote was certainly negative; however, the sharp decline was fully recovered within a week of the BREXIT results. And from a fundamental perspective, the earnings recession seems to be coming to an end with third quarter earnings now tracking to be up 2.9% with 76% of S&P 500 companies already having reported results. With company fundamentals/earnings turning more favorable and equity shocks like investors are anticipating with the election outcome, the current pullback is more likely to be only temporary as we noted in our BREXIT commentary in June.


Saturday, October 29, 2016

Bonds And Bond-Like Equities Adjusting To Higher Interest Rate Environment

The Federal Reserve meets during the first week of November to decide whether or not to increase interest rates. The probability of a rate hike in November stands at only 8.8% while increasing to 63.3% at the December meeting. With the elevated likelihood of an interest rate hike before year end, income focused investments, both fixed income and bond like equities, are adjusting to this potential outcome.


As can be seen in the above chart, over the last three months, the yield on the 10-year Treasury has increased over 30 basis points while a few selected income focused ETFs are down five percent or more, with REITs (IYR) down 10%.

The same return outcome is occurring with some fixed income investments. As the below chart also shows, bond investments are adjusting to a potentially higher interest rate environment as well. Longer term bonds, as represented by the iShares 20+ Year Treasury ETF (TLT), have fared worse than bonds of a shorter maturity and is down over 7%.


A Fed rate increase before year end is not a certainty; however, with market rates adjusting to a higher level, bond like equities and longer term bonds remain under pressure.


Thursday, October 27, 2016

U.S. Government Has A Spending Problem

As of the end of the second quarter the U.S. government's budget deficit is once again widening and stands at $664 billion compared to $543 billion at the end of 2015. As can be seen in the below chart, government outlays as a percentage of GDP equals 22.4% and above the long run average of 20.3%. Additionally, government revenue as a percentage of GDP equals 18.8% versus the long run average of 17.7%. The gap is real but the percentages are elevated due to the continued weak growth of the economy in this recent expansion and hence the below trend GDP level.

In absolute dollar terms, the deficit has widened in spite of record tax receipts/revenue collected by the government. The below chart shows revenue is up 30% since just before the the start of the last recession. Government receipts have increased from $2.669 trillion to $3.472 trillion. At the same time, government expenses have increased at a far faster pace, up 39% over the same time period to $4.137 trillion from $2.979 trillion.


A significant issue with government expenditures is the high level of non-discretionary items. Additionally, net interest expense stands at $248 billion, 6% of the budget. If the recent move in interest rates is any indication of future interest expense on the government's debt, the budget deficit will likely continue to widen without implementation of policies that are pro-economic growth. Since July 6, the yield on the 10-year Treasury has increased 53 basis points from 1.32% to 1.85%. As new debt is issued to fund the deficit, these higher interest rates will be problematic for the government's budget.


Aside from interest on the government debt, explosive growth in entitlement spending will need to be addressed in order to bring discipline to the government's budget as well. Rhetoric that the middle class will not be impacted by tax hikes is just that, rhetoric. It was recently announced that wages subject to the social security tax will increase from $118,500 this year to $127,200 in 2017, a 7.3% increase and thus directly impacting the middle class tax payer. There are no easy solutions to addressing the government's budget deficit, but addressing this sooner versus later can ease any potential pain.


Monday, October 17, 2016

Fall 2016 Investor Letter: Time In The Market

In our recent published Fall 2016 Investor Letter, our commentary covers recent market related events, U.S. earnings, interest rates and the pending election. Emotions tend to run high during these times creating an environment that can drive investors to reduce their stock market exposure. The newsletter discusses the consequences these decisions can have on long-term returns. 

In our Summer 2016 Investor Letter, we highlighted our positive view on U.S. equities, supported by an anticipated resumption in earnings growth for the second half of 2016 and into 2017. Although analysts expect companies in the S&P 500 Index to report a slight drop in quarterly earnings for the third quarter, we believe reported earnings will turn positive in the quarter and discuss this in the Investor Letter.


For additional insight into our views for the market and economy, see our Investor Letter accessible at the below link.


Sunday, October 16, 2016

Slow Economic Growth Has Led To Weak Job Growth

One factor that has turned into 'normal' for this economic recovery is its slow rate of growth. Out of the eleven recoveries since 1949, the current one is the slowest, barely averaging above 2%.


Wednesday, October 12, 2016

Positive Equity Markets In The Year After The Presidential Election

Absent an election year, equity markets generally trend higher until the seasonally weak September/October months. However, during an election year, equity market weakness tends to occur during the summer months and subside as the November election draws near. Historically, markets then rally into year-end. The market has followed this pattern so far this election year. As the below chart shows, when reviewing each November election dating back to 1988, the S&P 500 Index’s performance for the following 1-year is positive 7 out of 8 times. The only negative period was during the bursting of the tech bubble in 2001.


This election year certainly seems to be a very polarizing one. The newly elected President will need to tackle many policy issues: foreign policy, foreign trade, U.S. deficits, student loans, health care, global terrorism and defense, immigration, individual and corporate tax reform, just to name a few issues. We would, however, reiterate what we wrote in our Spring 2016 Investor Letter. We believe a President can exert significant influence over a specific industry (the Obama presidency and the impact on health care and coal), but, he/she has limited influence on the overall direction of the broader market. So as election day draws closer, the uncertainty of the outcome will clear; thus, potentially, paving the way for higher equity prices into next year.


Sunday, October 09, 2016

Investors Rotating Out Of Income Generating Equities

Since mid August the S&P 500 Index was down approximately 3% to mid September, but has recovered about 1.3% to Friday's close. The market seems to be having difficulty finding direction, trading mostly sideways since mid July, as can be seen in the below chart that includes the transport index as well.


As I noted in a post in early September, transports began outperforming the S&P 500 Index at that time after trailing the broader market for most of the second quarter. When the transports begin to lag the broader market there is some belief this is potentially a precursor to a weakening economy that leads to a decline in the S&P 500 Index. As the above chart shows though, transports appear to be in decent shape, potentially pulling the S&P 500 up with it on improving economic fundamentals.

A part of what seems to be occurring in the broader market is a rotation out of the income and defensive sectors. In looking at sector returns since the beginning of the year (blue bars) and returns since the end of June (yellow bars), the weakest part of the market since the end of the second quarter has been health care, staples, REITs and utilities. The top performing sectors since June are the more economically sensitive ones, technology, financials, energy and industrials. I have discussed in earlier posts about the likelihood of the coming end of the earnings recession in Q3. Aggregate 'as reported earnings' for the S&P have already increased for three consecutive quarters.


This rotation out of the defensive/income sectors is also showing up in the downtrend in the advance decline lines for the defensive/income sectors.


A part of the flow out of dividend yielding stocks is the anticipation of a Fed rate hike before year-end. The 10-year Treasury yield has already moved higher from a yield of 1.32% in July to 1.73% at Friday's close. Higher interest rates tend to result in the price of dividend yielding stocks, bond like equities as some call them in this low rate environment, to fall. This has been the case with the bottom performing income oriented sectors. The price decline has been relatively quick as can be seen in the below chart of the utility sector.


In conclusion, the S&P 500 Index remains just 1.7% off its August high in spite of quite a bit of pessimism. The AAII bullish sentiment remains at a low level, 28.79%, and fund flows continue to exit equities with funds suffering their worst weekly out flows of the year, yet the market remains near a high. From a technical perspective, Charles Kirk of The Kirk Report always cuts through the noise to provide good technical detail on the markets and stocks. In his report this week he provided the below chart noting:
"Overall, the probabilities still favor a bullish breakout to higher highs. Why is that? The combination of both the short and long-term bullish plays that remain in motion. The longer-term double bottom breakout play targeting S&P 2365 remains in play. While price has seemingly stalled out over the past seven weeks, there has not been any significant roll back either other than the -3% throwback retest last month that successfully tested and held support. All that is needed now is to take out the August highs and start acquiring the numerous bullish target objectives."

All else being equal, I believe the earnings recession should end this quarter (energy is a wild card and key) and the sideways market action is partly due to sector rotation. As more certainty is established about the election outcome and the Fed rate decision, equities could see a move higher into year end.


Saturday, October 08, 2016

Why We Sold Tyson Foods In September

At the end of September our research led us to sell Tyson Foods (TSN) common stock in our client accounts. Our firm relies heavily on fundamental research in our stock research in order to uncover buy and sell opportunities for our clients' portfolios. What led us to our sell decision was not the direct reason TSN was down nearly 9% on Friday, but an indirect one.

As background, our firm added TSN to client accounts in May of 2015 following the stock's decline as a result of bird flu showing up in poultry in Arkansas where Tyson has poultry operations. In short, we felt the bird flu issue was a temporary one and that TSN would recover from this issue. Additionally, we expected TSN to benefit from its acquisition of Hillshire Foods that had closed in August 2014. The acquisition benefits materialized, the bird flu situation passed, and TSN's stock price recovered nicely. After our initial decision to purchase TSN on May 14, 2015 at $41.76, we trimmed the holding on May 19, 2016 at $64.88, a 55% gain after one year. One of our risk control disciplines takes into account position size and this was one of the reasons for trimming the holding in May. We sold the remaining TSN position on September 30 at a price of $74.52 and the sell was made for fundamental reasons.

Tyson's stock is not necessarily trading at an extended valuation, 18 times earnings at the time of our sell, when compared to the overall market. Additionally, the earnings growth rate for Tyson in the later part of 2015 and through September of 2016 has been strong. As the below snapshot of earnings shows, YOY growth ranged from 49.4% to 51.3% in Q3 2016. Fourth quarter (9/30/2016) is expected to see YOY growth of 33.5%.


Beginning in the December quarter though, YOY earnings growth is expected to decline to single digits, 7.1%. Further, without share buybacks, the YOY earnings growth rate would equal only 2.6%. Therein lies our issue with the stock. Tyson is a good company, but the company's stock price seems to have gotten ahead of earnings growth fundamentals at least near term. One factor that tends to serve as a headwind for stocks is when the growth rate of earnings is slowing over time, especially after being strong for an extended period of time historically. In this slowing earnings growth environment, often times a stock's valuation will adjust to account for the slowing earnings growth rate. This adjustment can occur either over time by trading sideways or can adjust in price be some decline in the stock's price.

This leads me back to the 9% decline in TSN's stock price on Friday. The decline was in response to a research report released by Pivotal Research Group. In the report Pivotal indicated there might be price fixing issues related to broiler chickens. The report's conclusion is related to a class action complaint filed on September 2nd, Maplevale Farms, Inc. v. Koch Foods, Inc. et al, According to Pivotal, "The complaint alleges that Tyson, together with Koch Foods and multiple other players in the broiler chicken business, systematically colluded to reduce production of broilers since about 2008. The mechanism for collusion is not a shady meeting in a hotel room, as was once done by players in the lysine market. Rather, the complaint alleges supply collusion occurred through nonpublic data exchange; detailed industry reports compiled on a daily or weekly basis by Agri Stats, Inc., a subsidiary of Eli Lilly and Co., and then sold back to industry participants."

In conclusion, all else being equal, at the time of our last sell of TSN, we believed the company's stock valuation needed to decline to a mid to low double digit P/E multiple given the slowing earnings growth rate. With Pivotal highlighting the recent class action lawsuit, this to could have a negative impact on TSN margins and future earnings growth. As a result TSN's stock price has and is adjusting to a P/E multiple that is more in line with the anticipated growth rate of TSN earnings. For investors, when earnings growth of a company slows from over a 40% growth rate to single digits, a stock's price will often adjust downward to account for this slowdown. On top of this, when secondary news like the above noted class action lawsuit comes out, a stock priced for perfection can decline sharply, as was the case for TSN Friday.


Friday, October 07, 2016

Inspite Of Decline In Buybacks, Aggregate 'As Reported Earnings' Continue To Increase

Last week S&P Dow Jones Indices reported preliminary aggregate data on buybacks, dividends and earnings for the quarter ending June 30, 2016. Of note in the second quarter is buybacks declined 21% versus Q1 2016 and down 3.1% versus Q2 2015. Importantly, as reported earnings increased for the third consecutive quarter increasing to $201.79 billion versus $189.37 billion in Q1 2016. Dividends of $98.3 billion represented a 4.1% increase versus Q2 2015. Year over year dividend growth has remained positive since June 2010, although growth has slowed to a mid single digit growth rate.

Data source: S&P Dow Jones Indices

As Howard Silverblatt, Senior Index Analyst at S&P Dow Jones Indices notes in the report,
  • Cash reserves also set a new record for the second consecutive quarter, as S&P 500 Industrial (Old), which consists of the S&P 500 less Financials, Transportations and Utilities, available cash and equivalent now stands at $1.374 trillion, up 2.0% from the prior record of $1.348 trillion. The current cash level is 86 weeks of expected 2016 operating income (the same as was posted for Q1 2016), giving corporations leeway in their expenditures.
  • “Shareholder returns continue to be strong, even as the quarter ticked down from last quarter’s record, Cash has increased to a record, as low-cost financing globally remains plentiful."
  • "The rate of dividend increases continues to slow across sector lines, as income investors remain limited in their alternatives. Base buyback expenditures, those used to negate stock options, may need to increase in Q3 2016 to compensate for higher share prices. Discretionary buybacks, used to reduce share count and increase EPS, remain the main unknown.”


Sunday, October 02, 2016

More Signs Of An Earnings Recovery Unfolding

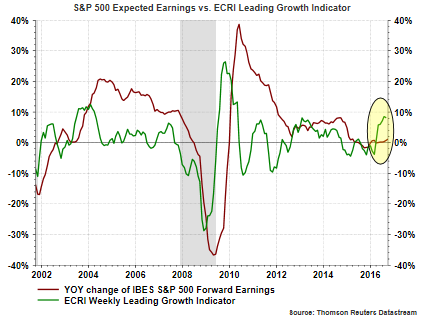
As I have noted in recent posts, an earnings recovery seems to be unfolding. Increasingly, more data continues to point to this earnings recovery over the course of the next twelve months. On Friday, the Economic Cycle Research Institute released data on its proprietary Weekly Leading Index. A variation of this same index is the Leading Growth Index (WLIg). As the following chart shows, the WLIg turned positive in March. Importantly, earnings growth tends to follow changes in the WLIg and recent positive equity market returns may be anticipating an improvement in both the economy and earnings.


Two variables that led to the earnings headwinds in 2015 were the strong U.S. Dollar and the contraction in oil prices, both of which had a negative impact on a number of sectors in the economy. Brent Crude equaled $36 per barrel at the end of 2015 and closed in September at $46 per barrel. Oil prices are likely to remain volatile; however, OPEC’s announcement at the end of September of a production cap (cut) provides some desire by OPEC to see some balance in the supply and demand for oil. This potential balance will be favorable for companies exposed to the energy sector of the economy. As a caution though, in the early 1980’s, OPEX cut supply and then saw oil prices fall 40% as other producers increased supply in order to capture market share. In fact, a similar dynamic could play out this time as the Baker Hughes rig count has increased from 408 in May to 481 in August.


Sunday, September 25, 2016

The Risk Of Dismissing The Data: The TED Spread And Baltic Dry Index

No single variable or statistic provides clear insight into the future direction of the economy or stock market. When a data point does not fit ones narrative though, justification to eliminate it seems to be gaining among some strategists. Recently, the market has seen a fairly significant spike in LIBOR and a resultant increase in the TED Spread, i.e., 3-month LIBOR minus 3-month Treasury.


Thursday, September 22, 2016

Sentiment: Investors Not Believing The Rally

This morning the American Association of Individual Investors released their Sentiment Survey showing a 3.1 percentage point decline in bullish sentiment to 24.8%. The bullish sentiment reading reported by individual investors remains below the -1 standard deviation level of the sentiment measure which is 28.3%.The 8-period moving average of the bullish reading declined as well to 29.6%. 

A vast majority of the decline in bullish sentiment showed up in bearish sentiment (+2.4 percentage point increase) with a net impact of widening the bull/bear spread to -13.5. This is the widest the bull/bear spread has been since late May when the spread was -14.8. Since that point in May the S&P 500 Index is up 5.6% on a price only basis. As individual investors continue to doubt the markets this year, they continue to move higher nonetheless.


Monday, September 19, 2016

Heightened Market Volatility Would Favor Low Volatility Strategy, But It Looks Expensive

A little more than a year ago we wrote about the outperformance of the low volatility strategy versus a more risk on/high beta strategy. At that time it was noted low volatility could persist; however, if the broader market reached new highs, the high beta strategy would likely outperform low volatility. This has essentially played out and as the calendar turned to 2016 the early year market pullback saw the high beta strategy succumb to significant selling pressure and was down 20% into the February low, almost twice the broader market's beginning of year decline. Once the market began recovering from the February low though, high beta has outperformed the low volatility strategy, 25% versus 9%, respectively.


Sunday, September 11, 2016

The Dogs Of The Dow And The Risk With Exchange Traded Notes

Three quarters through the year, the Dogs of the Dow strategy continues to be a winning one, outpacing the Dow Jones Industrial Average and the S&P 500 Index by nearly three times. The average return of the 2016 Dogs of the Dow equals 16% versus the Dow Index return of 5.7% as of Friday's close. As noted in earlier posts, the Dogs of the Dow strategy is one where investors select the ten stocks that have the highest dividend yield from the stocks in the Dow Jones Industrial Index (DJIA) after the close of business on the last trading day of the year. Once the ten stocks are determined, an investor invests an equal dollar amount in each of the ten stocks and holds them for the entire next year.


With the popularity of indexing, some investors have pursued the Dow Dogs strategy via an exchange traded note, the ELEMENTS "Dogs of the Dow" Linked Note (DOD). The return of this note has varied greatly from the performance of the Dogs of the Dow themselves. There are peculiarities with these types of exchange traded products investors should be aware of. More detail on the risk of exchange traded notes can be read here. Two important ones are the fact these investments are essentially bonds of the sponsor of the exchange traded note. In the case of DOD, the issuer is Deutsche Bank AG and an investor in DOD has unsecured credit exposure to Deutsche Bank AG. Secondly, the return on these notes are 'based' on some underlying index or basket of investments. In the case of DOD the ETN's return is based on the Dow Jones Select 10 Total Return Index. Because the issuer is not required to issue more shares of the ETN, the price of the ETN can diverge from the value of the underlying Index and in some cases the divergence is significant. This has occurred with DOD as can be seen in the below chart.


Year to date through early June DOD was up nearly 60% while the underlying Dow Jones Select 10 Index was up only 11.3%. As is typically the case, the large premium at which DOD traded quickly narrowed to the actual return of the underlying index.

Lastly, in this low interest rate environment, investors have a heightened focus on income generating equities. From a total return perspective though, the Dogs of the Dow strategy has had mixed results from year to year.


Friday, September 09, 2016

Transports Leading Industrials A Bullish Market Signal

As early as about six weeks ago, some technical strategists were projecting a near trigger of the Dow Theory sell signal. In short, when the Dow Industrials and the Dow Transport Indexes are in an uptrend together, i.e. higher highs and higher lows, the market is in a bull market uptrend. Conversely, when both indexes are making lower highs and lower lows, a bear market trend is in place or developing. If one sees divergence in the indices, this can be a signal of a change in direction of the market and this was occurring in July of this year when the transports were weakening.

As of the close yesterday though, the year to date return of the transport index return now surpasses that of the Dow index return as can be seen on the below chart. The transport index weakness in late July has been quickly reversed in August and early part of September.


Additionally, positive chart setups have triggered which portend potentially higher prices ahead for both indexes. For the transports an inverted head and shoulders pattern has triggered with an upside target price of about $162 and cup and handle trigger with a lower target than the inverted H&S trigger of $150. Additionally, in spite of the near sideways trading action in the Dow Industrials Index, bull flag formations are in play and are suggestive of potentially higher prices as well.


The industrial and transport segments of the market seem to be indicating an improvement in the operating environment over the next 6-12 months. If earnings prospects continue to improve, as we have discussed in earlier posts, the odds of higher equity prices over the course of the next year seem likely.


Friday, September 02, 2016

Another Month Of Equity Outflows

Individual investor sentiment continues to show a low level of bullishness and this has translated to continued outflows in equity mutual funds and exchange traded funds. Almost a month ago I noted the strong outflow from equity funds and ETFs that occurred in July and this selling trend continued in the month of August.


The outflows have caused assets in equity mutual funds to decline while equity ETF assets have increased on a year over year basis as of the end of July. The increase in ETF assets is largely due to the strong equity market returns from a year ago, for example, the S&P 500 Index is up over 12%.


Sunday, August 28, 2016

Higher Oil Prices Must Contend With Too Much Inventory

Crude oil prices spiked above $50/bbl in early June and have fallen back to $47/bbl as of Friday's close. The high $47 level remains above the early August low of $39.52. Further weakness in oil prices is likely as a result of stubbornly high crude oil inventories (excl. the Strategic Petroleum Reserve.) On Wednesday last week, the Energy Information Administration (EIA) reported weekly inventories increased 2.5 million barrels and is a reversal of the 2.5 million barrel decline in the prior weekly report. Not that one or two weekly reports tell the entire story, but, as the below chart shows, inventories remain at very elevated levels and prices are not likely to move higher until this elevated inventory is reduced.


Saturday, August 27, 2016

Income Focused Investments Continue To Show Weakness

Janet Yellen's Jackson Hole comments on Friday did not do any favors for the performance of income focused investments. The Fed chairman's comments($) led market participants to believe a rate hike for September is back on the table and at least more likely in December. The rate hike fear continues to put downward pressure on income focused investments which some investors view as bond substitutes. So far in the month of August the SPDR Dividend ETF (SDY), the iShares US Real Estate ETF (IYR) and the SPDR Utilities Sector ETF (XLU) are all underperforming the broader S&P 500 Index. Also, for the month of August these three ETFs are showing negative total returns with XLU down 2% on Friday alone.


The site, ETF.com, reported the utility sector ETF was among the top 10 ETFs experiencing outflows for the week, withdrawals totaling $263 million.


Monday, August 22, 2016

What A Difference A Day Makes: The Calendar Roll

The S&P 500 Index was essentially flat today, down .06%; however, an investor's one year price only return will increase over three full percentage points from last Friday's close to today's close. For an investor invested in the S&P 500 Index, Friday's (8/19/2016) one year price only return equaled 7.28% and one day forward to Monday's close, the investor's one year return increases to 10.74%. The reason for this is the calendar rolling forward one day, weekends result in some nuances, and August of last year was a volatile month to the down side for the market and this is contributing to the magnitude of the change in return.


This same impact is resulting in large spikes in the one year rolling return for energy as energy prices were in the upper $30 range versus today's $47.41. As time moves forward to year end, energy was falling into the mid $20/bbl area and if oil prices stay near current levels, the year over year price increase will be significant, nearly a doubling of the price of oil.


Saturday, August 20, 2016

Some Favorable Market Technicals But Awaiting A Resumption Of Earnings Growth

For the better part of a month the S&P 500 Index has traded in a very narrow range. Some strategists believe the market has come too far too fast since the June low and a correction is necessary before the market moves higher. We have noted from time to time that corrections can occur in price, i.e., a decline or in time, i.e., trade sideways for an extended period. At this point in time it appears the S&P 500 Index is attempting to go through a corrective phase by trading sideways over time. Of course, the length of time required to qualify for a correction over time is unknown. I believe one key determinant for this market is earnings over the course of the next four quarters which I will discuss later in this post.


One positive indicator on the above chart is the On Balance Volume indicator. The OBV measures volume on up days and volume on down days and accumulates the data over time. It is the trend of the OBV line that is important. If the line is trending up, trading volume is higher on up days versus down days and is an indication of buying demand. Up until this week equity fund and ETF flows were strongly negative. In Lipper's fund flow report earlier this week it is noted investors turned more favorable towards equities as equity flows turned positive with money market flows a negative $20.8 billion. The Money Flow Index (MFI) in the above chart is a volume weighted version of the Relative Strength Index (RSI). The MFI is not at a level indicative of an over bought market and similarly, the RSI is not at an over bought level either as can be seen in the below chart.


Friday, August 19, 2016

Highlights From S&P Dow Jones Indices Dividend Aristocrats Update

S&P Dow Jones Indices recently provided an update on the performance of the S&P 500 Dividend Aristocrats Index compared to the S&P 500 Index. It should be noted the Aristocrats index is an equally weighted index that is rebalanced quarterly. Index members are determined annually based on December year-end information with changes effective at the end of the subsequent January. I have written about the importance of dividends a number of times on this blog and this recent S&P update verifies the important role dividends play in an equity's total return. This post will provide some highlights from the S&P report and readers are encouraged to read the entire research paper.

Although dividends have accounted for a smaller percentage of the the total return for the S&P 500 Index over the past several decades, dividends remain an important component due to the favorable impact dividends have on compounding. As the below chart shows, since 1929 dividends have accounted for over one-third of the return of the S&P 500 Index.


Wednesday, August 17, 2016

Individual Investors Still Love Apple

From time to time I review the most active stocks by individual investors as compiled by Better Investing Magazine. I last updated the list in March and the two stocks that dropped off of the most active list from that time are Under Armor (UA) and Netflix (NFLX). The new additions are Wells Fargo (WFC) and Southwest Airlines (LUV). Apple (AAPL) has remained at the top of the list as far back as January 2015. Below is the most recent active list.


Tuesday, August 16, 2016

Should Investors Worry More About A Bond Or Stock Market Correction?

A great deal of commentary over the past few days has focused on the recent equity market trifecta, i.e., the Dow Jones Industrial Average, the S&P 500 Index and the Nasdaq Composite Index all hit new all time highs on the same day and the heightened potential for an equity market correction. Over the past week or so, LPL Financial Research has published some good analysis around the broad index participation in new highs and potential future market outcomes. Since 1980 12-month rolling returns have been positive 76.5% of the time. As the below table shows, when the Dow, S&P 500 and Nasdaq hit all time highs on the same day, the 12-month forward return is positive 75% of the time and averages 11.9%. I would recommend readers read the LPL article.


Thursday, August 11, 2016

History Suggests Record Equity Market Highs Do Not Mean Investors Should Sell Stocks

In late January and then in mid February I wrote posts noting our firm's positive view on the equity markets (here and here). It was a difficult position to take at the beginning of the year with the market in decline. As of the close today. and the first time since 1999, the S&P 500 Index, the Dow and the Nasdaq hit highs on the same day. Both the Dow and S&P 500 Index are up nearly 7% year to date. A number of high profile (often bearish though) investors/strategists are calling for a severe market correction. Knowing foresight is never perfect, should individual investors get out of equities now? History does not guarantee the future; however, the future tends to rhyme with the past.

LPL Financial Research published an interesting report today that addressed the question of, should an investor sell everything? Included in the report is a brief discussion on sentiment as well. A couple of worthwhile bullet points from the report:
  • There have been 40 other times the S&P 500 was up more than 6% for the year with 100 days to go (like 2016), and incredibly, the rest of the year is up 5.3% on average and higher 90% of the time.
  • Thus, a strong start to the year has led to even stronger returns for the rest of the year.
  • What about the full-year returns? Only once in history has the S&P 500 been up more than 6% with 100 days to go and finished red, and that was in 1929 (emphasis added).


The equity market will certainly experience some pullbacks; however, the positive economic data noted in earlier posts along with some not so bullish investor sentiment today, suggests this market seems to want to trend higher into year end.


Monday, August 08, 2016

Buyback Index Trails Broader S&P 500 Index

In an article earlier today I noted how corporate buybacks over the last two plus years have far outpaced U.S and foreign investors' outflow from equity investments. This strength in buybacks has not translated into outperformance for these buyback firms relative to the S&P 500 Index though. As the below chart shows, the cumulative total return performance of the Powershares Buyback Achievers ETF (PKW) has lagged the cumulative total return of the S&P 500 Index during the last two years. As background, the US BuyBack Achievers Index is comprised of US securities issued by corporations that have effected a net reduction in shares outstanding of 5% or more in the trailing 12 months.


The underperformance became more pronounced beginning in the fourth quarter of 2015. Comparing the two year results above with the one year returns shows the S&P 500 Index has returned 6.29% versus -.43% for PKW over the last 12-months. One headwind that has faced buyback focused investors is the yield differential on the buyback index versus say the iShares Select Dividend ETF (DVY). The yield on PKW is 1.4% and DVY has a yield of 3.0%. In this environment where investors prefer income, PKW's yield is even lower than the S&P 500 Index's yield of 2.1%. Historical stock buyback activity can be found at my post, Stock Buybacks Up Double Digits In First Quarter.


Most Everyone Is Bearish On Equities Except Companies

Last Friday the S&P 500 Index closed at its daily high of 2,182.87 and this equated to a 20.6% advance since the February 11th intra-day low. In spite of this strong advance from the February low and a price only return of 6.8% this year, most investors remain bearish on stocks.
  • This bearishness has translated into equity outflows of mutual funds and ETFs with bond investments capturing much of the inflows.
Source: ICI


Friday, August 05, 2016

Jobs Were The Missing Link?

The equity market's reaction to the above consensus job report today would make one believe the only missing link in the economic recovery was today's job's report. The 255,000 increase in nonfarm payrolls exceeded the consensus of 185,000 and the top range of 215,000. The end result is the S&P 500 Index was able to breakout of its sixteen day trading range.


Tuesday, August 02, 2016

Oil And Equity Price Trend Conundrum

A part of the anticipated improvement in forward earnings for the S&P 500 Index is an improvement in the energy sector. The health in the energy sector has spillover into other sectors of the market like the industrial sector that sells into the energy space. Of late, however, oil prices have pulled back significantly from over $50/bbl in June and dropping below $40/bbl yesterday. This decline in price can be directly attributable to the elevated supply of crude.