Sunday, April 27, 2014

Be Careful Not To Fall Prey To The Consensus

Often times the difficult aspect of writing blog commentary is posting articles that are interesting to investors and, more importantly, not a repeat of the commentary written by others. At times some of the same topics are repeated on the web during a given week where each article provides no new insight to readers. The repeating of similar topics begins to give investors the sense that a consensus view is developing. And one factor we know about the market is it likes to prove the consensus wrong. A good example of this fact is displayed when looking back at prognosticators' predictions at the beginning of the year. Most predictions were of the general theme that stocks would outperform bonds, but as the below chart shows, bonds have actually outperformed stocks. So what is the point?

From The Blog of HORAN Capital Advisors

A theme currently getting a great deal of attention is the "sell in May and go away" topic. Even we have written about this seasonal market factor a number of times, as recently as mid-March. The importance of this theme is best explained by the below chart.

From The Blog of HORAN Capital Advisors

The chart certainly speaks for itself; however, Jeff Miller, PhD, who writes commentary on his A Dash of Insight Blog, notes,
"The seasonal slogans often substitute for thinking and analysis. The powerful-looking chart...actually translates into a 1% monthly difference in performance. The "good months" gain 1.3% on average while the "bad months" gain about 0.3% (emphasis added).

To make a wise decision you need to make an objective quantitative comparison between the economic trends and the small seasonal impact. The Great Recession has been followed by a slow and plodding recovery. We have an extended business cycle with plenty of central bank support. Since I am expecting the current cycle to feature (eventually) a period of robust growth, I do not want to miss it. The 1% seasonal effect will be minor in a month where we get a real economic surge."
The next chart displays the previous chart data in a different way. In an effort to visualize Jeff Miller's comment, "...I do not want to miss it. The 1% seasonal effect will be minor in a month where we get a real economic surge," the below chart shows average returns for various time periods going back to 1950. The take away from the below chart is the fact, even as bad as the May to October period can be, on average, the returns remain positive.

From The Blog of HORAN Capital Advisors

Another consensus discussion has been the rotation trade out of growth stocks into value stocks. The below chart reflects the fact value has been outperforming growth since the beginning of March. Importantly for investors, why is or has this occurred. The value style tends to outperform growth late in the economic cycle. In reviewing the technical aspects of the chart, there may be reasons to believe this trade is nearing a trend reversal. As the circle at the end of the chart notes, over the course of the last few weeks value is actually struggling to outperform growth with the MACD rolling over as well. The second chart below shows the momentum index (MTUM) performance versus the broader S&P 500 Index. Is a trend reversal taking shape here too? When I read commentary like this, OUT, I am led to believe a trend change is closer to occurring than not.

From The Blog of HORAN Capital Advisors

From The Blog of HORAN Capital Advisors

A discussion on the weather's impact on first quarter results also seems appropriate too. Many first quarter reports have cited weather as a factor in negatively impacting first quarter results for companies. One segment of the market that reasonably can be thought to have been negatively influenced by the weather is retail. In our blog post in mid January, Broader Implications Of A Weakening Retail Sector, the below chart was included in the post showing the significant underperformance of the retail sector from the end of November to mid January.

From The Blog of HORAN Capital Advisors

In that post we highlighted a couple of points.
  • "if the pervasive market sentiment is the consumer has rolled over, vis-à-vis the market and the economy, the efficient market hypothesis would imply this type of news is factored into current stock prices."
  • "The weaknesses in some consumer stocks is certainly worth paying attention to; however, the market/investor already knows a lot about this weakness and a majority of this bad news may be factored into stock prices [emphasis added]."
How has the retail sector performed since that January post? It has essentially tracked the market and has generated a return in excess of 6% as can be seen in the below chart.

From The Blog of HORAN Capital Advisors

Importantly for investors, when a trend becomes evident the positive or negative results from the given trend may be mostly played out. At the end of the day, fundamentals are an important driver of the market's longer term movement. With this said, earnings season is in full reporting mode and results are generally positive. Some highlights from Reuters:
  • Second-quarter outlooks for S&P 500 companies so far are much more optimistic than the last two quarters. Fewer companies are cutting estimates and those that are reducing forecasts haven't done so as aggressively as in the past.
  • "The downward revisions for the second quarter right now are very, very mild," said Nick Raich, chief executive officer of The Earnings Scout, an independent research firm specializing in earnings trends."
  • Surprisingly strong results have come from many high-profile names, including Apple , Caterpillar , Netflix and United Technologies . That's offset what Wall Street had expected to be a lackluster first quarter. Estimates were slashed, heading into this earnings period as the unusually harsh winter hampered transportation, kept people out of stores and raised heating costs.
  • So far, 69 percent of companies have beaten analysts' expectations, above the long-term average of 63 percent, Thomson Reuters data showed.
  • Helping to relieve concerns, United Technologies, Coca-Cola , General Motors and McDonald's all reported strong results from their China operations. That's negated one of the market's primary worries that weak demand from the world's second-largest economy would hit profits. "It is still a little surprising how strong China remains, given what you read," United Technologies' Chief Financial Officer Greg Hayes said in an interview, in reference to the conglomerate's building systems businesses.
So to rephrase Jeff Miller's comment, do not let the consensus and "...seasonal slogans substitute for thinking and analysis."


Disclosure: Family long UTX, CAT


Wednesday, April 23, 2014

Investors Holding Cash Confounded By Market Action

Until today, when the S&P 500 Index declined .22%, the market had managed to move higher on the prior six trading days. The six day climb followed what some investors thought might be a correction beginning to take place in the market.
  • On April 2nd the S&P reached 1891 before declining 4% to 1816 on April 11th.
  • The six subsequent trading days saw the S&P 500 Index rise 64 points to 1880, nearly recapturing the high reached on April 2nd.
This type of trading action has been the norm for this market going back to mid year 2013. I prepared the below chart late last night and was motivated to post it here following a similar chart highlighted today by Charles Kirk of The Kirk Report. The red 150 day moving average line has served as an important support level for the market for the past year and a half.

From The Blog of HORAN Capital Advisors

Charles Kirk commented, "this is also why the short-term quant data suggests new highs versus more traditional metrics." Putting Kirk's comment another way, algorithmic trading has been "programmed" to trade these patterns. Until we see a breakdown of this pattern type trading, the markets will likely move in the direction of its current longer term trend and that is higher at the moment.

The absence of a market correction, i.e., a decline of at least 10+% has confounded some investors. A chart making the rounds on the internet today is the one below. The chart resembles the trading set ups in the shaded boxes in the above chart.

From The Blog of HORAN Capital Advisors

Further influencing investor sentiment is the trading action of stocks following their earnings announcements, like Apple's (AAPL) stock price action tonight. Apple reported earnings tonight and once trading resumed in the stock Apple's shares traded $40 higher or a gain of 8% in after hours trading. More detail needs to be gleaned from the conference call, but Howard Silverblatt of S&P Dow Jones Indices noted the stock buyback impact reduced share count by 3.4% resulting in an EPS increase for the March quarter of 15.2% versus the March 2013 quarter. Net income though only increased 7.1%. If one needed an example of a breakdown of the Efficient Market Hypothesis, this might be a good place to start.

Disclosure: Family long AAPL


Tuesday, April 22, 2014

Investor Letter Spring 2014: The Weather Is To Blame

As we noted in our fourth quarter Investor Letter, we cautioned investors about looking at past returns and projecting those into the future. The first quarter of this year was a perfect example where returns in 2013 did not carry over into the first quarter. Our Spring 2014 Investor Letter provides commentary on the rotation that has occurred in the market during the first quarter. What makes the economic assessment more difficult at the moment is the fact this winter's weather was some of the worst in recorded history, not only in the Midwest, but across the entire U.S. The Southeast even experienced snow this winter. Below is the link to our Spring Investor Letter that provides our review of the quarter and insight in to the year ahead. For our clients and readers, we appreciate the confidence you have placed in us and always welcome your comments.

From The Blog of HORAN Capital Advisors


Sunday, April 20, 2014

Week Ahead Magazine: April 20, 2014

Nearly four months into the trading year and the market indices have essentially traded sideways from the beginning of the year to Thursday's close. The S&P 500 Index is up .89%, the Nasdaq 100 is down 1.60% and the S&P SmallCap 600 Index is down 1.17%. On the other hand, as we noted in a post late last week, certain segments of the market have experienced significant corrections: social media and biotech, for example. One link in this week's magazine is an article written by Ben Carlson of the site, A Wealth of Common Sense. One recent article, Financial Matters, is one every investor should read as it contains an interesting list of factors investors should and should not focus on. Below is the link to articles for the coming week.


Saturday, April 19, 2014

Dow Dogs Are Front Of The Pack

Interestingly, we last highlighted the Dogs of the Dow strategy about this time last year and at that time the Dow Dogs were outperforming the overall Dow Jones Industrial Average Index. For all of 2013 the Dow Dogs of last year outperformed the Dow Index as well as the S&P 500 Index. As we turn our attention to 2014, the Dogs of the Dow are again outperforming many of the broader market indices except for the utility index and the transportation index. The Dow Dog strategy consists of selecting the ten stocks that have the highest dividend yield from the stocks in the Dow Jones Industrial Index (DJIA) after the close of business on the last trading day of the prior year. Once the ten stocks are determined, an investor would invest an equal dollar amount in each of the ten stocks and hold them for the entire year. Investors should note the strategy has generated mixed results over the years though.

Below is the year to date performance of the Dow Dogs through the market close on 4/17/2014. Below the table is a listing of the performance of a few market indices for this year as well. The year to date outperformance of this strategy is in line with the recent rotation occurring within the market from growth style equities to value style equities.

From The Blog of HORAN Capital Advisors

From The Blog of HORAN Capital Advisors


Sunday, April 13, 2014

Week Ahead Magazine: April 13, 2014

Many of the links in this week's magazine cover commentary about the recent rotation that appears to be occurring within the equity market. Additionally, several article links provide insight into important economic reports for the coming week. Lastly, earnings season for the first quarter kicks into high gear with a number of companies reporting this week and next. The link to this week's magazine is provided below.


The Downside To Chasing Prior Winning Strategies

We have discussed the potentially negative investment consequences resulting from investors projecting recent outcomes into the future, recency bias. One key for investors to keep in mind is to determine if a recent result is the beginning of a longer term trend either up or down. What is difficult in this type of assessment is trends are not of equal duration. The first chart below shows small cap stocks have outperformed large cap stocks since the end of the bursting of the technology bubble in 2002 (nearly 12 years). The second chart compares the biotechnology ETF, IBB, to the S&P 500 Index. Biotechs have been outperforming the broader market since mid 2011 (almost 3 years). As we noted in yesterday's post, biotech performance has been much weaker over the course of the past several months than the broader market. Is this the end of the biotech outperformance trend?

From The Blog of HORAN Capital Advisors

From The Blog of HORAN Capital Advisors

In addition to the above market segments, small cap and biotechs, trend reversals from 2013 are also evident. In a recent comment by Charlie Bilello, CMT of Pension Partners, he compares the returns of certain market segments in 2013 versus 2014. A number of the better performing market segments in 2013 have now turned out to be the weaker ones in 2014 and vice versa.

From The Blog of HORAN Capital Advisors

Simply chasing last years winners or jumping into a trend trade too late or even too early, can have negative consequences for the return of one's investment portfolio.


Saturday, April 12, 2014

The Market Beyond First Quarter 2014

Five out of the last six trading days have seen the Dow Jones Industrial Average rise or fall by more than 100 points. This type of market volatility certainly can be unsettling to investors. In addition to these 100 point plus or minus swings, is the increased commentary by some well known market strategists that are calling for a significant downturn in the market. In spite of this volatility and the rhetoric on television news shows, the S&P 500 Index is down less than 4% from its high and only down 1.8% year to date.

The cause of the bearish market view is partly attributable to the correction occurring in some parts of the market. As the below chart shows, two sub-sectors of the market that have corrected significantly are the biotechnology companies (IBB) and the social media stocks (SOCL). A couple of the safehaven sectors, utilities and consumer staples, have held up well since the two momentum sectors below began to correct beginning in late February.

From The Blog of HORAN Capital Advisors

So, in reality, investors have found a reason to rotate out of the momentum sectors. From a positive perspective, this has brought the valuations of some of the momentum stocks back down to a more reasonable level.

Another area of the market being impacted by this rotation is the rotation out of growth type stocks to value stocks. We discussed this in an article in late March, Why It Matters That Value Stocks Are Outperforming Growth Stocks. This rotation into value is continuing and is evident in the updated chart below.

From The Blog of HORAN Capital Advisors

This type of market environment provides the bears with a platform from which they can voice their bearish market point of view. Bullish investors need to pay attention and evaluate the points raised from the bears. Importantly though, the market's direction will trend in the direction of expected future earnings growth and the anticipated growth of the economy. From an earnings perspective, the first quarter of 2014 is shaping up to be a weak one. In a recent report from Factset, they note earnings are estimated to decline 1.6% in the first quarter. If this is realized, the Q1 2014 decline would be the first since earnings declined 1.0% in the third quarter of 2012 (2013 turned out to be a good one for S&P 500 stocks). The Factset report contains highlights from some companies that have implicated the harsh winter weather experienced in the first quarter as contributing meaningfully to weaker Q1 earnings. When companies miss earnings or lower guidance, they like to find a scapegoat that is something other than an internal operating issue--the weather is the scapegoat in Q1. However, we do believe the weather is a valid factor that has contributed to Q1 earnings weakness and may likely reverse itself in the last three quarters of 2014.

From The Blog of HORAN Capital Advisors

What is an investor to do in a market like being experienced at this point in time? One investor that is gaining a great deal of press recently is Marc Faber.  Mr. Faber is predicting that the 2014 correction will be worse than the correction experienced in 1987. My problem with his correction call is the following:
I suppose if one always calls for a correction, they will eventually be right. And if Marc Faber is finally right that a 1987 style correction is in store for the market this year, should one sit out the market now.

Below is a chart of the S&P 500 Index going back to 1986. The chart clearly shows the 1987 correction when the S&P fell over 57 points to 282. About a year and a half later (April, 1989), if an investor stayed invested in the market, they would have recovered entirely from the decline.

From The Blog of HORAN Capital Advisors

In conclusion, corrections are difficult to predict. In fact, I do not know any famous market timers. One of many keys to surviving a correction is to have an appropriate allocation in one's investment account that can fund one's lifestyle without the need to sell stocks right after a significant correction. In that regard, I recommend investors read Howard Marks recent newsletter, Dare to Be Great. A few highlights from his report:
  • How do you think about risk? Is it volatility or the probability of permanent loss? Can it be predicted and quantified a priori? What’s the best way to manage it?
  • How reliably do you believe a disciplined process will produce the desired results? That is, how do you view the question of determinism versus randomness?
  • Most importantly for the purposes of this memo, how will you define success, and what risks will you take to achieve it? In short, in trying to be right, are you willing to bear the inescapable risk of being wrong?
  • The real question is whether you dare to do the things that are necessary in order to be great. Are you willing to be different, and are you willing to be wrong? In order to have a chance at great results, you have to be open to being both.


Thursday, April 10, 2014

Bullish Sentiment Reading A Positive Data Point For Stocks

This morning the American Association of Individual Investors reported individual bullish investor sentiment decline 6.9 percentage points to 28.5%. This compares to the February 6, 2014 level when bullish sentiment was reported at 27.9%. All of the decline in bullish showed up in the bearishness reading that rose 7.3% to 34.1%. The 8-week moving average of the bullishness reading declined to 36.9% and is the lowest level since this average was reported at 35.8% in mid July of 2013. For investors, this measure is a contrarian one and is most accurate at its extreme. This week's lower bullishness level is one that is approaching an extreme and in and of itself is one a positive reading for the future direction of the equity market if one is a bull.

From The Blog of HORAN Capital Advisors


Monday, April 07, 2014

Week Ahead Magazine: April 6, 2014

In spite of the weak finish to the market on Friday, most U.S. equity indices ended higher on the week. The Dow Jones Industrial Average and the S&P 500 Index finished the week up .5% and .4%, respectfully. The NASDAQ though declined 1.2% as many momentum related stocks experienced the brunt of the sell off. Economic data is pretty light this week with FOMC minutes being released on Wednesday, jobless claims on Thursday and PPI and consumer sentiment on Friday. One article in this week's magazine notes forward four quarter earning estimates for the S&P 500 Index are rising. Additionally, one of our articles notes the low bar that has been set for earnings in the first quarter. If earnings are accelerating and we start seeing a number of earnings beats for S&P 500 companies the market could be setting itself up for a rebound.

At a recent market seminar, Ned Davis Research provided a sentiment trading chart that notes trading sentiment has moved into the extreme pessimism zone. Certainly there are seasonal hurdles to overcome as we are nearing a potentially weak market period that has occurred during mid term election cycles. Below is the link to this week's magazine.


Sunday, April 06, 2014

The Labor Force Participation Rate: Now A Controversial Variable

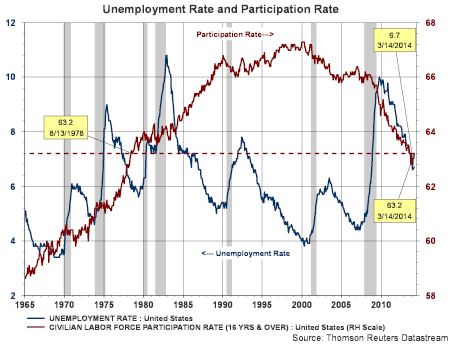
If there is one seemingly boring economic statistic that is now creating a lot of controversy it is the continuing decline in the labor force participation rate. Much of the debate around this statistic is important because it provides insight into the health of the economy and more importantly the labor market. As can be seen in the below chart, the participation rate (maroon line) is now at a level reached in 1978.

From The Blog of HORAN Capital Advisors

I surmise if we could go back to 2007 and rewrite history so the financial crisis and resulting recession never occurred as well as no quantitative easing programs, the labor force participation rate would not be on many economists and non-economists radar. However, the angst this statistic can cause spiked last week when the Wall Street Journal reported on Friday's Employment Situation report, U.S. Reaches a Milestone on Lost Jobs. One factor in the report that stimulated some interest was the below chart that is included in the WSJ article.

From The Blog of HORAN Capital Advisors

In a response to the article, Bill McBride author of the well written Calculated Risk website, wrote an article indicating the Journal needed to post a correction to its article. The main point made in the Calculated Risk article is the Wall Street Journal's above graph ignores the demographic impact on the participation rate. Bill's article, WSJ Employment Graph ignores Demographics, Needs Correction, provides his viewpoint on the Journal's take on the payroll report.

In an article written in Investor's Business Daily, Hold The Champagne On That Job Report, this article notes the labor force has grown by 12.2 million participants. The IBD article uses the current labor force participation rate and notes, "That means just to get back to where we were when the recession started — based on a labor force participation rate of 63.2% — we have to create at least 8 million more private-sector jobs. Even if the workforce didn't grow at all, it would take us more than 3 1/2 years."

James Bullard, Chief Executive Office of the Federal Reserve Bank of St. Louis, is weighing in on the participation rate decline as well. In a paper he released in the first quarter of 2014, The Rise and Fall of the Labor Force Participation in the United States, he points to the heightened interest being placed on this indicator.
"Labor force participation in the United States has been a controversial subject in current macroeconomic discussions...The participation rate - a measure of the number of people actively involved in labor markets - has generally been a secondary concern in macroeconomics. However, with recent sharp declines following the financial crisis and recession of 2007-2009, it has suddenly become a salient topic, and one that gets discussed even in non-economic settings."

"At its broadest level, the debate about the labor force participation rate is a debate about the nature of the U.S. economy over the 4½ years since the end of the recession in the summer of 2009. Should we characterize the economy as substantially back to normal following the very severe recession? Or, has little progress really been made, so that the economy remains far from its potential?"

"There are clear lines of argument on both sides, sometimes blurring political boundaries. Some suggest that the extraordinary policy response since the end of the recession has been largely ineffectual, perhaps citing the very flat employment-to-population ratio since 2009, and that their own suggested policy responses would have produced better outcomes...." (emphasis added)
In the Bullard paper, he notes the steady rise in the participation rate from 1980 to 2000. Subsequent to 2000 the participation rate has mostly been on a decline. He does believe demographics has played a roll in the rise and now decline of the participation rate. From the late 1940s to mid 1960s the participation rate was fairly stable at 59.1%. Additionally, economic activity was pretty good during this period of a lower participation level. In the Bullard paper he notes several studies projecting future participation rate levels. In one such study, the participation rate is expected to decline steadily, or by 15 basis points, to the year 2022. In this study, 70% of the decline is attributable to demographic factors like baby boomer retirements. Several other studies are cited in the Bullard paper, but he is clear that further work needs to be done on this topic.

Lastly, if the participation rate decline is due to demographic factors, one might expect to see changes in the number of individuals receiving social security benefits that are directly attributable to retirements. The below chart shows the annual change in individuals receiving benefit payments from social security strictly as a result of retirement. For the four years from 2009 to 2012, a net of over four million individuals joined the social security system due to retirement. The below chart is certainly on a trend that would forecast net new beneficiaries for social security in excess of one million individuals annually.

From The Blog of HORAN Capital Advisors

Certainly, more work needs to be done in the area of participation. I believe it is fairly clear though that demographic effects are having a large impact in the declining participation rate itself. However, as the IBD article referenced above notes, the labor force has grown by 12.2 million individuals since the recession began. Maybe the current 63.2% participation rate is not the appropriate long run percentage, maybe it is several percentage points lower, but the economy is still not operating at full employment. The Fed is obviously looking at the unemployment rate, which continues to slowly improve, and they may be placing less weight on the participation rate.


Friday, April 04, 2014

Dividend Payers Bounce Back In March

For the month of March the dividend payers in the S&P 500 Index regained their footing and outperformed the non payers by a full 3.75 percentage points. In spite of this outperformance by the payers in March, the payers return continues to significantly trail the non payers return on a year to date and 12-month basis.

From The Blog of HORAN Capital Advisors

For investors though, is the outperformance by the dividend payers in March another sign the market is shifting to focus more on value oriented equities versus growth equities? We discussed this potential transition in a post a week and a half ago when we discussed the significance of the recent outperformance of value stocks versus growth stocks.

The market's action today was certainly most negative for the momentum oriented stocks and biotech and social media sectors. On a year to date basis the utility sector has significantly outperformed the overall market as can be seen in the below chart. Utility stocks tend to be safe haven investments for investors due to their generally higher dividend yields.

From The Blog of HORAN Capital Advisors

We would caution investors to pay attention to stock valuations (P/Es) relative to a company's earnings growth rate (PE divided by EPS growth rate) as some of these historically value oriented stocks/sectors are trading at rich valuations and high PEG ratios.


Thursday, April 03, 2014

A Low Bar Set For First Quarter 2014 Earnings

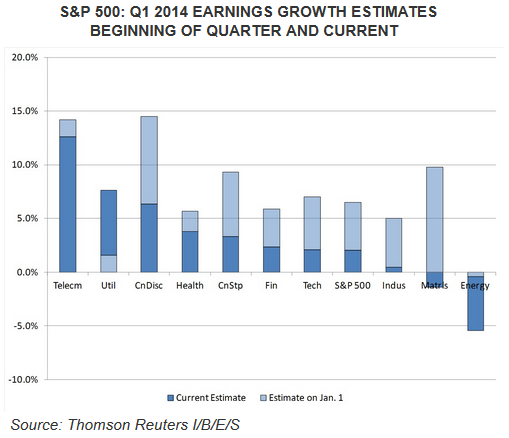
In a recent report issued by Thomson Reuters' AlphaNow, it is noted analysts have lowered the bar for first quarter earnings. The only sector that saw an increase in earnings expectation for Q1 is the utility sector. The analyst revisions result in year over year first quarter earnings growth of only 2.1% versus the 6.5% in place at the beginning of the quarter. Not surprisingly, weather is being cited as the main culprit for the lowered expectations.

From The Blog of HORAN Capital Advisors
Source: AlphaNow

The report concludes, "As the first-quarter earnings season gets under way, it will bear watching to see whether the negative effects of the weather outweigh the positive drivers of earnings, like consumer spending and the housing market rebound." Alcoa (AA) kicks off the official Q1 earnings season on April 8th.


Sunday, March 30, 2014

Week Ahead Magazine: March 30, 2014

Monday marks the last trading day of the first quarter of 2014. The first three months of market action this year have been anything but similar to the first three months of 2013. In the first quarter last year, the S&P 500 Index returned over 10%. Before trading on Monday, the first quarter return in 2014 equals about .5%. As the below chart shows, January saw some profit taking after strong returns in 2013. The S&P 500 Index recovered the January losses in February and proceeded to generate positive returns in March. However, as the below chart shows, the market is near breakeven for the quarter.

From The Blog of HORAN Capital Advisors

A number of article links in this week's magazine highlight economic data, both in the U.S. and in the euro zone, that indicates the global economic environment has stabilized and is growing moderately. 

Below is the link to this week's magazine.


Thursday, March 27, 2014

Equity Market Declines, Bullish Investor Sentiment Declines

Recently, changes in investor equity market sentiment have followed changes in the S&P 500 Index. As the market declines, bullish investor sentiment has declined as well. True to form, bullish sentiment fell this week as reported by the Association of Individual Investors. Bullish sentiment fell over five percentage points to 31.2% versus the prior weeks level of 36.8%. The long term bullishness level is 39% and one standard deviation below this average is 29%. Consequently, this level of bullish sentiment is nearing levels seen at prior market bottoms. Readers should keep in mind this contrarian indicator is most accurate at the extremes.

From The Blog of HORAN Capital Advisors
Source: AAII


Wednesday, March 26, 2014

Why It Matters That Value Stocks Are Outperforming Growth Stocks

Quite a bit of discussion has occurred over the past several days regarding the fact value stocks are outperforming growth stocks. This outperformance has taken place since the beginning of March as can be seen in the below chart.

From The Blog of HORAN Capital Advisors


In looking at a longer view of the value growth cycle, growth had been the outperforming style since April of last year.

From The Blog of HORAN Capital Advisors


The importance of this fact has to do with the performance of these two styles relative to the economic or business cycle. As noted in a white paper, Forecasting Performance Cycles of Value and Growth Stocks in Global Equity Markets, written by David Kovacs, CFA of Turner Investment Partners,
"Following periods when short-term rates ease, lending activity and subsequently business development typically accelerate. During these periods value stocks, led by financial and industrial companies, begin to outperform. As the global economy begins to expand, demand for basic materials, such as metals, and energy related commodities, such as oil and natural gas, rises. That leads to an increase in the price of these commodities which in turn has historically led to the outperformance of the stocks of commodity producers and processors."

"As in the case of an economic slowdown, the monetary response to economic expansion is also typically delayed until sustained signs of acceleration in inflation are apparent. In response, central banks begin to hike short-term interest rates to the point where the interest rate yield curve is flat or inverted, i.e. short-term rates are either equal to or higher than long-term rates. Lending activity to businesses then typically slows significantly, profits of financial institutions decline, and financial stock prices begin to lag the market averages. Economic activity moderates, and once again those stocks that can grow their earnings at the fastest pace, namely, growth stocks, typically resume a period of multi-year outperformance."
In short, as the economy begins to accelerate, value companies begin to outperform. Conversely, when the economy begins to slow, those companies that can grow their earnings in spite of the slowing environment (growth stocks) will begin to outperform.

Below is a chart comparing the sector weightings for the S&P 500 Growth Index to that of the S&P 500 Value Index. Additionally, the last two charts show the top holdings for each of these indexes.

From The Blog of HORAN Capital Advisors

From The Blog of HORAN Capital Advisors

From The Blog of HORAN Capital Advisors

The stock market does tend to be a pretty good weighing machine on future economic activity. If the value style is in fact beginning to assume market leadership on a sustained basis, maybe economic activity is improving. We noted this fact in our post last week highlighting a few economic variables that would be indicative of a strengthening economic environment, Economic Data Continues To Support A Stronger Equity Market. For investors, looking at value stocks that have lagged the market advance that occurred in the second half of 2013 could provide some rewarding investment opportunities.


Tuesday, March 25, 2014

Further Multiple Expansion Possible

In a recent white paper by Fidelity Investments the authors show that valuation in and of itself is a poor predictor of future short term market returns. The report evaluates a number of valuation indicators, including the Shiller CAPE, and points to some shortcomings with the CAPE calculation. In addition to Fidelity, Jeremy Siegel has highlighted issues with the CAPE calculation. Nonetheless, valuation is certainly important for investors to pay attention to as they allocate investment dollars to equity. The Fidelity report does show that valuations are a much better predictor of longer term market returns.

As we noted in yesterday's post, Equity Market Continues To Track Like the 1990s, one characteristic over the past two years similar to the mid 1990s is the fact multiple expansion has enhanced recent equity market returns. Like Fidelity, at HORAN Capital Advisors, we to believe multiple expansion is likely to continue to enhance returns over the near term. The below chart shows the role multiple expansion had in the mid 1990s compared to the  returns in 2012 and 2013.

From The Blog of HORAN Capital Advisors

The Fidelity report includes commentary on valuation measures beyond CAPE and trailing and forward PEs. We have written about the importance of looking at alternative measures of valuation like P/NIPA (price to national income and product account corporate profits) and P/CF (price to cash flow.) Both of these measures have benefits and disadvantages; however, they do make an effort to look at a more comprehensive economic earnings picture or evaluate earnings excluding one time write-offs.

No one measure is a panacea in determining the "right" valuation for the market. However, there is enough data provided by these alternative measures that gives some confirmation that multiple expansion can continue to have a positive impact on large cap equity market reurns in the near term.

Source:

U.S. Equity Valuations Not an Obstacle in 2014
Fidelity Investments
by: Jordan Alexiev, CFA, Senior Analyst; Austin Litvak, Senior Analyst
March 2014
http://www.pyramis.com/fileadmin/templates/pyramis_public/downloads/us/TL_EQ_US-Equity-Valuations-Not-an-Obstacle-in-2014__Pyramis.pdf


Monday, March 24, 2014

Equity Market Continues To Track Like The 1990's

At HORAN Capital Advisors we have written commentary several times over the past six or so months noting similarities of the current equity market advance to market similarities in the 1990s. Our third quarter 2013 Investor Letter cited multiple or P/E expansion. We also posted a follow-up comment in our January 1, 2014 post, Expectations For The Market In 2014. In the January post we included a chart noting the calendar year returns for the S&P 500 Index in the mid 1990s.

Today, Ed Yardeni of Yardeni Research provided an updated chart noting the current market advance begining in 2009 to the market advance for the period 1990 - 2000. As the below chart shows, the current advance continues to mirror the pattern of the 1990 - 2000 period.

From The Blog of HORAN Capital Advisors
Source: Dr. Ed's Blog


You Are Wealthy: No Liquid Assets, $50,000 In Illiquid Assets

I was taken aback by an article that appeared on the Washington Post's Wonkblog. The article title, Living paycheck to paycheck: It’s not just for the poor, states a wealthy individual is one with no liquid assets and $50,000 in illiquid assets. The relevant part of the article noted,
"The Wealthy Hand-to-Mouth," by economists at Princeton and New York University, finds that roughly one-third of American households -- 38 million of them -- are living a paycheck-to-paycheck existence. These are families who hold little to no liquid wealth from cash, savings or checking accounts. But a staggering two-thirds of these households are not actually poor; while they resemble poor families in their lack of liquid wealth, they own substantial holdings ($50,000, on average) in illiquid assets (emphasis added). Because this money is locked up in things like their houses, cars and retirement accounts, they can't easily dip into it when times get tough.
I hate to break it to many readers, but an individual or family that has an average of $50,000 in illiquid assets and no savings will not live a comfortable retirement. The conclusion of the article states this type of individual should be eligible for government entitlement programs. The article refers to these entitlements as "economic stimulus programs."


Sunday, March 23, 2014

Week Ahead Magazine: March 23, 2014

The first quarter of 2014 is coming to an end rather quickly. Appropriately, March Madness not only applies to basketball, but potentially to the market. One article in this week's magazine provides historical performance detail on both the Dow and the S&P 500 Index during the closing days of past first quarters. Additionally, a Lipper article notes investor flows into equity funds have been positive, while, at the same time, bullish investor sentiment has weakened. With the below link to this week's magazine, enjoy some of the articles as we near closing out the first quarter.


Saving At A Younger Age Pays Off In Retirement

In J.P. Morgan's recently released Guide To Retirement, one chart in the guide notes the advantage of beginning a savings program at an early age. The early start to a savings program generates its payoff due to the power of compounding. Compounding refers to the process of earning return on principal plus the return that was earned earlier. I believe the below chart speaks for itself, but with entitlement reform an almost foregone conclusion, retirees will need savings outside of government provided programs like social security.

From The Blog of HORAN Capital Advisors

h/t: Reuters Data Dive


Saturday, March 22, 2014

Declining Foot Traffic At Malls A Challenge For Retailing

Retailing has never been an easy business. Consumer tastes and preferences are ever changing. In a recent report by Fidelity Investments, they note the trend in foot traffic at malls has been on the decline over the past three years.

From The Blog of HORAN Capital Advisors

The report notes a number of factors are likely causes attributable to fewer shoppers frequenting malls, of course the weather is cited as one of those factors this year. More systemic reason are probably influencing this behavior as well with the report noting,
"The growth of mobile devices and the increased accessibility of online pricing have helped fuel increased Web sales. Through the first three quarters of 2013, e-commerce sales increased by 17.4% over the same period in 2012 [according to the U.S. Census bureau]. Today, consumers increasingly turn to their smartphones and tablets to comparison shop on multiple sites simultaneously, rather than travel from store to store for the lowest prices. Purchases can often be delivered within a day or two, at either a nominal shipping expense or free of charge. Further, merchandise returns have been streamlined, as many e-commerce retailers send prepaid return shipping labels to customers with their purchases, removing yet another obstacle to shopping online."
In spite of the potential difficulties facing retailers there are retail segments that seem to be navigating this transition favorably in the opinion of Fidelity.
  • Retail destinations catering to a healthy lifestyle.
  • Housing-related retailers.
  • Warehouse clubs with a varying general merchandise offering.
  • Fast casual restaurants.
  • Dollar stores and off-price retailers
  • “Fast-fashion” retailers.
More detail can be found in the Fidelity report link below.

Source:

Have You Been To The Mall Lately?
Fidelity Investments
By: Peter Dixon, Sector Portfolio Manager, Fidelity Asset Management
March 13, 2014
https://www.fidelity.com/viewpoints/investing-ideas/mall-shopping


Thursday, March 20, 2014

A Decline In Bullish Investor Sentiment After Last Week's Equity Pullback

The American Association of Individual Investors reported bullish investor sentiment fell 4.56 percentage points to 36.78% versus the prior week's bullishness reading of 41.34%. The AAII Sentiment Survey measures the percentage of individual investors who are bullish, bearish, and neutral on the stock market for the next six months. The percentage decline in bullishness was reflected in an increases in a neutral tone by investors as neutral sentiment increased over five percentage points.

From The Blog of HORAN Capital Advisors

Investors are certainly uncertain about the future direction of the market and have been quick to change their sentiment bias upon short term declines in the market. The decline in bullish sentiment this week follows last week's market decline of 1.9% as noted in the below "weekly" chart of the S&P 500 Index.

From The Blog of HORAN Capital Advisors


Monday, March 17, 2014

Economic Data Continues To Support A Stronger Equity Market

Last week the Federal Reserve's release of assets and liabilities for commercial banks showed C&I loans continued to increase at a robust pace. Additionally, today's industrial production figure exceeded expectations with a .6 percent increase in February versus a decline of .2 percent in January. The report noted February's manufacturing output rose 0.8 percent. This followed a .9 percent decline in January. The report also noted that factory production had its largest increase since last August. Specifically,
"Manufacturing production recorded an increase of 0.8 percent in February after having decreased 0.9 percent in January. Much of the swing in the rates of change for production in January and February reflected the depressing effects on output of the severe weather in January and the subsequent return to more normal levels of production in February. The level of factory output in February was 1.5 percent above its year-earlier level. Capacity utilization for manufacturing moved up 0.5 percentage point in February to 76.4 percent, a rate 2.3 percentage points below its long-run average."
The below chart compares industrial production (a coincident indicator) to commercial and industrial loans at all commercial banks.

From The Blog of HORAN Capital Advisors

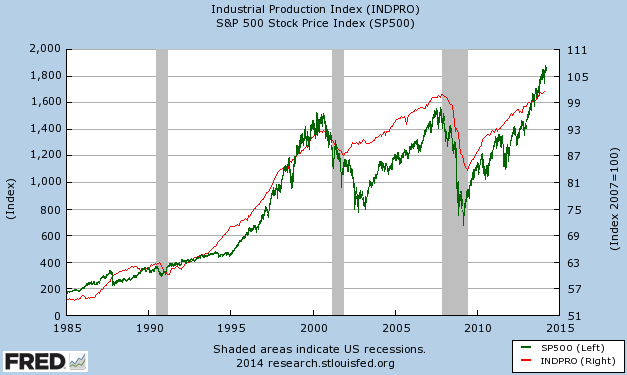
And finally, the improvement in Industrial Production does coincide with an improved equity market as can be seen in the below chart.

From The Blog of HORAN Capital Advisors

The above three measures are now reaching post recession highs. Maybe there is truth to the often cited weather related impact with recent earnings releases. As we leave winter behind, pent-up demand could drive further improvement in economic activity.


Sunday, March 16, 2014

Week Ahead Magazine: March 16, 2014

In just a few short weeks geopolitical events seem to be the top market concern and thus taken steam out of the bull market run. The Ukraine/Russia/Crimea issue seems to have reached a near term conclusion with Crimea appearing to vote today for leaving Ukraine and joining Russia. This geopolitical event seemed to impact market returns this past week with the S&P 500 Index declining 2.0% and the Dow Jones Industrial Average falling a larger 2.4%. This situation will certainly influence market returns early in the coming week. Additionally several important economic reports will be reported this week with the mid week Fed announcement.
  • Monday: Empire State Mfg. Survey and Industrial Production
  • Tuesday: Consumer Price Index and housing Starts
  • Wednesday: FOMC Meeting Announcement and Yellen Press Conference
  • Thursday: Jobless Claims, Philadelphia Fed Survey, Existing Home Sales and Leading Indicators
  • Friday: Futures and options Quadruple Witching
As much of the economic data has been mixed throughout the market's advance from the financial crisis lows back in 2009, the sentiment data is mixed as well. Gallup reports an uptick in investor optimism and I highlighted the report in this week's magazine. On the other hand, Econoday's report on last week's Reuter's/University of Michigan's consumer sentiment index noted, "Consumer sentiment is dipping this month but not the assessment of current conditions. The composite index is down 1.7 points at mid-month to a lower-than-expected 79.9, but the current conditions component is actually higher, up 7 tenths to 96.1 to indicate comparative strength vs February."

For investors then, news events this week will certainly provide a reason for market volatility early in the week. Below is the link to this week's magazine.


Friday, March 14, 2014

More Stocks Beginning To Participate In Market Advance

The Dow Jones Industrial Average fell over 230 points yesterday (-1.41%), the S&P 500 Index declined a lesser 1.17% and many market participants are evaluating whether this is the beginning of a more prolonged market pullback. Market technicians are citing a number of technical factors that may be a precursor to a more sustained market decline. One factor which has been getting a lot of attention is the declining number of stocks within, say the S&P 500 Index, trading above their 200 day moving average. Thomson Reuters' AlphaNow site published an article yesterday and written by ETF Guide, Is The Bull Market Weakening Or Gaining Strength? A chart included in the analysis was the one below that clearly shows a declining percentage of S&P 500 stocks trading above their 200 day moving average.

From The Blog of HORAN Capital Advisors

In the article, the author notes,
"The broader index may be making new all-time highs, but less and less of its components are. This means the market is being driven higher by fewer and fewer companies and solely by those companies with the biggest market caps that have the larger effects on the indices (emphasis added)."

However, instead of the larger capitalization stocks driving the market to new highs, it is the smaller cap stocks. The below chart shows the mega cap stocks (white line), the Russell 200 Index, and this index is actually underperforming the more comprehensive S&P 500 Index.

From The Blog of HORAN Capital Advisors

The next chart shows the S&P 600 Small Cap ETF compared to the S&P 500 Index. In this case as well, small caps are outperforming large cap stocks.

From The Blog of HORAN Capital Advisors

Further, the market strength has really been evident in the small cap stock space. Much is being written about the extended valuations in small cap stocks:
Ryan's article provides a detail review of future small cap returns when small cap stocks are trading at levels similar to today. At HORAN, we eliminated and/or reduced small cap exposure in our clients' accounts recently due to valuation concerns.

So getting back to the AlphaNow article question, Is the Bull Market Weakening? The issue of the declining number of stocks above their 200 day moving average is certainly an issue worth watching. However, as the below chart shows, last year the market generated returns in excess of 30% at a time when a smaller percentage of stocks in the S&P 500 Index were trading above their 200 day moving average.

From The Blog of HORAN Capital Advisors

Also, looking at a broader index like the NYSE Composite Index, the percentage of stocks trading above their 200 day moving average has been increasing this year. The NYSE Composite consists of 1,867 companies (1,518 of which are U.S. companies.) In actuality, maybe we are seeing a broader more global participation in this market advance.

From The Blog of HORAN Capital Advisors

From our firm's perspective, consolidation of market gains generated over the last year and a half would be constructive for another move higher for the market. The market has consistently stair-stepped its way higher since late 2012.

From The Blog of HORAN Capital Advisors

However, from a technical point of view 2014 could be a more "sell in May" type of year.

From The Blog of HORAN Capital Advisors

Over riding these technical issues will be company fundamentals. Weather has been the excuse of the day for poor earnings reports for a number of firms reporting over the last 60 to 90 days. Additionally, geopolitical events (Russia/Ukraine) are also influencing recent market actions. We will address more of these issues in our upcoming first quarter investor letter.


Sunday, March 09, 2014

Week Ahead Magazine: March 9, 2014

Monday marks the five year anniversary of the current bull market. The Wall Street Journal reported return facts on this bull market run on Saturday. Highlights from their report:
  • "The Dow Jones Industrial Average has soared 151% since stocks bottomed March 9, 2009, following the financial crisis. That ranks it fifth in gains among the 32 bull markets since 1900."
  • "It also is tied for fifth-longest-running, in trading days, with the one that ended in 2007, according to Ned Davis Research."
  • "If the current stock advance lasts another 16 trading days, it will be the fourth-longest, surpassing the one that ended in 1987."
  • "The Nasdaq Composite Index is up 242%, and the Russell 2000 small-stock index is up 251% in that time. A bull market is commonly defined as a gain of at least 20% from a market low."
This week's magazine contains a few articles that reference the bull market run since the end of the financlial crisis. Also, the magazine contains useful links to artiucles on topics for the coming week.


Thursday, March 06, 2014

Reallocating From Fixed To Equity Has More Room To Run

One factor that can serve as a tailwind to a positive equity market is investors repositioning their investment portfolios from a too much fixed income allocation into a larger equity allocation. Below are a few highlights from an article appearing in The Wall Street Journal after the market close yesterday:
  • Tuesday was the largest single-day outflow ever for BlackRock Inc.'s (BLK) iShare's fixed-income ETFs, a spokeswoman said.
  • Some $6.2 billion poured out of bond ETFs on Tuesday as investor concerns over Ukraine cooled, driving a global stock-market rally and a selloff in safe-haven bonds.
  • Tuesday's bond ETF withdrawal was equal to roughly 2.5% of the $240 billion bond ETF market, according to research and analysis firm ETF.com. In contrast, some $1.9 billion flowed into U.S. stock funds Tuesday, representing 0.2% of total assets.
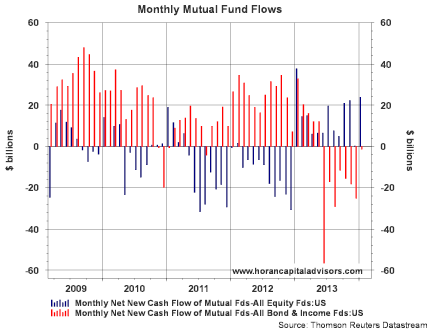
From a fund flow perspective, the blue bars in the below chart displays the rolling one year sum of fund flows into equity mutual funds versus the move in the S&P 500 Index. In spite of the strong positive return in the S&P 500 Index since the bottom of the financial crisis in 2008/2009, it appears investors are just now beginning to reallocate their investments into equity assets. The second chart below compares the monthly net fund flows between equity and fixed income investments. This chart also suggests the flows out of fixed income are just recently beginning to take place.

From The Blog of HORAN Capital Advisors

From The Blog of HORAN Capital Advisors


Tuesday, March 04, 2014

Dividend Payers Continue To Struggle In 2014

With the strong market rebound in February, the dividend payers in the S&P 500 Index have continued to lag their non-dividend counterparts. As the below table shows, the equal weighted return for the non-dividend payers outperformed the payers by 2.61 percentage points in February. On a year to date basis, two months, the non payers have outperformed the payers by a large 6.73 percentage points. With this large of an underperformance by the payers, it could an uphill battle for the payers to close this gap by year end.

From The Blog of HORAN Capital Advisors


Market's Reaction To Geopolitical Events

Seems logical to say today after the sharp snap-back in global equity markets; however, past crisis have generally provided investors with good buying opportunities versus selling. As we noted in our post over the weekend, the Ukraine crisis was/is likely to not have a long term negative impact on global market returns. Last September Sam Stovall of S&P Capital IQ issued a report highlighting prior geopolitical crisis' impact on the markets and the subsequent recovery period. The average days need to recover from the loss is 14 days. The below table highlights the "shock" events and impact on the market.

From The Blog of HORAN Capital Advisors

Source:

Shocks & Stocks
S&P Capital IQ
By: Sam Stovall, Chief Equity Strategist
September 3, 2013
http://us.spindices.com/documents/commentary/20130903-sector-watch-shocks-and-stocks.pdf

h/t: Wall Street Journal