Saturday, September 14, 2013

Is Middle America The New Emerging Market?

Consuelo Mack of WealthTrack recently conducted an interview with Nancy Lazar and François Trahan, both founders of the new macro strategy firm, Cornerstone Macro LP. Lazar and Trahan note in the interview that macro economic influences have an outsized impact on equity market returns. In this regard, they believe middle America is the new emerging market. In relation to this viewpoint, they both highlight factors that will be headwinds for emerging market economies over the next five years or so.

During the interview, Lazar and Trahan note the energy renaissance taking place in the U.S. will likely be a game changer for the U.S. economy over the course of the next 3-5 years. One statistic Nancy highlights is that for every one energy job created in the U.S., three additional jobs are created in other business segments. This job creation multiple will have a positive impact on consumer and industrial related stocks. Francois Trahan mentions where dividend stocks have been an important focus for investors through the end of 2012, during the next three to five years, dividends will be less impactful to equity returns. In looking at the year to date returns for the S&P 500 (yes, a short time period), dividends have accounted for about 10% of the returns generated by the S&P 500 Index. Trahan believes the market/economy is in a period similar to the 90's where dividends did not account for a large part of equity returns. Trahan believes the U.S. will enjoy a period of low inflation that will enable PE expansion to be a driving force for equity returns. The below video is a worthwhile one to view.


Thursday, September 12, 2013

Global Equity Sectors Appear Fairly Valued

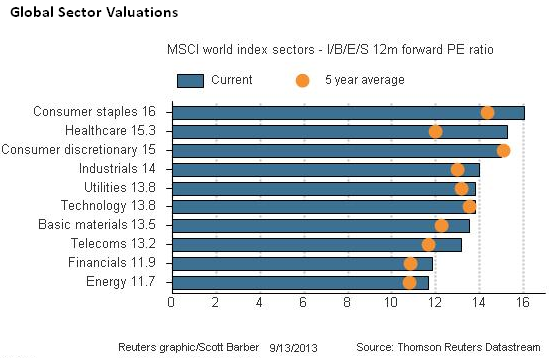
A recent report by Thomson Reuters' AlphaNow provides a chart review package covering current financial data often paired with current economic data. The report released for August, along with an updated chart  for September, shows all of the global equity market sectors within the MSCI World Index are trading at or above their 5-year average forward P/Es or multiples. The MSCI World Index is a free float-adjusted market capitalization weighted index that is designed to measure the equity market performance of developed markets.

From The Blog of HORAN Capital Advisors

A question that arises then is whether or not earnings growth can do better than the recent mid single digit growth rates reported so far this year. For the second quarter of this year earnings growth will come in at about 3.6%. According to Factset's Earnings Insight Report, expectations for the third quarter are earnings growth will increase to 6.5%. This increase in the growth rate would certainly be viewed positively by the equity market.

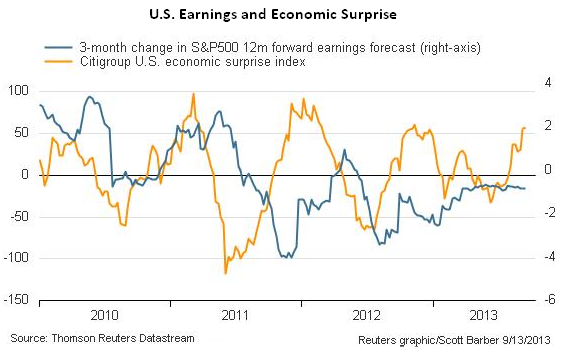
One positive data point is the Citigroup Economic Surprise Index which has been showing improvement. According to Bloomberg, this index is defined as:
"The Citigroup Economic Surprise Indices are objective and quantitative measures of economic news. They are defined as weighted historical standard deviations of data surprises (actual releases vs Bloomberg survey median). A positive reading of the Economic Surprise Index suggests that economic releases have on balance [been] beating consensus. The indices are calculated daily in a rolling three-month window. The weights of economic indicators are derived from relative high-frequency spot FX impacts of 1 standard deviation data surprises. The indices also employ a time decay function to replicate the limited memory of markets."
As the below chart notes, this index tends to be a leading indicator of a more robust earnings growth environment.

From The Blog of HORAN Capital Advisors

For investors looking at a potentially improving euro zone economy, the Surprise Index is also exhibiting strength. For investors looking to increase euro zone exposure they will want to at least be aware of the banking issues in France as outlined in the report, From Behind the Maginot Line.

From The Blog of HORAN Capital Advisors


A Jump In Bullish Investor Sentiment

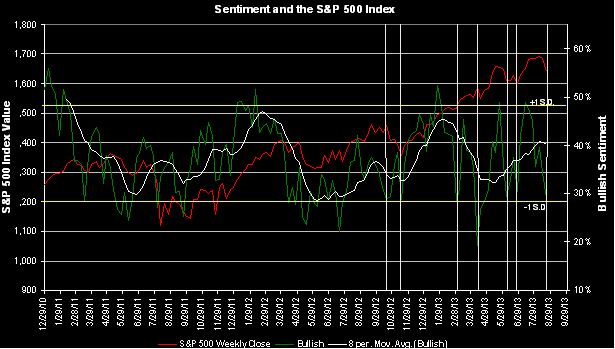
Investors seem to have a heightened focus on the short term market movements during this bull market advance that began in 2009. Nonetheless, I will perpetuate this line of thinking by detailing this week's investor sentiment figures released earlier today by the American Association of Individual Investors. For the week individual investor bullish sentiment rose nearly ten percentage points to 45.52% from the prior week's reading of 35.53%. A majority of the increase is attributable to the decline in bearish sentiment to 24.58% from 31.25%. This widened the bull/bear spread to 20.9% from 4.3% in the prior week.

From The Blog of HORAN Capital Advisors
Source: AAII

Sounding like a broken record, but there are events on the horizon that could trip up this market advance: the Syria issue, Fed tapering, the debt ceiling debate, just to name a few.

Interestingly, it seems money market pundits were focused on the historically poor returns that have been generated in the month of September. With nearly half the month past, the S&P 500 Index is up over 3% through the end of today. As we noted in an earlier post though, when August is a down month for the S&P 500 Index (down 2.9%), the odds favor (ever so slightly) that September will be an up month. With two weeks remaining, the bulls will have their work cut out for them in order for September to finish in positive territory.


Wednesday, September 11, 2013

Largest Semi Annual Increase In Home Prices On Record

This morning the Mortgage Bankers Association reported mortgage application activity fell 13.5% (includes purchase and refinance activity) for the week ending September 6th with the refinancing index declining 20.2%. The rapid spike in mortgage interest rates has certainly played a significant part in the slowdown in mortgage activity. One follow on questions is whether the improvement seen in real estate prices is sustainable in the face of these higher mortgage rates and the anticipated tapering by the Fed. A recent report from Chart of the Day highlights the sharp increase in median home prices as noted below:
"The US real estate market continues to surge. For some perspective, today's top chart illustrates the US median price (adjusted for inflation) of a single-family home over the past 43 years while today's bottom chart presents the semi-annual percent change in home prices (also adjusted for inflation). Today's chart illustrates that the inflation-adjusted median home price has rarely increased more than 10% in six months (gray shading). When inflation-adjusted home prices did increase more than 10% in six months, it was often soon followed by a period of stagnant or declining prices. It is worth noting that over the past six months, the median price for a single-family home has shot up at the fastest pace on record."
From The Blog of HORAN Capital Advisors


Monday, September 09, 2013

S&P 500 Index Reclaims 50 Day Moving Average

As we wrote in a post one week ago it appeared the selling pressure on the S&P 500 Index was waning. We cited the different levels of the Money Flow Index (MFI) and the Relative Strength Index (RSI) this year versus this same time last year. In another post we cited the importance the market has attributed to the 100 day moving average. In fact, the positive market action so far this September began with the bulls successfully defending this 100 day M.A. support level last week.

With many investors having returned from summer vacation, today saw a strong bounce in the market, some of this driven by perceived positive developments on the situation in Syria. The bounce today places the market index close just above the 50 day moving average of 1,666 and above the August 26th intraday high of 1,669. These technical levels are important in today's market environment due to the increased influence of algorithmic trading activity. Additionally, the MACD has been positive for two trading days along with improved measures for the RSI and the MFI. Certainly more technical improvement needs to occur to repair the damage incurred in August.

From The Blog of HORAN Capital Advisors

A number of events are on the horizon that could derail the positive action that has occurred so far in September, such as, the situation on Syria, the federal government's debt ceiling issue, Fed tapering and the elections in Germany on September 22, just to name a few. Economic and company fundamentals will ultimately play a crucial role in sustaining the market's advance. For now though, we have passed the peak 2Q earnings season with technical factors playing a key role in the market's direction for the balance of September.


Sunday, September 08, 2013

The Week Ahead Magazine: The Week of September 8, 2013

Over the course of the past four weeks or so, we have provided links for our readers they may find of interest for the upcoming week. This week we are placing the links in a magazine format which can be accessed via the below link. From a quick look back at this past week, bullish investors appeared to take back control of the equity market with the S&P 500 Index up1.36%. The news flow this week will likely center around political events in Washington with the top topic being Syria. Good luck investing in the coming week and enjoy the magazine below.


Saturday, September 07, 2013

Dividend Payers Outperforming the S&P 500 Index But Not The Equal Weighted Non Payers

On a capitalization weighted basis the dividend payers in the S&P 500 Index have done a respectable job of outperforming the broader S&P 500 Index as noted in the below table. However, when one looks at the performance of the payers versus the non payers on an equal weighted basis, the payers have lagged the non payers by a significant margin. On an equal weighted basis the non payers have generated a return of  24.11% while the payers have returned 17.92%.

From The Blog of HORAN Capital Advisors

This return difference is attributable to the fact the smaller cap stocks within the index have outperformed the larger cap stocks. Investors can see the return difference by comparing the Guggenheim S&P 500 Equal Weighted Index (RSP) to the cap weighted S&P 500 ($SPX) detailed in the below charts.

From The Blog of HORAN Capital Advisors

From The Blog of HORAN Capital Advisors

The below chart shows the recent outperformance of small cap stocks (Russell 2000 Index) relative to the larger cap S&P 500 Index.

From The Blog of HORAN Capital Advisors

One important question for investors that are underweighted in small cap equities, is now the time to really increase their allocation to small caps. At our firm within our U.S. equity strategy, we currently are overweight in large cap relative to small cap. Directionally, as we noted in last quarter's Investor Letter, we have begun to increase our exposure to international developed equities on the margin.


Thursday, September 05, 2013

September Market Return Is Favorable When August Return Is Negative

Although investing in stocks is a long term endeavor the following post will provide some insight into returns during the month of September. I am sure as soon as I upload this post to our blog site, any conclusions that are drawn below will prove to be false. Nonetheless, over the course of the past few weeks strategists have been expounding on the fact the month of September has proved to be the worst month for stocks during the course of a year. The recent chart release from the Chart of the Day charting service provided the below commentary and graphic with their report today.
"The stock market has struggled over the past month. Investors are concerned. For some perspective, today's chart presents the Dow's average performance for each calendar month since 1950. As today's chart illustrates, it is not unusual for the stock market to underperform during the May to October time frame with a brief counter-trend rally occurring in July. It is worth noting that the worst calendar month for stock market performance (i.e. September) has just begun."
From The Blog of HORAN Capital Advisors

I took a quick look at the monthly returns for the S&P 500 Index going back to 1950 (62 data points). The data, supplied by Commodity Systems Inc., was downloaded from YahooFinance. The data used the opening index price for the month being analyzed. The ending results showed:
  • The S&P 500 Index delivered negative returns in 35 out of 62 Septembers. In other words, 56% of  the returns in September were negative.
  • The overall average price only return for all Septembers was negative .71%.
  • The August return was negative 27 out of 62 observations or 44% of the time.
  • When August returns were negative, like experienced this year, the return in 14 of the months of September, or 52%, were positive. In other words, a negative August would indicate September is more likely to have a positive return.
  • The average positive return for September when August was negative (13 data points) was 3.87%.
A link to some of the data used in the analysis can be found here.

For investors focused on September returns, it appears slightly more than half the months of September have generated negative returns. Further though, when August returns are negative, like experienced in 2013, the average return for the month of September is a positive 3.87%.

Certainly there are potential political and economic headwinds on the horizon that could trip up the market. However, market timing is a difficult endeavor and focusing more on company fundamentals will likely be more beneficial than focusing on the so called September effect.


Tuesday, September 03, 2013

S&P 500 Index Less Overbought This September Versus Last September

As noted in the below chart of the S&P 500 Index, the market technicals for the S&P are less stretched this year versus the same time last year. Last year the S&P 500 moved higher by 2.0% in August and an additional 2.4% in September all prior to the election, the fiscal cliff and sequestration. Fast forward to August this year and we have seen the market pullback 4.5% in August. At the same time some technical market measures that indicated an overbought setup last year now indicate an oversold position for the market as we begin trading in September. In the below chart, the Relative Strength Index and the Money Flow Index, a couple of technical indicators, are at levels indicative of a situation where selling pressure could subside as we move into the last four trading months of the year. Certainly external shocks can upset the market, Syria is top of mind in addition to a few other market moving news events, however, the market is in a different technical place this year than at the same time last year. The last word of caution is respect the trend.

From The Blog of HORAN Capital Advisors


Monday, September 02, 2013

Employment Snapshot In The U.S.

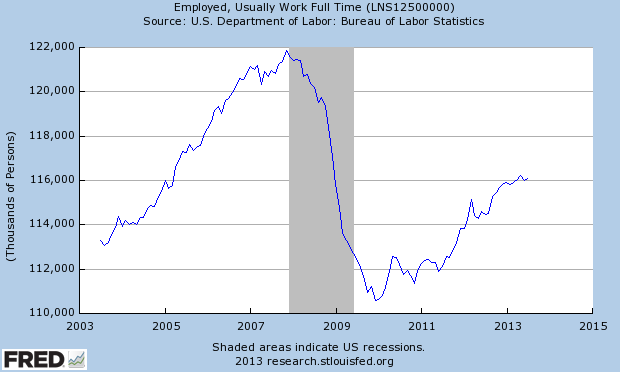
Today the St. Louis Fed tweeted several charts that provide a snapshot of employment in the U.S. As background the St. Louis Fed provides a database called FRED that contains a comprehensive archive of economic and financial information. Below are three of the charts highlighted by the St. Louis Fed this afternoon. I believe they all speak for themselves.
  • Chart shows the labor force participation rate (employed + unemployed but looking for a job) since 1960.
From The Blog of HORAN Capital Advisors
  • The trend in the number of people who usually work full time.
From The Blog of HORAN Capital Advisors
  • The trend in the number of people who usually work part time.
From The Blog of HORAN Capital Advisors


Sunday, September 01, 2013

Allocation Between Stocks, Bonds and Cash: The Week Ahead For September 1, 2013

Since early May the yield on the 10-year Treasury has increased from 1.61% to 2.74% at the end of August. This rise in rates has taken a toll on investments that are sensitive to changes in market interest rates. The below links provide some insight into managing ones portfolio during a market cycle where the trend in interest rates is higher.
  • Money market funds witnessed net inflows to the tune of $5.5 billion last week (AlphaNow)
  • Rising interest rates and increased volatility for bond investors (Schwab)
  • Focus on dividend growers when interest rates rise (Fidelity)
  • Strategies for navigating a higher interest rate environment (Natixis)
  • Asset allocation in a rising interest rate environment (CFA Institute)
  • Elevated spending in first year of retirement (Reuters)


Sunday, August 25, 2013

Market Technicals Improving

The last few trading days have seen the market technicals improve. The S&P 500 Index has, at least temporarily, successfully bounced off of its 100 day moving average. This bounce has occurred at a level that has been important during this bull market run. The RSI and the Money Flow Index have both turned higher from depressed levels as well. The importance of the MFI was discussed in a post we wrote in mid May, A Tired Bull Market. Additionally, the On Balance Volume Indicator has bounced off support. It is the trend of the OBV Indicator that is important.

From The Blog of HORAN Capital Advisors

A couple of recent articles have noted the strong negative market sentiment, here and here, and sentiment indicators are contrarian measures, so may be the market is due for a recovery going into the end of the year. Certainly, there are some headwinds that need to be overcome, i.e., the debt ceiling debate in the U.S., the elections in Germany in September and the Fed's taper timing. Nonetheless, selling pressure may have eased in the near term.


A Shift In Sentiment And An Improving Europe: The Week Ahead For August 25, 2013

Investors seem on edge as the equity market continues to digest gains achieved so far this year. The recent market weakness seems to have investors on edge with some of the below article links noting this shift in investor sentiment. This type of indicator tends to be a contrarian one. Economic climates outside the U.S. seem to be stabilizing if not improving, specifically in Europe and the U.K.
  • Pick-up In Euro Area Growth Is Good News, But... (AlphaNow)
  • Flash PMI Reports across Europe to confirm eurozone economic recovery is real (Business Insider)
  • Avoiding danger is no safer in the long run than outright exposure.  The fearful are caught as often as the bold.—Helen Keller (Systematic Relative Strength)
Patience May Well Win the Retirement Race.


Thursday, August 22, 2013

Individual Investors Turn Bearish

Before today the S&P 500 Index has decline nearly 4% (still up over 15 % year to date) and individual investors have turned bearish on the market. Today, the American Association of Individual Investors reported individual investor bullish sentiment declined to 29.0 this week from 34.5% in the prior week. This is the lowest level since the last week of April when bearish sentiment was reported at 28.3%. Since April the S&P 500 Index is up 4.1% on a price only basis. As the below chart shows, the bearish sentiment level is one standard deviation below the indicator's long term average. Individual investor sentiment indicators tend to be a contrarian signals.

From The Blog of HORAN Capital Advisors


Sunday, August 18, 2013

Who Let The Bears Out? Articles For The Week Ahead, August 18, 2013

It has been some time since I have seen so many market strategist laser focused on the fact the market has topped out and appears to be rolling over. It isn't a frequent occurrence when strategist make perfect market timing calls. Certainly there is a great deal to worry about as we move into the second half of August and then the notoriously poor market months of September and October. Jackson Hole is this week, Fed tapering remains on the table, approaching elections in Germany in September, the need for Congress to deal with the debt ceiling all of which are enough to knock the life out of the bulls. Of concern to many, and rightfully so, is the fact this market seems to have moved higher unabated since the end of the financial crisis. Below are a few of the articles we have reviewed in advance of the coming week.

  • "Risk free" rate does not mean you won't lose money in your Treasury portfolio. (Business Insider)
    • China's air pollution deterring tourists and businesses. (Forbes
    • Euro area economic data continues to improve (stabilize). (AlphaNow)


        Saturday, August 17, 2013

        S&P 500 Earnings Above Or Below Trend?

        One market factor frequently mentioned regarding current S&P 500 earnings is they are far above historical trend. An example is from a recent article on the Zero Hedge website titled, Why Stock Prices Are More Stretched Than You Think: A Tale Of 3 P/E Multiples. A common discussion then leads to commentary that earnings will revert to their trend and in this discussion that means a decline in earnings. The earnings chart referenced in this commentary is the one below (updated 8/18/2013). As can be seen in the below chart earnings are above their long term [exponential] trend line. However, the below chart [is using an arithmetic scale on the y-axis] does not properly account for the percentage change in earnings. The Zero Hedge author's technical notes can be found here.
        From The Blog of HORAN Capital Advisors

        As can be seen in this next chart that displays earnings using a logarithmic scale, earnings are actually below their long term trend line. With a logarithmic scale [on the y-axis], the distance on the chart from $10 to $20 is the same as $100 to $200. The percentage move in both cases is the same and if one is looking at earnings growth, using a logarithmic scale is important.

        From The Blog of HORAN Capital Advisors

        Nearing the end of Q2 earnings reporting season, we would like to see a higher rate of growth in company earnings. However, Q2 earnings are expected to increase 4.7% for the quarter and this is higher than the 2.9% expected prior to the Q2 earnings season. Additionally, Thomson Reuters reports 67% of companies beat earnings expectations which is higher than the long term average of 63%. From a revenue perspective, 53% beat revenue expectations, below the 61% long term average, but higher than the 48% average over the past four quarters.

        For investors then, when evaluating charts, pay attention to the scale being utilized in the chart graphic.


        Insight Into The Rise In Company Cash Levels

        In a research report earlier this year, the Federal Reserve Bank of St. Louis provides some insight into why companies continue to hold higher levels of cash. The increasing cash level trend has been underway for over thirty years so the higher cash trend likely is not simply due to economic uncertainty. The research report looks at both absolute cash levels as well as cash as a percentage of corporate assets. This cash level issue is important for investors as cash is essentially an asset that generates little if no return in the short run for a company and hence its investors: especially in light of the current low interest rate environment.

        From The Blog of HORAN Capital Advisors

        From The Blog of HORAN Capital Advisors

        Several factors are cited in the report that provides insight into a company's desire to hold higher cash. One factor cited is the change in the composition of companies, i. e., today companies are more focused on research and development (R&D). This transition has occurred through the growth in the information technology and the pharmaceutical/medical device industries. These industries rely heavily on R&D in order to develop new products.

        The other factor driving corporations to desire holding more cash is a policy one. This policy issues relates to the differing tax regimes pursued by countries around the world. For U.S. companies, the additional taxes owed on repatriated earnings leads company managements to leave cash in lower taxed countries. The research report provides detail around this issue.

        As noted below in a portion of the report's conclusion, the undesirable impact of tax policies could be constraining the growth potential of the U.S. economy.
        There is a structural factor, the increasing importance of multinational corporations, that seems to be important because of the current taxation of the income generated abroad that domestic corporations bring back to the U.S. Here, fiscal policy may be playing an undesirable role, and its modification in the coming years could boost domestic investment and help overcome the slow recovery from the Great Recession.

        There is also another role for fiscal policymakers in the near future. Although the magnitude of the effect is not clear, it seems that designing and communicating a long-run plan to deal with the increasing fiscal deficit would reduce uncertainty about future taxes, reduce abnormal cash holdings and potentially favor private investment.

        Source:

        Why Are Corporations Holding So Much Cash?
        Federal Reserve Bank of St. Louis
        By: Juan M. Sánchez and Emircan Yurdagul
        January 2013
        http://www.stlouisfed.org/publications/re/articles/?id=2314


        Thursday, August 15, 2013

        A Look At The Market's Technicals

        What follows are a few thoughts on some of the technical factors influencing the market advance since the financial crisis. A couple of the factors, the Fed's involvement via quantitative easing and the increase in algorithmic trading, seem to be having a larger influence on the market of late. Institutional investors/traders have a heighten interest in the Fed's open market operations as the Fed activity does seem to influence the equity market's direction. Investors/traders seem to be focused on the Fed's monetary operations and follow this activity via the Fed's open market schedule. The Fed forecasts its activity via its open market schedule that is published at the beginning of each month. For August the schedule indicates the Fed has large Treasury purchases scheduled for Thursday and Friday of this week--not surprising since it is an option expiration week.

        In addition to Fed activity, technical chart pattern setups have been influencing the market as well. Institutional investors, and more specifically technical traders, are following chart pattern setups that trigger their trading activity. Beyond chart pattern setups, algorithmic trading programs are capable of trading on news flow such as Twitter tweets. A recent example is Carl Icahn's tweet that he accumulated a position in Apple's (AAPL) common stock and the resulting rise in Apple's stock price.

        The market pullback over the last two weeks, although small in relation to the market's year to date advance, has triggerred a head and shoulders bearish pattern setup that began its formation in July as evidenced by the below chart from The Kirk Report. This technical setup shows a downside target for the S&P 500 Index at 1,650. The chart is an example of the type of information traders are following that influences their trading activity.

        From The Blog of HORAN Capital Advisors

        Additionally, the S&P 500 Index close of 1,661 on Thursday is just above the index's 50 day moving average of 1,656. The 50 day moving average price and the bearish S&P head and shoulders target of 1,650 will be important levels in the trading days ahead. As we have noted in prior posts, the money flow index is one indicator that can identify reversals in momentum. As the below chart notes, the MFI has turned higher.

        From The Blog of HORAN Capital Advisors

        The recent market pullback has occurred on lower volume as detailed in the above chart. This is not atypical for trading activity in the summer as vacations seem to be the focus for traders. Additionally, some of the overbought market conditions have been reduced when one looks at the percentage of stocks trading above their 50 and 150 day moving averages.

        From The Blog of HORAN Capital Advisors

        Somewhat surprising during this market decline is the VIX continues to trade below 15. The website VIX and More recently published an article showing the market corrections since 2009. In all of the declines noted in the article, the VIX rose above 18 at least once.

        From The Blog of HORAN Capital Advisors

        A couple of events on the horizon that could perpetuate the decline then,


        Tuesday, August 13, 2013

        The Wall Of Worry

        L.A. Little of the Technical Analysis Today website provided the below summation of the state of the market at the end of today under his Trade Chatter column. Little's conclusion is more uncertainty is likely to increase market volatility in the weeks ahead.
        "The market always worries - or shall we say the traders and investors that comprise the market always worry. Worry, worry, worry - if you have money on the line then worry becomes part of your DNA.

        This morning retail sales print stronger than expected and immediately the worry is the Fed will pull QE in September or at least start shutting down the program. Let's worry shall we.

        I don't mean to sound nonchalant about the possibilities but Wall Street (read investors and traders) do not like anything that resembles uncertainty and with everyone of the belief that quantitative easing is the only reason this market is at these highs, well you can understand the reason for worry.

        I can remember a time not so long ago where "bad news" was good as was" good news". It almost feels as if we are shifting to "good news" is bad as is "bad news". The glass is half empty - not half full.

        The next few weeks look to be challenging as the uncertainty is set to grow - not diminish. Elections in Germany, QE going away, budget battles looming, etc. You can see the uncertainties growing and that is likely to bring volatility and pressure on these markets. That pressure is actually needed for it will lead to tests that let us measure and measurement is how we determine what is next."

        H/T: The Kirk Report


        Sunday, August 11, 2013

        Readings For the Week Ahead: August 11, 2013

        Starting this weekend, on Sunday, we will attempt to provide links to a few articles we read last week and article links we believe our readers might find of interest for the week ahead. Below are the links for our initial list.

        • Investors maintained their fascination with equity funds, but also added to bond funds. (AlphaNow)
        • Acquirers want in on Europe's cellphone operators. (Dealbook)
        • Evaluating an immediate annuity. (Kiplinger)
        • Apple (AAPL) expected to unveil next iPhone at September 10th event. (AllThingsD)
        • 51% of the Fed's QE reserves have ended up in foreign banks. (Zero Hedge)
        • 12% of the unemployed are teenagers. (WSJ)


        Sunday, August 04, 2013

        Pension Underfunding Increases

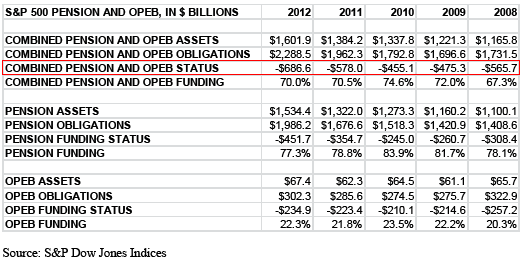
        In spite of strong equity market returns over the last four years, company pension fund underfunding continues to increase. For the year ending 2012, the underfunding amount increased to a record level of $687 billion. S&P Dow Jones Indices reports,
        "...the amount of assets that S&P 500 companies set aside to fund pensions and OPEB amounted to $1.60 trillion in 2012, covering $2.29 trillion in obligations with the resulting underfunding equating to $687 billion, or a 70.0% overall funding rate."
        From The Blog of HORAN Capital Advisors

        From The Blog of HORAN Capital Advisors

        Howard Silverblatt of S&P notes in the report that younger workers will need to take more responsibility in saving for their own retirement as companies have shifted more of the retirement funding burden to employees. Beginning to save early is critical in order for younger workers to take advantage of the power of compounding.

        Source:

        S&P 500 Companies Post Record Level of Pension Underfunding
        S&P Dow Jones Indices
        By: Howard Silverblatt, Senior Index Analyst
        July 31, 2013


        Wednesday, July 31, 2013

        Equity Valuation by Country

        Thomson Reuters (TRI) prepared  a chart that displays the equity valuation by country. Most country equity valuations are trading at their 10-year average valuation or lower. However, a few countries like Mexico, Sweden and Switzerland are trading at levels above their respective 10-year valuations.

        From The Blog of HORAN Capital Advisors

        Disclosure: Our firm holds a long position in TRI


        Sunday, July 28, 2013

        Mutual Fund Cash Levels Are Increasing

        In my earlier post this week I noted investor money market assets as a percentage of all mutual fund assets were at a low level on a historical basis. If investor cash levels are at a low level, then where will the funds come from to propel equities to higher levels?

        Interestingly, as the below charts indicate, various types of mutual funds have seen their cash levels increase. Either the cash is coming into mutual funds at a faster pace than fund managers can get it invested or fund managers are making a conscious decision to hold higher levels of cash. At the end of the day fund managers are evaluated on how their fund's performance compares with other funds and the fund's stated benchmark. As a result, it is likely this cash will find its way into investment assets other than cash. Although individual investors may have lower cash levels, it does appear, from a technical perspective, mutual fund cash levels are such that deployment of the cash can push equity prices higher. At a minimum, this cash may act as support for equities in the near term.

        From The Blog of HORAN Capital Advisors

        From The Blog of HORAN Capital Advisors

        The coming week is loaded with potential market moving data.
        • Consumer Confidence on Tuesday
        • GDP reported Tuesday
        • Chicago PMI on Wednesday
        • FOMC interest rate decision on Wednesday. Additionally, the ECB and Bank of England are meeting as well.
        • Jobless claims reported on Thursday
        • ISM Manufacturing PMI on Thursday
        • A lot of earnings reports too. During the week of July 29th,  131 S&P 500 companies are expected to report earnings.


        Wednesday, July 24, 2013

        Investors Running Out Of Cash Available For Investments

        With investors being paid virtually zero percent interest on money market cash for what seems an eternity, data suggests investors are buying almost any investment asset. Broadly speaking, all the talk has been how poorly emerging market investments have performed over the past few years. At HORAN Capital Advisors we even discuss the weak emerging market performance in our just released Investor Letter. Looking at fund flows though, the all equity, all bond and emerging markets mutual funds have been the beneficiaries of fund inflows this year.

        From The Blog of HORAN Capital Advisors

        The question often arises about mutual fund flow data not being comprehensive enough given the popularity of exchange traded products. Below are a couple of links to recent comments from Lipper about ETF flows.
        The strong buying interest exhibited by investors during this bull market run since the end of the recession in 2009 is confirmed by the declining percentage of cash assets in money market mutual funds dividend by equity mutual fund assets. This declining trend is detailed in the below chart.

        From The Blog of HORAN Capital Advisors

        Investment Company Institute flow data also confirms flows out of money market mutual funds.

        From The Blog of HORAN Capital Advisors

        A curious question then is where will the additional investment dollars come from that can find away into equity investments? Avondale Asset Management posted a summary of the conference call notes from TD Ameritrade (AMTD). During the call TD Ameritrade mentions a number of details about the individual investor, one of which is the firm is seeing the start of a "mini" rotation out of bonds. Maybe this will be that source of cash that supports higher equity prices. On the other hand, the equity market does seem in need of rest, if only a brief one so one maybe does not need to be in a rush at the moment.

        Disclosure: No position in AMTD


        Tuesday, July 23, 2013

        Investor Letter: Thoughts On The Second Half

        Our firm's Second Quarter 2013 Investor Letter provides a review for the first half of the year. In our Letter we discuss our current investment position, as well as recent changes to our client portfolios. Our recent investment biases have served our clients well. Strategically we have favored U.S. equities and shorter maturity bonds while at the same time avoiding gold (broad commodities for that matter), preferred stocks and long-term bonds. The table below details the returns for various asset classes as of June 30, 2013.

        Our contention for some time has been U.S. equities looked favorable relative to other equity investments due to valuation, strong balance sheets and the largest stimulus program in U.S. history. Our overweight bias in U.S. equities and underweight in foreign equity has been rewarded with significant outperformance of U.S. stocks over multiple time periods as illustrated above.

        The complete Letter can be accessed directly from our website at this link: 2nd Quarter Investor Letter.

        From The Blog of HORAN Capital Advisors


        Friday, July 19, 2013

        Warren Buffett On The Markets

        In the below video Warren Buffett provides his take on stocks and the market. A couple of key points he mentions are:

        • A stock doesn't know you own it, and
        • Ones feeling about the market is not reciprocated by the market.


        H/T: Abnormal Returns


        Dow Rally Following Prior Market Contractions

        The Chart of the Day charting service's recent report on Dow rallies following market declines of at least 30% shows the current rally is below average in both magnitude and duration. The report notes,
        "The Dow just made another post-financial crisis rally high. To provide some further perspective to the current Dow rally, all major market rallies of the last 112 years are plotted on today's chart. Each dot represents a major stock market rally as measured by the Dow with the majority of rallies referred to by a label which states the year in which the rally began. For today's chart, a rally is being defined as an advance that follows a 30% decline (i.e. a major bear market). As today's chart illustrates, the Dow has begun a major rally 13 times over the past 112 years which equates to an average of one rally every 8.6 years. It is also interesting to note that the duration and magnitude of each rally correlated fairly well with the linear regression line (gray upward sloping line). As it stands right now, the current Dow rally that began in March 2009 (blue dot labeled you are here) would be classified as well below average in both duration and magnitude. However, when compared to the most recent post-major bear market rally (i.e. the rally that began in 2002), the current rally is significantly greater in magnitude and accomplished this feat in less time."

        From The Blog of HORAN Capital Advisors


        Thursday, July 18, 2013

        Foreign Sales Increase For S&P 500 Companies

        S&P Dow Jones Indices recently reported foreign sales data for S&P 500 companies for 2012. In the report, S&P 500 Foreign Sales Edge Up, it is noted there is some difficulty in obtaining foreign sales data since companies are not required to provide a breakdown when providing financial reports. Nonetheless, S&P explains the procedure used in reporting the information. In the final analysis the data shows foreign sales increased to 46.6% in 2012 versus 46.1% in 2011. Some highlights of the foreign sales breakdown are as follows:
        • In 2012, European sales represented 9.2% of all S&P 500 sales, down from 11.1% in 2011 and 13.5% in 2010.
        • The U.K. represented 1.7%, down from 2.4% in 2011, which had risen from 1.4% in 2010. The result is that European ex-U.K. sales represented 7.5% of all S&P 500 sales in 2012, down from 8.7% in 2011 and 12.0% in 2010.
        • Asian sales increased to 7.7% from 7.2% in 2011 and 6.1% in 2010.
        • Canadian sales continued to be volatile, even as Canada boasted a larger portion of sales than any other single country. Accounting for 4.0% of S&P 500 sales, Canadian sales are down from 4.3% in 2011, but up from 1.9% in 2010.
        • Information technology continued to be the most successful (and exposed) sector in terms of foreign sales. In 2012, 58.6% of its declared sales were foreign.
        The breakdown by sector is displayed in the below table.

        From The Blog of HORAN Capital Advisors

        Given the large percentage of foreign sales by S&P 500 companies, investor should be mindful of the impact of currency exchange rates as the foreign sales are converted back to the U.S. Dollar. The country with the largest portion of foreign sales is Canada at 4.0%. Regionally, Europe accounts for 9.19%, Asia 7.66%, North America 4.73% and Africa 3.71%.

        Source:

        S&P 500® Foreign Sales Edge Up (page 15)
        S&P Dow Jones Indices Insight Newsletter
        By: Howard Silverblatt
        Summer 2013
        http://us.spindices.com/documents/education/insights-newsletter-201307.pdf?force_download=true


        Wednesday, July 17, 2013

        Dividend Payers Underperforming Non-Payers For First Six Months Of The Year

        It seems much of the focus around the stock market this year has centered around investors chasing the dividend paying stocks. The theme of the discussion has been bond investors have been buying "bond like" stocks in an attempt to enhance the yield on their investments. The thinking has been bond yields are so low, one can buy dividend paying stocks with higher yields than a bond of the same company.

        The downside to this investment approach is equities are more volatile than bonds. The other downside is dividend paying stocks have underperformed the non payers for the first six months of the year through June 30th. Some of the higher yielding stocks in the S&P 500 Index fall into the materials (metals and coal), utility and telecumminucations sectors of the market and these stocks have been weak performers year to date. As the below chart from S&P Dow Jones Indices shows, the average return of the non payers has exceeded the payers for the time periods listed below during the past twelve months.

        From The Blog of HORAN Capital Advisors

        A list of the company yields and returns can be found at this link: Return and Yield File.

        In spite of the payers underperformance, investors in dividend paying stocks have enjoyed nice growth in the income generated through the growth in a company's dividend. Howard Silverblatt, Senior Index Analyst at S&P Dow Jones Indices, noted recently of the approximately 10,000 U.S. traded issues,
        “Dividends continued to increase in the second quarter with actual cash payments increasing 15.5% and the forward indicated dividend setting another all-time high. Payout rates, which historically average 52%, continue to remain near their lows at 36%. At this point, year-to-date dividend payments are up 13.9%, with 2013 easily expected to surpass the 2012 record dividend payment.”


        Saturday, July 13, 2013

        End Of Low Interest Rate Environment: Where To Invest

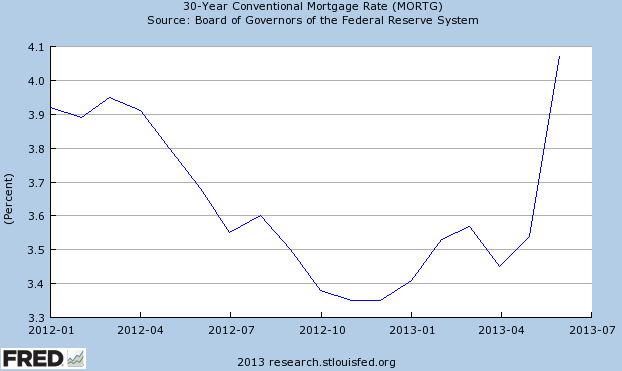
        The recent market focus has been centered on Ben Bernanke's comment that the end is near for a very accommodating Federal Reserve, i.e., quantitative easing (QE) tapering is near. The market's reaction was one where the 10-year Treasury rate shot higher (prices declined) as evidenced in the below chart. This rise in rates also influenced mortgage rates as detailed in the second chart below.

        From The Blog of HORAN Capital Advisors

        From The Blog of HORAN Capital Advisors

        Consuelo Mack of WealthTrack noted prior to her interview (link below) with Richard Bernstein and Dan Fuss that investors pulled $60 billion out of bond mutual funds. As a point of reference, in the four years (2009 - 2012) investors poured $1.1 trillion into the fixed income or bond asset class. Trim Tabs reports investors are now putting these funds into stock or equity funds. As an aside Trim Tabs notes historically the individual investor has been extraordinarily bad at market timing.

        In Consuelo Mack's recent interview with Richard Bernstein, a top-ranked strategist, turned portfolio manager, and Dan Fuss, a Loomis Sayles’ bond fund manager, both provide their contrarian views as to whether the 30-plus years of falling interest rates may be winding down. Bernstein favors the US domestic equity market and particularly mid-cycle companies. Mid cycle firms tend to be industrials, manufacturing, some technology companies and some financials. They are not commodity and energy related companies.

        As it relates to manufacturing in the U.S., WealthTrack has provided a report prepared by Nancy Lazar's new firm, Cornerstone Macro. Lazar was a co-founder of her former firm, the highly rated ISI Group, one of the top economic/strategy firms on Wall Street. This new report notes that Cornerstone's favorite emerging market is Middle America. Cornerstone believes a decoupling is taking place between the US and emerging market economies due to competitive labor cost in the US and favorable energy costs in the US.


        Monday, July 08, 2013

        Equal Weighted S&P 500 Outperforming Cap Weighted S&P 500 Index

        The equal weighted S&P 500 Index ETF, RSP, continues to outperform the capitalization weighted S&P 500 Index on a year to date basis. The equal weighted index maintains a higher weighting in the smaller cap companies in the S&P 500 Index and small cap stocks (IWM) have been outperforming the larger cap issues this year.

        A part of this outperformance may be attributable to the fact small cap companies have less exposure to the international markets, both developing and emerging. Developed and emerging markets have been weaker performers this year as the economic growth rates in emerging markets is slowing. Developed market economies are dealing with the ongoing effects of eurozone issues.

        From The Blog of HORAN Capital Advisors


        Sunday, July 07, 2013

        Women And Investing

        Consuelo Mack of WealthTrack recently aired two interview segments that focused on women and their investing and retirement needs. American women control $8 trillion in assets and this figure is expected to grow to $22 trillion by the end of the decade. Yet the traditional wealth management approach doesn’t necessarily work for women’s needs. In the first video Consuelo Mack's guests, Morgan Stanley’s Ami Forte, and GenSpring’s Senior Strategist, Jewelle Bickford, discuss how women can start taking ownership of their financial power.

        Importantly, only 1 in 5 women have determined how much money they will need in order to maintain their lifestyle in retirement. From a longevity perspective, on average women will live 5 years longer than a man. Today, 75% of the population age 85 years old or over is comprised of women.

        In the second video below (Part II), Consuelo Mack notes, "Women worry about becoming bag ladies in their old age and men focus too much on performance numbers, which isn’t always the best way to plan for the future."  Her guests are Mary Beth Franklin, a contributing editor for InvestmentNews as well as an expert on social security, and Erin Botsford, founder and CEO of the Botsford Group, where they explain why women are so different from men in their approach in planning for the so-called “Golden Years”.


        In the first video the guests note investments today are more than simply allocating ones investment funds between stocks, bonds and cash. At HORAN our investment approach incorporates other asset classes as well. Our alternative allocation is an effort to enhance a client's investment returns without taking the same level of risk as equities, but generate a return better than fixed income or bonds. As Ami Forte notes in the first video, bonds were traditionally known as safe asset class, however, the recent rise in interest rates has exposed just how risky the bond asset class can be.


        Friday, July 05, 2013

        Elevated Number Of Part Time Workers

        Today's release of the non-farm payroll report noted one troubling aspect of this recovery following the recession that ending mid year 2009. The job market strength during this recovery seems more centered in part time employment.

        From The Blog of HORAN Capital Advisors

        From The Blog of HORAN Capital Advisors

        There are a number of reason for why this might be the case, but the impact on economic growth is not generally positive. Part time workers are less likely to feel secure in their jobs so may limit their personal expenditures. And with consumers accounting for nearly 70% of economic growth (GDP), this tighter reign on spending is likely keeping the economy from growing at a potentially higher rate that is more typical following recessionary periods. Additionally, this low rate of employment growth has kept the job market from recovering to levels reached prior to the beginning of the recession as noted in this chart from the Calculated Risk website.