Saturday, July 23, 2011

Debt Ceiling Alone Is Not The Only Issue

Raising the debt ceiling itself is not the issue facing Congress and the U.S. government. As the below chart shows, Washington seems to do a good job issuing new debt up to the maximum limit each time the debt ceiling is increased.

From The Blog of HORAN Capital Advisors

The result of Congress' propensity to spend is the government's budgeted expenses now far outpace incoming revenues. In fact, the government now borrows 40 cents of every dollar it spends as noted in the below chart.

From The Blog of HORAN Capital Advisors

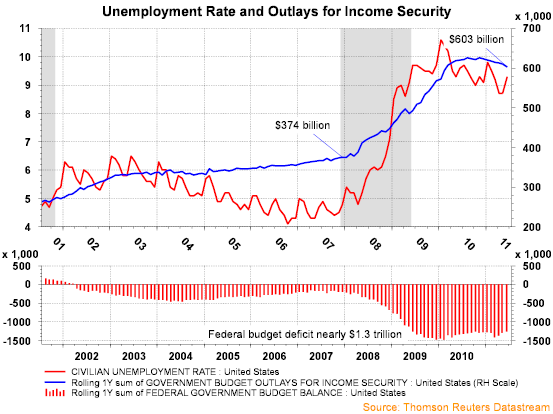
The stickiness of the unemployment rate is contributing to this gap in expenses versus revenue. The below chart shows the "income security" spending component of the government's budget has nearly doubled to $603 billion from $374 billion since the beginning of 2008. This increase in the "income security" portion of the budget is highly correlated with the unemployment rate. The "income security category" includes unemployment compensation, housing and food assistance.
From The Blog of HORAN Capital Advisors

Not many CEOs have commented on the impact Washington's policies are having on business decisions, primarily the desire by businesses to increase employment. However, during a recent Wynn Resorts investor meeting, Steve Wynn, CEO of Wynn Resorts (WYNN), noted the difficulty businesses are having navigating the new policies and regulations coming out of Washington. The audio of a portion of that meeting can be heard at this link: Wynn Investor Meeting audio.

From The Blog of HORAN Capital Advisors

If politicians in Washington would simply develop a credible plan that reduced spending and created an environment that was conducive to growing revenue over some reasonable time frame, say ten years, the business environment in the U.S. would likely improve.


Wednesday, July 20, 2011

Economy After The Debt Ceiling Debate Concludes

It is nearly impossible to turn to any business or news program where the lead story is anything but commentary on the debt ceiling debate going on in Congress. As we noted in our 2nd Quarter Investor Letter published on Monday, the real issue is not simply raising the debt ceiling, rather the growth in the debt itself.

As the below chart shows, Congress has the unique ability to increase the Federal debt (spend beyond its means) every time the ceiling is raised. The more significant issue facing the government is developing a plan that reduces the government's overall debt.

From The Blog of HORAN Capital Advisors

At HORAN Capital Advisors we do believe the debt ceiling will be increased and if it occurs after the August 2nd deadline, the delay will not have a negative long term impact on the economy. A key will be whether spending reductions are incorporated into any debt ceiling increase that passes Congress.

From an economic perspective, we noted in our recent newsletter that the steepness of the yield curve and bank lending are suggesting a better economic environment ahead. As the below charts detail, the 13-week rate of change in loans and leases at commercial banks has turned positive, i.e., above zero, for the first time since January 2009.

From The Blog of HORAN Capital Advisors

Additionally, the below chart shows the steepness of the yield curve (fed funds versus 10 year treasury). This spread is near a record high and historically recessions have been 3+ years into the future; hence, a double dip recession does not seem to be just around the corner.

From The Blog of HORAN Capital Advisors
Chart source: Charles Schwab

Lastly, recent earnings announcements have been coming in on the strong side as 75%+ of companies that have reported have exceeded expectations.


Tuesday, July 19, 2011

Second Quarter 2011 Investor Letter

The debt ceiling debate is top of mind for investors and the market and our our recently released 2nd Quarter Investor Letter includes commentary on this issue. We hope you find the content of our letter insightful as we look to the balance of 2011.

HORAN Capital Advisors' complete Investor Letter can be accessed at the following link: 2nd Quarter Investor Letter.


Monday, July 18, 2011

The Real Issue With The Debt Ceiling

Much of the media attention surrounding the debate going on in Washington is about the issue of increasing the debt ceiling. If one reads Standard & Poor's recent report that placed U.S. government debt on "Negative Credit Watch", the primary issue cited in S&P's report was not simply an increase in the debt ceiling. A bigger issue cited in the report was Washington's lack of any credible plan on reducing the actual level of debt. In Standard & Poor’s Negative Credit Watch report S&P concluded,
“Congress and the Administration have not achieved a credible solution to the rising U.S. government debt burden [emphasis added] and are not likely to achieve one in the foreseeable future.”
The below video provides a clear summary of the current debate.


Lastly, Karl Denninger of The Market Ticker, provides a detailed summary of the debt issues facing the U.S. in a post titled, The Truth About Budgets, For Both Left and Right. It is an article that should be read in order to better understand the debt issue debate.


Monday, July 11, 2011

Estimated Earnings Growth Through 2012

By clicking the below graphic, readers can access estimated earnings growth rates for the S&P and its sectors through 2012. Beginning in Q4 2011, financials are expected to show the strongest growth in earnings. Only time will tell.

From The Blog of HORAN Capital Advisors


Monday, July 04, 2011

Slowing Emerging Market Economic Growth

Emerging market economies are at risk of overheating; however, many emerging countries are working to stem growth in an effort to prevent a hard landing of their economic growth. The countries at highest risk of overheating are detailed in the below table.

From The Blog of HORAN Capital Advisors

The factors that make up the overheating index are displayed in the below interactive table.


Source:

American Exceptionalism
The Economist
By: R.A.
July 1, 2011
http://www.economist.com/blogs/freeexchange/2011/07/global-growth


Sunday, July 03, 2011

Dividends, Stock Buybacks And Cash Balances All Higher In First Quarter

Stock buybacks and dividend increases for companies in the S&P 500 Index have certainly been on the mend since the end of the financial crisis in 2009. For the first quarter, and on a year over year basis, dividends are 13.7% higher, buybacks are 62.7% higher and buybacks plus dividends are higher by 39.6%.

From The Blog of HORAN Capital Advisors
Data Source: S&P (PDF)

In addition to the improvement in buyback and dividend payments, company cash balances now exceed a record $1 trillion, a 14.6% increase versus Q1 2010. It would certainly be positive if companies had the confidence to commit some of this cash to larger dividend increases.

From The Blog of HORAN Capital Advisors

Below is a table containing the top 10 S&P 500 companies ranked by per share cash balances.

From The Blog of HORAN Capital Advisors

Lastly, investors are encouraged to examine company 10-Qs and 10-Ks to assess the quality of corporate cash balances. An article by professors at Villinova University and Pennsylvania State University title, What's Up With Cash Balances, notes the recent poor quality of cash balances reported in financial reports. For example, in a recent 10-K for Pep Boys (PBY), the company states:
All credit and debit card transactions that settle in less than seven days are also classified as cash and cash equivalents.
Instead of showing as cash, these transactions should be classified as receivables. The article notes other liberties taken by companies with the classification of cash assets. Certainly, corporate cash balances are higher; however, actual cash may note be as high as it seems.


Saturday, July 02, 2011

Significant Decline In Put/Call Ratio And Market Rallies

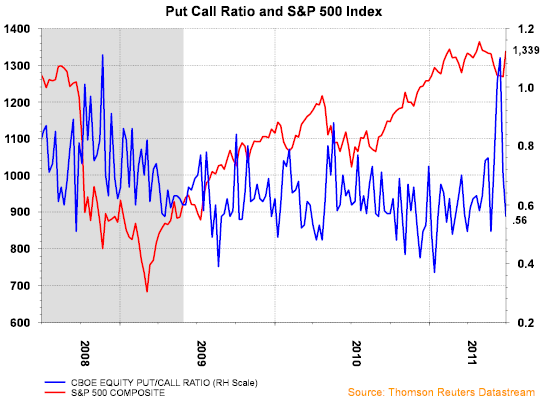
In our post in mid June titled, Market Adjusting To Slower Growth Economic Environment, we noted the put/call ratio had climbed to 1.1 and was at a level last reached at the market's low in March 2009. At the time of our post, the S&P 500 Index was trading at 1,271. Since that time the put/call ratio has declined to .56 and the S&P has rallied to 1,339, an advance of 5.3%.

From The Blog of HORAN Capital Advisors

The ability of the market to move higher in the coming week's may hinge on the market's view on a number of economic reports next week: durable goods report on Tuesday, jobless claims on Thursday, private payrolls, unemployment rate and wholesale inventories on Friday.


Sunday, June 26, 2011

Michael Mauboussin Interview: Challenging Investors' Behaviors

Consulo Mack interviews Michael Mauboussin in this week's WealthTrack video. Mauboussin is Chief Investment Strategist at Legg Mason Capital. In this interview, Mauboussin discusses why investors tend to buy high and sell low and why higher trading activity often leads to lower returns. Mauboussin is one of the leading experts on the behavioral tendencies that impact investor returns. Mauboussin believes the economy is in the earlier stages of a recovery and favors large cap equities at this point in the economic cycle. This is a must view interview for investors.


Saturday, June 25, 2011

Mid Cap Relative Valuations At Historically High Levels

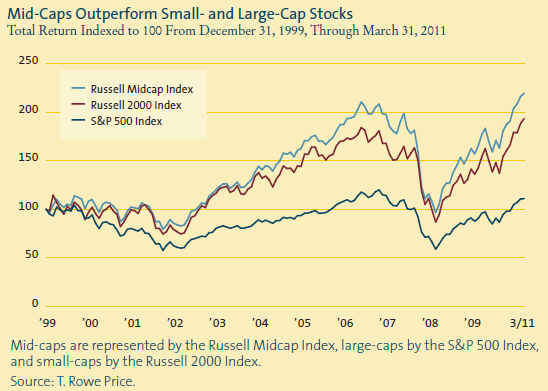
Since January 1, 2000 small cap and mid cap stocks have significantly outperformed large cap U.S. equities.

From The Blog of HORAN Capital Advisors

From a valuation perspective, since the beginning of 1992, mid cap equities are trading at historically high valuations compared to large cap stocks on a relative basis. Absolute valuations of mid cap stocks still look reasonable; however, if there is a reversion to the mean, large cap equities are likely to gain the upper hand on performance as one looks forward. Maintaining some exposure to mid caps will likely be beneficial though as merger activity often times targets the mid cap companies.

From The Blog of HORAN Capital Advisors


Sunday, June 19, 2011

Market Adjusting To Slower Growth Economic Environment

Market volatility of late seems to be the norm due to concerns over European debt defaults, budget deficits and slow worldwide growth expectations. These issues are being somewhat offset by the large amount of liquidity that resides on corporate and individual balance sheets. This liquidity is seeking a home that offers better returns than U.S. Treasuries. The 5-year Treasury is yielding around 1.53% and the 10-year treasury is under 3%, trading at a yield of around 2.95%.

Our positioning of our client portfolios maintains an overweight in health care (more defensive sector) and technology (generating strong earnings growth). We continue to maintain an underweight in the financial sector, more specifically in banks, due to our concern about their earnings growth ability in the near term given the large amount of regulation coming out of Washington D.C. Our portfolio structure continues to focus on reducing the volatility in our client investment accounts.

We do believe the economy is still growing, although at a slow pace. Some of the factors inhibiting growth are the result of supply chain disruptions caused by the tsunami in Japan and floods in the Midwest. We believe the recent market pullback is an adjustment to a slower growth global economic environment.

It is likely money flow into equities and out of bonds could pickup in the second half of this year coincident with better clarity on economic growth. The financial condition of most large companies is strong as they hold record levels of cash on their balance sheet and continue to deliver strong earnings results, although earnings comparisons become more difficult in the second quarter. These financially strong companies should provide better returns than the low rates available on treasuries. The recent market pullback seems to be providing investors underweight in equities with an opportunity to add to equity allocations and/or equity positions.

The equity put/call ratio at 1.1 is higher than the level reached at the market low in July 2010 and higher than the level at the market's low in March of 2009.

From HORAN Capital Advisors

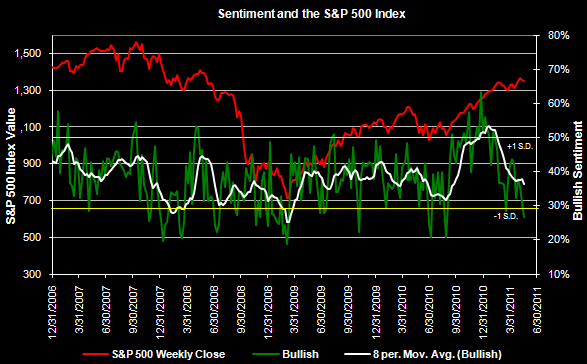
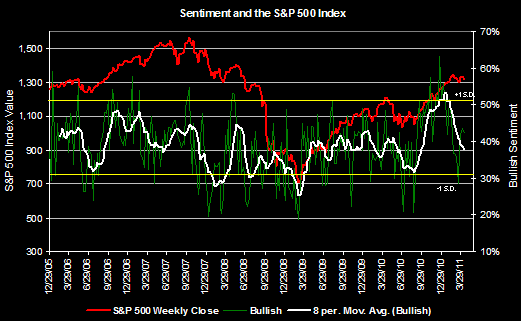
Additionally, individual investor bullish sentiment as reported by the American Association of Individual Investors remains at low levels. Last week's reading was reported at 29.0%. Although this represents an increase of 4.58% from the prior week's reading, the 8-period moving average continues in a downtrend and came in at a lower 30%. This contrary indicator tends to be most accurate at the extremes.

From HORAN Capital Advisors

The excessive investor pessimism, a potential resolution to the Greek debt crisis before the end of the weekend or early next week, even if only a short term one and decent equity fundamentals could see the market recover from oversold conditions in the near term.


Thursday, June 09, 2011

Bullish Investor Sentiment In Continued Downtrend

This morning the American Association of Individual Investors reported a decline in individual investor bullish sentiment 24.42% versus last week's reading of 30.18%. The bearish sentiment level jumped over 14% to 47.67% versus last week's bearishness level of 33.43%. This resulted in a bull/bear spread of -23.3% versus last week's -3.3%. Lastly, the 8-period moving average of the bullish sentiment reading is approaching levels reached in March 2009, a market turning point.

From The Blog of HORAN Capital Advisors


Monday, June 06, 2011

Market Is Looking Oversold

The S&P 500 Index has generated a negative return in each of the last five weeks and has started the sixth week on a down note. From a technical perspective the market appears oversold.

The percentage of stocks selling above their 50 day moving average has fallen to levels last seen during the March lows earlier this year. After the close today only 24% of S&P 500 stocks are trading above their 50 day moving average compared to 27% in March. Additionally, the percentage of stocks trading above their 150 day moving average is at a level last seen in the third quarter of 2010.

From The Blog of HORAN Capital Advisors

From The Blog of HORAN Capital Advisors

From The Blog of HORAN Capital Advisors


Saturday, June 04, 2011

The Dow Struggles In The Month Of June

Chart of the Day recently provided information on the historical monthly performance of the Dow. Below is what they had to say along with their graphic.
"[The] chart illustrates the Dow's average performance for each calendar month since 1950 (blue columns) and the average monthly performance of the Dow from 1950 to the present (gray line). [The] chart illustrates that the Dow has tended to perform best during the last several months and first several months of a calendar year. During the middle of a calendar year, the Dow has tended to struggle (with the exception of July). It is worth noting that there have been only two calendar months during which the Dow has declined on average -- June and September."
From The Blog of HORAN Capital Advisors


Wednesday, June 01, 2011

A Slow Growth Market Environment

Before May and now the first day of June, it seems the S&P 500 Index desires to do anything but move higher. The S&P 500 Index had advanced over 9% through the first four months of the year. It is not reasonable to think the market can move higher by 9% every four months. So in May, the S&P declined 1.13% and June is starting off on a weak note by declining 2.28%. After the markets decline today, the S&P 500 Index is still up 5.38% on a year to date basis.

The next support level for the S&P is 1,305; however, it is difficult to guess market bottoms. From a fundamental perspective though, valuations for large cap U.S. equities continue to look more and more attractive. The forward four quarter P/E ratio for the S&P 500 Index is 12.8 times based on projected earnings of $103.57 for the S&P 500.

From The Blog of HORAN Capital Advisors

From The Blog of HORAN Capital Advisors

The sell off today was triggered by the weaker than expected ADP payroll report. Unfortunately, we believe this type of weaker, or less than robust, economic data will be the norm over the course of the next 6-12 months. The unemployment rate will likely remain stubbornly high as we noted on page 3 of our first quarter investor letter.

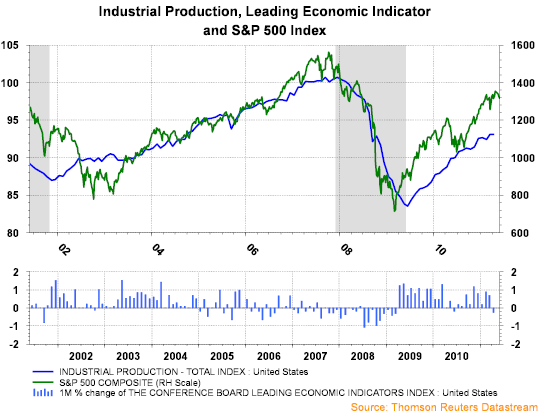
The small down tick in the U.S. Leading Economic Index is not unusual when the economy is entering the mid-cycle of a recovery.

From The Blog of HORAN Capital Advisors

Additionally, companies have reduced inventory levels relative to sales to the point that a slight improvement in demand will likely result in the need to increase manufacturing to replenish stocks.

From The Blog of HORAN Capital Advisors

And finally, as Liz Ann Sonders notes in a recent strategy article, Chief Investment Strategist at Charles Schwab & Co. (SCHW),
"The...massive flow disruptions in Japan are already beginning to turn. Commodity prices have come off the boil. Finally, both monetary and fiscal policy remains stimulative; even considering the finale of QE2 in a few weeks. The Fed has no intention of draining its balance sheet any time soon, nor raising rates.

Corporate America has rarely been healthier, and the cash firepower available to companies is massive. Debt-to-equity for US companies is at its lowest in over 20 years and they hold nearly $2 trillion in cash on their balance sheets.

With leverage so low, if it simply returned to the average of the past decade, companies would have an extra $2.7 trillion to spend, according to the Financial Times. Deal-making is back.

In sum, growth has certainly slowed, but many of the contributing factors are temporary in nature. Assuming US GDP growth can rebound back above 2%, historically this isn't a bad backdrop for stocks. Looking at all years when US GDP growth was between 2% and 3%, the average return for the S&P 500 was nearly 14%, with only two down years out of 11 total. Not bad (emphasis added)."

Disclosure: Long SCHW


Tuesday, May 31, 2011

Food Inflation Versus CPI

Much has been made lately regarding food inflation and the lack of impact on the Consumer Price Index. In large part, the reason for this is due to the fact, in the U.S., the food component in CPI is a much smaller weighting than in developing countries around the globe.

From HORAN Capital Advisors

Below is a chart of the CRB Spot Foodstuffs Index and the U.S. Consumer Price Index. As the 20-year chart shows, although the Foodstuffs Index is up over 40% on a YOY basis and CPI is up 3.1%, the two indexes are tracking closely. Several of the component's of the Foodstuffs Index are butter, cocoa, corn and hogs. And, although we are seeing food price inflation, it represents a smaller weighting within the CPI, for example, butter is only .067% of the consumer price index.

From HORAN Capital Advisors


Sunday, May 22, 2011

Small Cap Valuations Getting Extended

On a relative basis, small cap stock stocks are trading at near record levels from a valuation perspective since 1990.

From HORAN Capital Advisors

A part of the valuation difference is a result of the strong performance achieved by small cap stocks versus large cap stocks. As the below chart details, the 10-year return of the Russel 2000 small cap index has far outpaced the return of the S&P 500 index, 70.8% versus 6.7%, respectively.

From The Blog of HORAN Capital Advisors


Friday, May 20, 2011

Bullish Investor Sentiment Continues Its Decline

In this week's sentiment survey by the American Association of Individual Investors, it was reported that bullish sentiment fell to 26.69%. This is the lowest level for bullish investor sentiment since August of last year, which was near the low point for the market in 2010. The bull/bear spread was reported at -14.6%. It is important to note the sentiment indicator is a contrarian one and tends to be most accurate at its extremes. As the below chart outlines, the bullish indicator is entering extreme territory.

From HORAN Capital Advisors

Source: AAII


Tuesday, May 17, 2011

Why The Price Of A Gallon Of Gasoline Seems Elevated

A great deal of rhetoric is being expended on the fact consumers are paying high prices at the pump for a gallon of gasoline. Politicians are implying the oil companies are price gouging. Much of the attention is focused on the fact WTI (West Texas Intermediate) Cushing crude oil has fallen to around $97 per barrel. In September of 2008 when WTI was declining from its high of nearly $140 a bbl, a gallon of gas cost a consumer $3.70. The current price for a gallon of gas is around $4.00. So yes, pump prices do seem a little elevated on the surface. On the other hand, there is more at play than WTI crude prices.

From HORAN Capital Advisors

Since early this year, the price of Brent crude began to climb at a higher rate than WTI crude. At the moment, WTI is trading around $97 bbl and Brent is trading around $110. A week ago Brent was trading near $120 per bbl.

From HORAN Capital Advisors

The higher Brent price is largely due to the unrest in the Middle East. This unrest has placed a higher risk premium on crude prices that are exported and created more demand by European countries for Brent crude. Additionally, since the U.S. is a large importer of crude, gasoline pump prices are likely being set more off of the Brent price versus the WTI price.

Some in the media have indicated gasoline prices should be around $3.00 per gallon. However, in 2008, this was more the case when crude prices were rising than when they were falling. In a market driven economy, prices seem to always go up faster than they come down.

The disparity in price between WTI and Brent does not appear to be narrowing much at this point in time. Given the volatile situation in the Middle East, the price disparity could continue through the summer and higher than expected gasoline prices at the pump may be a fact of life near term.


Sunday, May 15, 2011

All The Economic News Is Not Bad

It seems much that is being written of late is focused on negative data points that attempt to rationalize why a correction is just around the corner. I get the sense the stock market's (Dow Jones Industrial Average) 30+% advance since early July is weighing on strategists' and investors' minds as not being sustainable. Certainly a pullback would be healthy for the markets.

Last week's investor sentiment survey from AAII certainly suggests the individual investor is not overly bullish. In fact, the bullish sentiment reading fell almost five percentage points to 30.77%. This is below the long term average of 39%.

From The Blog of HORAN Capital Advisors

In spite of the lack of enthusiasm of individual investors, and this is a bullish sign for the markets, the broader confidence and sentiment readings continue to improve. The consumer confidence index continues to trend higher along with the the University of Michigan Consumer Sentiment Index.

From The Blog of HORAN Capital Advisors
On the business front many of the data points suggest a continued improvement in the business segment of the economy.
  • Strength in industrial production.
From The Blog of HORAN Capital Advisors
  • improvement in nondefense manufacturers' new orders.
From The Blog of HORAN Capital Advisors
  • corporate profits are at record levels; however, after tax corporate profits recently turned lower.
From The Blog of HORAN Capital Advisors

From The Blog of HORAN Capital Advisors
  • business inventory to sales ratio continues to decline to a record low level. If sales continue to improve, this inventory will need to be replaced and will provide support to the production side of the economy.
From The Blog of HORAN Capital Advisors

Now that I have noted some positives on the economic front, there are certainly factors that could derail economic growth. I think Bill Gross' April investment outlook, titled Skunked, is a worthwhile read for all investors. The U.S. government has significant budget/structural issues that need to be dealt with by Congress. Any steps to reign in government spending will be contractionary from an economic perspective. The benefit of dealing with the deficit issue though could outweigh the short term negatives. In addition to the budget deficit, directly related is the upcoming end to the Fed's QE2 program.

Also, an article highlight from Abnormal Returns pointed to a report in The Economist that was suggestive of the global economy running out of steam. This recovery is certainly a fragile one, but it is a recovery nonetheless.

The equity and bond markets tend to be forward looking and from a pure technical perspective, Doug Short wrote about how many of the markets are currently testing key support levels. The market will get a chance to digest several important economic releases this week that deal with jobless claims and existing home sales. These support levels are worthwhile factors for investors to watch.

As Winston Churchill once said, "The pessimist sees difficulty in every opportunity. The optimist sees opportunity in every difficulty." There are certainly many factors around the globe that could derail our recovery. This does present investors with investment opportunities though.


Sunday, May 08, 2011

Dividend Actions As A Forecasting Variable

One reason we review a company's actions in regards to its dividends is these actions can provide insight into the potential direction of a company's stock price. Additionally, the broader dividend actions of companies in the S&P 500 Index can provide insight into the market's future direction as well. In as much as dividends are important, it is really the insight that dividends provide into a company's future cash flow expectations and the quality of its earnings.

The below chart graphs the S&P 500 Index returns for the seven year period (2003 - 2009). Admittedly, this is a short time period and I will attempt to post an analysis of the data over a longer time period in the near future. The graph also includes the positive dividend actions within the index lagged, or pulled forward 1-year. The correlation coefficient of the two data sets is .7775. This high level of correlation suggests that an investor's ability to forecast dividend actions can have a positive impact on ones investment returns.

From The Blog of HORAN Capital Advisors

We have written a number of articles on our blog that addresses the importance of dividends and the role they play in assessing the quality of a particular company's earnings.


Saturday, May 07, 2011

Positive Dividend Actions Now At 2006 Level

For the first four months of the year, positive dividend actions for companies in the S&P 500 Index equal levels achieved in 2006. The twelve initiated dividends this year are at their highest level during any point since 2004.

From The Blog of HORAN Capital Advisors

As the below table indicates, the sector contributing the largest percentage to the S&P 500's dividend income is now the consumer staples sector at just over 16%. In 2008, the financial sector was the largest contributor at more than 20%. Financials now account for 11.9% of the index's dividend income. Many investors and strategist seem to be counting on greater dividends from banking firms. This may materialize in the second half of 2011.


Data Source: Standard & Poor's


Thursday, May 05, 2011

Investor Sentiment Not Overly Bullish And The Presidential Election Cycle

This week's bullish investor sentiment level released by the American Association of Individual Investors came in at a not so bullish 35.46%. This is down from the prior week's bullishness level of 37.90%. The bull/bear spread narrowed to 3.6% versus 7.3% last week.

From The Blog of HORAN Capital Advisors
Source: AAII

The current week's bullishness reading is below the long term bullishness average of 39%. Investor should keep in mind that this one technical indicator is most accurate at extreme levels.

The strength of the market advance so far this year makes it not surprising that the market might experience a little consolidation. Also, for those interested in the presidential cycle, the third year of a president's term tends to be the best. The post I wrote on the presidential cycle in June of last year noted the strength of the market in Q4 of year 2, and in Q1 and Q2 of year 3. The average frequency of quarterly advances was over 80% in the three quarters noted previously.

From The Blog of HORAN Capital Advisors

From an economic perspective, recently released data points suggest a slow growth economic picture. Friday's non-farm payroll release could provide further confirmation of this slower growth view. At HORAN Capital Advisors, we continue to believe high quality large cap U.S. equities remain attractive in this environment and attractive from a valuation perspective. So outside the speculation in the commodity sector, the equity market's recent pullback is healthy and may afford investors an opportunity to build or add to equity positions.


Wednesday, May 04, 2011

Dividend Payers Outperform Non Payers In April

The return for the dividend paying stocks in the S&P 500 Index have trailed the return of the non payers in the index this year. However, in April the return for the dividend payers return narrowed this underperformance gap by outperforming the non payers, 3.21% versus 2.84%. Although one month does not make a trend, given the general seasonal weakness experienced in the market going into summer, maybe investors are beginning to favor the generally higher quality payers at this point in the market cycle.

From The Blog of HORAN Capital Advisors


Sunday, May 01, 2011

Strong Earnings Growth Supporting Market Advance

Strong earnings growth so far in the first quarter for companies in the S&P 500 Index is an important factor that explains the strength of the recent advance in the market. As the below chart shows, Q1 earnings expectations for S&P 500 companies has increased significantly.

From The Blog of HORAN Capital Advisors
  • The estimated growth rate for earnings in Q1 for S&P 500 companies is 18%.
  • The forward four quarter P/E ratio for the S&P 500 Index stands at 12.9.
  • Through the end of April, 324 companies have reported earnings, with 84% either exceeding or meeting expectations.
  • Companies are reporting earnings that are 7% above estimates which is greater than the 2% longer term average surprise factor.
Source: Thomson Reuters


Tuesday, April 26, 2011

First Quarter 2011 Investor Letter

First quarter corporate earnings results reported to date continue to be indicative of a sustained economic recovery. Our 1st Quarter Investor Letter provides our insight on the past quarter and a further look into 2011.

HORAN Capital Advisors' complete Investor Letter can be accessed at the following link: 1st Quarter Investor Letter.


Sunday, April 24, 2011

Invest In Emerging Markets Via High Quality Multinational Companies

In this week's WealthTrack video, Consuelo Mack talks with Jason Trennert of the research firm Strategas and Chuck Lahr, manager of PIMCO's Pathfinder World Fund (PATHX). Both are positive on the equity markets over the next 12-18 months. Chuck says the best value is in European companies that do business in the emerging markets. Jason favors high quality U.S. multinational companies that have dividend growth characteristics.


Thursday, April 21, 2011

The U.S. Government Deficit On An Unsustainable Path

The issue of the U.S. federal government's deficit has been a front and center issue over the course of the last several months. Congress' and the Obama administration's effort to reach an agreement on the FY 2011 federal budget touted the $38 billion reduction in spending. As the below chart shows, the current deficit stands at $1.4 trillion. Cutting $38 billion will have little impact on what ultimately needs to be accomplished. Even if revenues returned to levels in early 2008 (black line in below chart), the deficit would still be equal to about $900 billion. The widening gap between spending and receipts is an unsustainable one. The second chart details the rapid increase in the governments overall debt which has ballooned along with this widening gap between receipts and outlays.

From The Blog of HORAN Capital Advisors

From The Blog of HORAN Capital Advisors


Tuesday, April 19, 2011

Even A Little Inflation Is Dangerous

In the below video, James Grant of the Interest Rate Observer, provides an interesting interview with Consuelo Mack of WealthTrack. In the interview, Grant points to the dangers of even a little inflation and this policy's impact on inflating asset prices. He believes the Fed's policy of targeting a 2% inflation rate is misguided and provides his rational in the interview. Mr. Grant's views of the market come from the bearish perspective; however, investors are wise to look at the market from the perspective of both the bulls and the bears so as to have a well formulated view of the market.


Thursday, April 14, 2011

Sentiment Not Overly Bullish And Inverted Head and Shoulders Set Up

After the strong returns for the market in the first two months of the year, March appeared to served as a digestive phase for the market. Not surprisingly, since the beginning of March, the S&P 500 Index seems stuck in a trading range. From a pure technical perspective, the chart pattern that appears to be unfolding is a bullish inverted head and shoulders pattern. In order to complete this pattern, formation of the right shoulder is necessary with a sell off in the S&P 500 Index down to around 1,300. The market closed today at 1,314 so it is not far from this point. Additionally, a sell off with higher down volume would be positive as well. With tomorrow being an option expiration day, one could envision a higher volume down day occurring and completing the bottom of the right shoulder.

From The Blog of HORAN Capital Advisors

Individual investor sentiment does not seem overly bullish either, which is a positive contrarian indicator. This week's sentiment survey reported by the American Association of Individual Investors reported bullish sentiment of 42.2%. This is down 1.4% from last week's bullishness reading. As the below sentiment chart shows, individual investor bullish sentiment has not reached an extreme level. As an observation, these sentiment indicators tend to be most accurate at extreme levels.

From The Blog of HORAN Capital Advisors

In short, the market seems poised to move higher in a "climb the wall of worry phase". In July 2009, I discussed this wall of worry phase in a post, Where Are We In The Market Cycle that readers may find of interest.


Saturday, April 09, 2011

Buybacks Signaling Improved Business Confidence

Stock buybacks in 2010 came roaring back, increasing 117% over 2009 buybacks. According to Standard & Poor's Howard Silverblatt,
"Approximately $299 billion was spent by S&P 500 companies on share repurchases last year which represents a whopping 117% increase over the $138 billion spent in 2009. At this point the practice is not as deep as it was in the heydays of 2006-2007, but companies are certainly back in the buyback business. While 2010 expenditures are still just half of what was seen in 2007, last year’s activity resulted in a record year-over-year percentage and dollar increase for stock buybacks."
From The Blog of HORAN Capital Advisors

Below is a table highlighting companies that had significant buybacks last year.

From The Blog of HORAN Capital Advisors

Source:

S&P 500 Stock Buybacks Up 117% in 2010;Share Repurchases
Increase for the 6th Quarter in a Row

Standard & Poor's
By: Howard Silverblatt
March 23, 2011
http://tinyurl.com/3wsopb7

Disclosure: Long MSFT, XOM


Monday, April 04, 2011

Dividend Payers Underperforming Through First Quarter

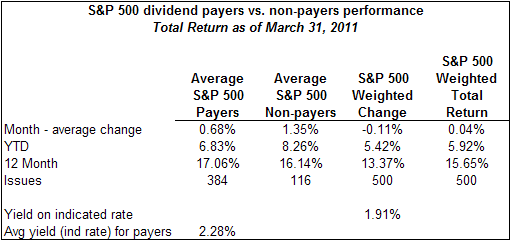
The equal weighted performance of the dividend payers in the S&P 500 Index trails the non payers through the first quarter of 2011, 6.83% versus 8.26%, respectively. For the 12-months though, the payers have a slight edge over the non payers, 17.06% versus 16.14%, respectively. The payers and non payers performance is calculated on an equal weighted basis and both are outperforming the market cap weighted S&P 500 Index for each of the time periods below.

From The Blog of HORAN Capital Advisors