Sunday, July 04, 2010
Dividend Payers Outperforming
Posted by
David Templeton, CFA
at
5:07 PM
0
comments
Labels: Dividend Analysis , Dividend Return
Cash Likely To Reduce Overall Investment Returns
| From The Blog of HORAN Capital Advisors |
| From The Blog of HORAN Capital Advisors |
Posted by
David Templeton, CFA
at
9:51 AM
0
comments
Labels: Investments
Thursday, July 01, 2010
Individual Investors Certainly Not Bullish
| From The Blog of HORAN Capital Advisors |
Posted by
David Templeton, CFA
at
10:08 AM
0
comments
Labels: Sentiment
Wednesday, June 30, 2010
The Market Does Track Earnings
| From The Blog of HORAN Capital Advisors |
Economically, there are a number of positives that we will touch on in our second quarter newsletter. The two biggest negatives though are housing and employment.
Posted by
David Templeton, CFA
at
9:37 PM
0
comments
Labels: Economy , General Market , Technicals
Friday, June 25, 2010
Expect Market To Trade Within A Range
Posted by
David Templeton, CFA
at
10:09 AM
0
comments
Labels: General Market , Technicals
Wednesday, June 23, 2010
How Low Will New Home Sales Fall?
Posted by
David Templeton, CFA
at
10:19 PM
0
comments
Labels: Economy
A Peak In The Leading Indicator Index Indicative Of Mid-Cycle Economic Phase
"The number of leading indicators rising on a one-month basis fell significantly from seven out of 10 in March to four out of 10 in April (see Exhibit 3, right). On a more sustained six-month basis, eight out of 10 indicators rose in April—the same as the prior month. The declines on a one month basis were relatively small for all of the leading indicators except building permits, which fell 12% in April from the prior month--a sign of continued stress in the residential housing markets. However, continued strength on a six-month basis and mixed messages on a one-month basis could be indicative of the economy moving into the mid-cycle stage of economic recovery (emphasis added).
While leading indicators tend to rise in near unison immediately following recessions, interpreting them becomes more difficult as the economic recovery gains footing because these indicators tend to rattle around in a more volatile manner. The Conference Board combines these 10 leading indicators into a weighted Leading Economic Indicators (LEI) index that helps paint a broader picture than any one of its subcomponents. As an economic recovery develops, it is helpful to observe these leading indicators alongside other data to gauge a recovery’s strength. The Coincident Economic Indicators (CEI) Index, which helps to gauge current economic conditions as opposed to the leading nature of LEI, is suitable for this purpose."
Source:
Rising Corporate Confidence: Yet to Show Signs of Reversal
Market Analysis, Research & Education
A unit of Fidelity Management & Research Company
June 14, 2010
http://personal.fidelity.com/products/funds/content/pdf/yet_to_show_signs_of_reversal.pdf
Posted by
David Templeton, CFA
at
10:03 PM
0
comments
Labels: Economy
Sunday, June 20, 2010
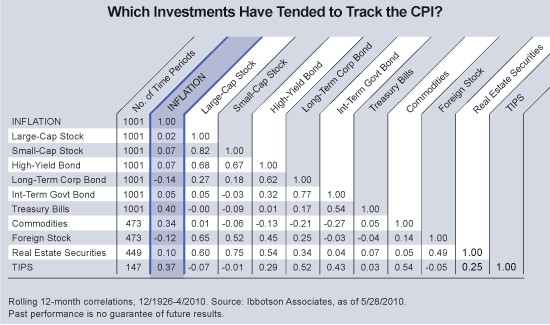
Where To Invest In An Inflationary Environment
"...my concern about long-run inflation comes not from the expansion of the Fed's balance sheet, but instead from worries about the ability of the U.S. government to fund its fiscal expenditures and debt-servicing obligations as we get another 5 or 10 years down the current path"
"In theory, a perfect inflation hedge would be an investment whose price moves in the same direction, at the same time, and by the same amount as changes in the consumer price index. Of course, there is no perfect inflation hedge, and while past performance is no guarantee of future success, some asset types have been more successful than others. For a successful hedging strategy, an investment’s return should increase at least as much as and at about the same time as the increase in inflation—or the time lag should at least be measured in months rather than years. Whereas building in protection against inflation over the long haul requires a more holistic approach and a consideration of what asset types have tended to do best in different inflationary environments."
As I noted in an article from a few years ago, Are Stocks A Good Hedge Against Inflation?, the important factor to consider is the direction of inflation. If the rate of inflation is slowing, i.e., increasing at a decreasing rate, the market is likely to view this as a positive for stocks. So in a high inflation environment, even stocks can be a good investment if the rate of change in inflation is negative.
The conclusion in my earlier article noted, "in these tough times in the market, stock price returns will be impacted by events happening in the future and not by those that have already occurred. From an emotional standpoint, it is easy to let ones feelings for future stock expectations get clouded by past events. Being able to overcome these past influences is important in achieving positive investment returns."
Source:
Inflation vs. deflation: Prepare for Either
Fidelity Viewpoints
By: Bill Ralls, CFA
June 2, 2010
https://news.fidelity.com/news/article.jhtml?guid=/FidelityNewsPage/pages/fidelity-prepare-for-inflation-or-deflation&topic=investing
Posted by
David Templeton, CFA
at
4:02 PM
0
comments
Labels: Commodities , Economy , General Market
Saturday, June 19, 2010
Is Gold's Bubble About To Burst?
"...even on an inflation-adjusted basis, gold prices are higher now — two standard deviations above their long-term averages —than they've been since the early 1980s, when the U.S. was experiencing double-digit inflation. The metal is also “out of whack” with other commodities, a trend which has caused some puzzlement, even in places like the Federal Reserve."
Posted by
David Templeton, CFA
at
6:34 PM
0
comments
Labels: Commodities , Technicals , Valuation
Corporate Cash Levels Continue To Grow
"...nonfinancial companies had socked away $1.84 trillion in cash and other liquid assets as of the end of March, up 26% from a year earlier and the largest-ever increase in records going back to 1952. Cash made up about 7% of all company assets, including factories and financial investments, the highest level since 1963."
At the end of the day, this cash growth does show company business prospects have improved. No doubt corporate level expenses have been cut as well, but growth in revenue and earnings is occurring. I suspect this revenue and earnings growth will continue through year end and into 2011.
Posted by
David Templeton, CFA
at
8:51 AM
0
comments
Labels: Investments
Thursday, June 17, 2010
HORAN Capital Advisor's Philosophy & Approach
Attractive rates of return are achieved with dynamic asset allocation and a focus on high quality investments. Our philosophy emphasizes the importance of fundamentals and valuations. Investor euphoria and asset bubbles occur when fundamentals and valuations are ignored.; therefore, screening for high quality securities takes patience and a disciplined process. The capital markets always present opportunity and value is added when undervalued investments are purchased and overvalued ones are sold.
When we look at specific securities, the screening process must be clearly defined. For example, we approach individual equities by identifying criteria defined by a high quality approach. Companies must exhibit consistent growth, management strength, market dominance, and financial stability. Frequently, the byproduct of these metrics is a consistent dividend distribution. A company with the availability to grow its dividends is a sign of strong cash flow and profitability.
The world has become a different place over the past decade. Household wealth has seen significant variations leading to nervous investors. Volatility may likely remain as the world reacts to sovereign debt issues, geopolitical concerns, and policy changes. Patient investors will find opportunities to invest in securities that have attractive valuations and growth characteristics.
A strong and communicative client relationship enables us to establish an appropriate asset mix utilizing the global opportunity set. Our investment philosophy and core approach helps clients achieve their long-term goals and objectives.
Posted by
David Templeton, CFA
at
10:06 AM
0
comments
Labels: Investments
Monday, June 14, 2010
The Market's Bear Case
...if one removes the impact of deficit spending, "the economy has recovered to the point where the year-over-year growth rate since early 2009 now matches the worst performance of any of the 50 years preceding the recent downturn." In effect, Wall Street's is seeing "legs" where the economy is in fact walking on nothing but crutches.
Source:
Born on Third Base
Hussman Funds
by: John Hussman
June 14, 2010
http://www.hussman.net/wmc/wmc100614.htm
Posted by
David Templeton, CFA
at
11:24 PM
0
comments
Labels: Economy , General Market
Contrarian Signs That Bull Market Phase Approaching
"The bearish forecasters who rose to fame in the market crash of 2008 have, for the most part, not surrendered their pessimism. Their moment could be coming back around..."
"Last week, the Dow Jones Industrial Average rose above 10000—again. Since March 16, 1999, when it first touched 10000 in intraday trading, the Dow has bounced over that threshold and back 63 times. This Friday (6/11/10), the index closed 219.6 points below where it stood exactly 11 years ago."
"in my nearly 50 years of experience in Wall Street, I've found that I know less and less about what the stock market is going to do but I know more and more about what investors ought to do."
Posted by
David Templeton, CFA
at
9:53 PM
0
comments
Labels: General Market , Technicals
Dividend Payments Likely To Improve?
Today, companies are in a position to once again focus on growing their dividends for several reasons."A dividend-oriented strategy has to be looked at over market cycles—there are times when it will lag, typically coming off a market correction or recession, and times when it does relatively well, usually in periods of market turbulence."
- Strong Balance Sheets: Many companies are flush with cash. A recent Wall Street journal article noted, "U.S. companies are holding more cash in the bank than at any point on record, underscoring persistent worries about financial markets and about the sustainability of the economic recovery. The Federal Reserve reported Thursday that nonfinancial companies had socked away $1.84 trillion in cash and other liquid assets as of the end of March, up 26% from a year earlier and the largest-ever increase in records going back to 1952. Cash made up about 7% of all company assets, including factories and financial investments, the highest level since 1963."
- Sluggish Growth: In periods of slow economic and earnings growth dividends become a more critical part of the total return of a particular company's stock. In this environment companies are likely to respond to the investor's desire for more income from their equity investments. Since 1925, reinvested dividends have accounted for almost 44% of the total return of the S&P 500 Index.
- Less Volatility: Dividend paying stocks tend to be less volatile during downside market volatility. One factor we believe that will be present in the investment markets for the foreseeable future is a more volatile investing climate. A recent T. Rowe Price report notes, "dividend-paying stocks in the S&P 500 outperformed nondividend payers in every bear market since 1973 but tended to lag in bull markets, according to Ned Davis Research (NDR), a market research firm.
During the bear market from March 24, 2000, to October 9, 2002, the S&P 500 plummeted 49.1%, while the Dividend Aristocrats gained 15.5%, according to Strategas Research Partners, another market research firm. In the recent market decline from October 2007 to March 2009, the Aristocrats declined 49.6%, compared with 56.8% for the S&P 500."
- Long-Term Performance: "NDR calculates that from 1972 through March 31, companies in the S&P 500 that have consistently increased or started making their dividend payouts provided an annualized return of 9.4%, compared with 7.3% for companies that paid dividends but did not increase them and only 1.5% for non-dividend-paying stocks."
- Steady Cash Flow: "From 1980 through 2009, dividends on stocks in the S&P 500 grew at an annual compound rate of 4.7% compared with the 3.7% annual inflation rate."
Over a longer time period, principal growth of an equity portfolio outpaces that of a fixed income portfolio as well. The T. Rowe Price article cites a Ned Davis Research study showing this performance difference.
"NDR tracked the performance of two portfolios over the past 25 years. One consisted of the top 50% of dividend payers in the S&P 500. The other was the S&P Long-Term Government Bond Index. The study assumed all interest and dividend payments were taken in cash each year.
Assuming a $500,000 initial investment in each portfolio at the end of 1984, the equity index provided total dividend payments of more than $2.6 million through 2009, or about $212,000 more than the total interest payments from the bonds. Moreover, in terms of principal value, the original $500,000 investment in the stock portfolio grew to more than $2.8 million compared with about $908,000 in the bond portfolio."
Source:
Dividends, a Casualty of the Crisis, Poised for a Comeback? (pp12-13)
T. Rowe Price Report
Spring 2010
http://individual.troweprice.com/staticFiles/Retail/Shared/PDFs/Spring2010PriceReport.pdf
Posted by
David Templeton, CFA
at
3:08 PM
0
comments
Labels: Dividend Return , Investments
Monday, June 07, 2010
Market Still Short Term Oversold
What does seem to be the case though is the selling pressure is subsiding in spite of the late day sell off today. Trading volume on these down days continues to occur on successively lower volume days. Additionally, the percentage of stocks trading above their 50 and 150 day moving averages continues to decline. The percentage above their 50 day M.A. is not too far from the percentage reached in March of last year.
Posted by
David Templeton, CFA
at
11:32 PM
0
comments
Labels: General Market , Technicals
Sunday, June 06, 2010
Dividend Payers Trail Non Payers In May
Posted by
David Templeton, CFA
at
9:52 PM
0
comments
Labels: Dividend Return
Saturday, June 05, 2010
Presidential Election Cycle Nearing Its Best Quarters
Standard & Poor's recently updated the cycle data through the first quarter of 2010 and going back to 1945. What the data suggests is the worst performing period for the market is Q2 and Q3 of the second year of a president's term. As the below table notes, the second quarter averaged a loss of 2.0% and the third quarter averaged a loss of 1.0%. For the quarter to date period in Q2 of this year, the S&P 500 Index is down 8.61% through the market's close on June 4th. This 8.61% decline is far worst than the average decline of 2.0%. In fact May's return of -8.2% is the worst May return for the market since 1962.
![]() |
In looking at the chart technicals for the S&P 500 Index, downside volume has been on the decline. One question that jumps out in the chart is whether the red line around the 1,050 level on the S&P is support or whether it is the neckline in a head and shoulder chart pattern. If the market can push through the 1,150 level on the S&P, i.e., break the resistance of the left shoulder of the pattern, technically the market could see additional strength. In the end though, the market will trade on fundamentals.
Source:
Whistling a New Tune in June?
Standard & Poor's
By: Sam Stovall, Chief Investment Strategist
May 28, 2010
http://tinyurl.com/2eegx46
Posted by
David Templeton, CFA
at
1:23 AM
2
comments
Labels: General Market , Technicals
Wednesday, June 02, 2010
Stocks Undervalued and/or Bonds Overvalued?
"The chart below depicts (on the right axis) the gap between the yields on the benchmark 10-year Treasury note and the S&P 500. Plotted against this series is the performance gap between the return on the S&P 500 and the return on the 10-year Treasury over the subsequent 12-month period.
Generally, a yield gap of 400 basis points or less has proven bullish for stocks. More notable, however, is that extreme levels have been very predictive of the market’s future direction. For example, the yield gap peaked in the fourth quarter of 1999 at 535 basis points, accurately foreshadowing that stocks were quite overvalued relative to bonds. Alternatively, in March of 2003 the gap had shrunk to just 150 basis points as bond yields had plunged and stock prices had sunk to bear market lows (thus pushing up dividend yields). The current readings are even below the March 2003 levels, suggesting that stocks are quite undervalued."
Posted by
David Templeton, CFA
at
9:30 PM
0
comments
Labels: General Market , Technicals
Tuesday, June 01, 2010
Smart Money Optimism On The Increase
Liz Ann Sonders, Chief Investment Strategist for Charles Schwab & Co notes:
"In general, you want to follow the smart money traders—tracking indicators such as commercial hedger positions and the S&P 100 index (OEX) put/call and open interest ratios. In contrast, you want to do the opposite of what the dumb money traders are doing—tracking indicators such as the equity-only put/call ratio, flows into and out of the Rydex series of funds and small speculators in equity index futures contracts.
As the old adage goes, markets can stay irrational longer than you can stay solvent, so I’m not here to judge the precise end to this correction. As we’ve noted, the market had been overdue for another pullback, one likely to be less benign than those that preceded it in light of stretched technical and sentiment conditions. In fact, it’s usually soon after the first year of a new bull market (cyclical or secular) that the market experiences its first 10%-15% correction."
Some Days Are Better Than Others ... Just Not These Days
Charles Schwab & Co.
By: Liz Ann Sonders, Chief Investment Strategist
June 1, 2010
http://tinyurl.com/29xcuu5
Posted by
David Templeton, CFA
at
8:54 PM
0
comments
Labels: Technicals
Monday, May 31, 2010
Better Investing's Most Active
Disclosure: Long ABT, GE
Posted by
David Templeton, CFA
at
5:25 PM
0
comments
Labels: Investments
Seems Like The Market Is Oversold
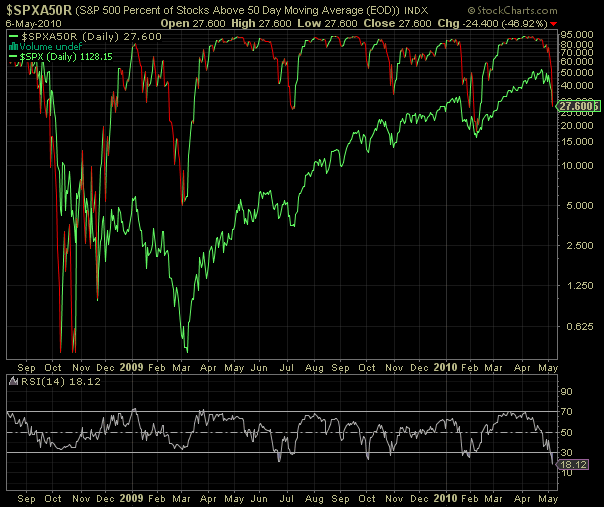
The sharp sell off has resulted in a number of technical indicators suggesting an oversold market. The percentage of S&P 500 stocks selling below their 50-day moving average is near levels achieved in early 2009.
If there is a concern, beyond those in Europe, it is deleveraging that is occurring at the moment. This deleveraging process is taking away some of the strength that would come from the consumer. With job growth weak, consumers are feeling stressed and with out a confident consumer, economic growth might continue, but on the weaker side.
Posted by
David Templeton, CFA
at
2:08 PM
1
comments
Labels: General Market , Technicals
Saturday, May 29, 2010
Market Corrections Not Unusual
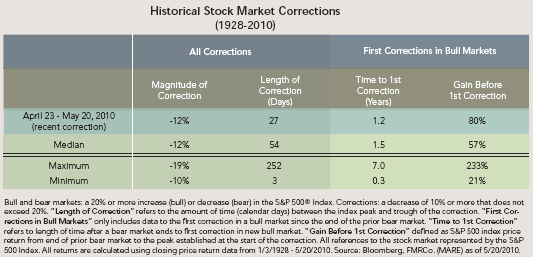
According to a recent report from Fidelity, the following aspects of market corrections are pretty typical:
- It’s been about 14 months since the current bull market began on March 9, 2009, which is in the neighborhood of the average length of time that has passed from the start of prior bull markets to a first correction (17 months, see above table).
- The stock market gained 80% before the recent correction. Historically, the first correction in a new bull market has come after average gains of 57%, implying the current bull market was overdue for a correction on a price appreciation basis.
- The main factor that has differentiated this recent correction is that it has taken place at a fairly swift pace compared to history. It took 27 days for the market to surpass the 10% decline threshold, which is half the time it’s historically taken on average for a correction to occur (54 days).
- Since 1926, there have been 20 stock market corrections during bull markets, meaning 20 times the market declined 10% but did not subsequently fall into bear market territory. Whether the market recovers again from here and avoids a bear market remains to be seen, but at the very least the more surprising development based on historical patterns would have been a continued bull market rally without a 10% pause.
Source:
Stock Market Corrections: Unsettling But Not Unusual (PDF)
Fidelity Management & Research Company
By: Dirk Hofschire, CFA
May 21, 2010
http://personal.fidelity.com/products/pdf/stock-market-corrections.pdf
Posted by
David Templeton, CFA
at
9:29 AM
0
comments
Labels: General Market , Technicals
Tuesday, May 25, 2010
Are You A Contrarian Investor?
One question might be to determine if you are a contrarian investor. A recent MarketWatch article, The Bearish Bandwagon, noted that as of a couple of weeks ago, market timing newsletters were recommending investors allocate 80% of their Nasdaq-oriented portfolios to stocks. Today they are recommending minus 45%. The article notes, "this represents an extraordinary shift away from excessive bullishness to aggressive bearishness in a remarkably short period of time."
Posted by
David Templeton, CFA
at
12:43 PM
0
comments
Labels: General Market , Sentiment
Sunday, May 23, 2010
Markets Are Increasingly Volatile
According to Standard & Poor's:
"the number of days in the past year that the S&P 500 fell by 2% or more in a single day began to accelerate. Indeed, May 4 and May 6 were the two most recent times the 500 dropped 2% or more in a single session. In the past 12 months (ended May 14), the 500 fell by 2% or more 13 times vs. an average of seven per year since 1970. Of course, these readings are nowhere near the peak of 54 declines experienced in mid-2009 as a result of the megameltdown in equity prices."
Source:
Learning to Live with Increased Volatility
Standard & Poor's
By: Sam Stovall
May 17, 2010
http://tinyurl.com/28xa4a6
Posted by
David Templeton, CFA
at
11:33 AM
0
comments
Labels: General Market , Investments
Friday, May 21, 2010
Launching A New Era In Wealth Management
HORAN Capital Advisors expands on the value HORAN provides to current clients while advising on over $550 million in assets. HCA extends the expertise of HORAN’s wealth management practice by providing clients with superior market knowledge and a proven, sound approach to investment solutions.
The foundation for HCA was established by Jack Horan in 1948. By satisfying the needs of their clientele for over 60 years, HORAN Associates has grown to become one of the region’s largest privately held financial services companies. HORAN has over 6,500 clients in 40 states while managing diversified products for more than 500 companies and 170,000 individuals.
Posted by
David Templeton, CFA
at
10:30 AM
0
comments
Labels: Investments
Wednesday, May 19, 2010
Higher Yielding Bonds Tend To Hold Up Better In Rising Interest Rate Environment
Fidelity recently published a research report showing the impact on bond returns during one of the toughest periods for a bond investor: 1941 - 1981. During this stretch of time, intermediate treasury rates rose from .5% to over 16%. As detailed below, bonds that had higher rates tended to generate better returns over the early period of the '41 - '81 time period. The reason for this is bonds with higher coupons and or shorter terms returned cash to an investor sooner that could be reinvested at the then higher rates.
Investors have reason to worry about future prospects for bond returns—history shows that current low yields may be expected to result in below-average performance, especially if interest rates rise. Investors particularly concerned about the possibility of rising rates may want to diversify their fixed-income portfolios into less interest-rate sensitive sectors. However, the great bond bear market of 1941-1981 also offers some more comforting lessons as well. High-quality bonds are much less volatile instruments than stocks, and they do not lose that attribute during periods of rising rates. Even during a prolonged period of rate increases, owning bonds lowered the volatility and improved the risk-adjusted returns of an overall investment portfolio. As a result, investors may not look with much excitement at the near-term outlook for bond returns, but that doesn’t mean they should over-react by shunning bonds altogether.
For bond investors, pay attention to the maturity (better yet, duration) of the bond or bond portfolio. Additionally, staying invested on the shorter end of the bond curve could minimize the impact that a rising interest rate environment will have on a particular bond or bond fund's price.
Source:
Perspective on the Potential Downside for Bonds
Fidelity Management & Research Co.
By: Dirk Hofschire, CFA
April 23, 2010
http://personal.fidelity.com/products/pdf/perspective-potential-downside-bonds.pdf
Posted by
David Templeton, CFA
at
10:46 PM
0
comments
Labels: Bond Market
Sunday, May 16, 2010
A Lot Of Good Economic News Too
Industrial Production
- Industrial production jumped up at an annualized rate of 10.0 percent in April, following an upwardly revised 2.5 percent gain in March.
- Over the past 12 months, industrial production is up 5.2 percent, its highest growth rate since June 2000.
- The University of Michigan Index of Consumer Sentiment edged up in early May, increasing from an index value of 72.2 to 73.3.
- Both the current conditions and consumer expectations components posted modest increases, contributing to the overall increase.
- Total retail sales rose 0.4 percent (nonannualized) in April, following an upwardly revised 2.1 percent jump in March.
- Over the past 12 months, retail sales have risen 8.8 percent (their highest growth rate since July 2005).
- New orders for manufactured goods increased 1.3 percent (nonannualized) in March, following an upwardly revised 1.3 percent jump in February.
- New orders excluding transportation rose 3.1 percent in March and are now up 15.6 percent over the past year.
- The I/S ratio for manufactured goods continues to decline from its peak reading of 1.47 months in January 2009 to 1.27 months.
- The ISM’s Manufacturing Purchasing Managers Index (PMI) continued improve in April, increasing 0.8 index point to 60.4 (its highest level since June 2004), following a 3.1 point jump in March.
- The new orders index jumped up from 61.5 to 65.7 in April, continuing its rebound from an all-time low of 22.9 in December 2008.
- The production index rose 5.8 points to 66.9 during the month, marking its eleventh month above the diffusion index growth threshold of 50.
- The employment index surged to 58.5 its highest level since January 2005.
- Nonfarm payroll employment grew by 290,000 in April, topping expectations for roughly a 200,000 gain. Census hiring inflated April’s figure by 66,000, but private payrolls still increased 231,000 when discounting the government’s boost.
- Revisions to February and March figures were solid as well, tacking on an additional 121,000 jobs and leaving those months’ respective gains at 39,000 and 230,000.
- Jobs in goods-producing industries expanded by 65,000, and services expanded 166,000, its largest increase in over three years.
Economic Data Source: Federal Reserve Bank of Cleveland
Posted by
David Templeton, CFA
at
10:52 PM
0
comments
Labels: Economy , General Market
A Look At The Market Around The Presidential Election Cycle
Given the extent of potential tax increases in 2011 and sovereign debt issues, a strong market advance is not assured next year. In this environment, an investor should consider constructing the foundation of their investment portfolio in high quality companies.
Posted by
David Templeton, CFA
at
2:42 PM
0
comments
Labels: General Market , Technicals
Friday, May 14, 2010
The Two Sides Of Risk
You can completely avoid one or the other, or you can compromise between the two, but you can’t eliminate both. One of the prominent features of investor psychology is that few people are able to (a) always balance the two risks or (b) emphasize the right one at the right time. Rather, at the extremes they usually obsess about the wrong one . . . and in so doing make the other the one deserving attention.
During bull markets, when asset prices are elevated, there’s great risk of losing money. And in bear markets, when everything’s at rock bottom, the real risk consists of missing opportunity. Everyone knows these things. But bull markets develop for the simple reason that most people are buying – ignoring the risk of loss in order to keep from missing opportunity – just when elevated prices imply losses later. Likewise, markets reach their lows because most people are selling, trying to avoid further losses and ignoring the bargains that are everywhere.
Posted by
David Templeton, CFA
at
5:24 PM
0
comments
Labels: General Market , Sentiment
Thursday, May 13, 2010
Dividend Aristocrats Outperforming Year To Date
Posted by
David Templeton, CFA
at
11:14 PM
0
comments
Labels: Dividend Analysis
Sunday, May 09, 2010
Events Last Week Were An Excuse To Take Some Profits
Through the end of April, the only S&P sector trading near its October 2007 high is the staples sector. As the below table indicates, most sectors are still below their highs by double digit percentages. The S&P 500 Index itself remains over 24% below its October 2007 high.
In the recent edition of Standard & Poor's The Outlook, they note that, "no bull market since 1949 has lasted fewer than 24 months." So can this bull market run through March of 2011?
Disclosure: Long NSC
Posted by
David Templeton, CFA
at
8:51 PM
0
comments
Labels: Economy , General Market
Friday, May 07, 2010
Don't Let Government Dictate Whether One Is In Or Out Of The Market
As some readers of this blog know, ISI is a highly respected research and strategy group with many of its analyst top rated by independent outside sources. Tom's strategy team team has been rated #1 by Institutional Investor magazine for 7 straight years.
Tom notes investors should expect somewhat lower returns in their equity investments in the coming years. A part of this is a direct result of the government's action in this post bubble period. Tighter credit standards are being forced on financial institutions and consumers are attempting to reduce the leverage on their own balance sheets at the same time. He notes in the video that yield will become an even more important part of an investor's returns in the coming years versus just capital appreciation.
Lastly, Tom makes some interesting comments about the potential long term opportunities that exist in the emerging markets. He cautions there may still be some downside risk in those markets; however, long term value is present.
Posted by
David Templeton, CFA
at
8:24 PM
0
comments
Labels: Economy , General Market , International
Thursday, May 06, 2010
Does May 2010 Lead To A Repeat of March 2009
In the strong market advanced achieved since March of last year, investors need to be cautious in not letting emotions get in the way of sound investment decisions. If an investor was uncomfortable with the market environment in March last year and today were uncomfortable with their investments due to today's 1,000 intraday market decline, then an investor might want to consider lightening up on equities at this point in time keeping in mind equities are a long term investment choice.
As it turned out though, a majority of today's market decline was the result of an erroneous trade. For the trade in question, a trader selling shares of Procter & Gamble (PG) inadvertently entered the shares in billions versus millions. With Procter & Gamble being a Dow component, the 37% drop in P&G's stock contributed about 170 points to the Dow's decline. 3M (MMM) fell over $18 and represented over 140 points in the Dow's decline.
Without a doubt there are some uncertain market events in play at the moment, specifically events in Greece and the potential contagion in the sovereign debt markets. From a fundamental perspective though, the U.S. market does not seem to be extended on a valuation basis. Bottom up 2010 earnings for the S&P 500 Index are estimated at $81.06. This represents a projected P/E ratio for the S&P Index of just under 14. Top down 2010 earnings estimates are $65.37 and equates to a P/E multiple of 17. The market is not cheap, but it is does not appear expensive either.
Below are a couple of charts that display a few technical aspects of the market as it relates to the percentage of S&P 500 stocks that are trading above their 50 day and 150 day moving averages. These percentages have decline quite a bit from a few months ago.
Posted by
David Templeton, CFA
at
11:56 PM
0
comments
Labels: General Market
Tuesday, May 04, 2010
Dividend Payers Outperforming Through April
Data source: Standard & Poor's
Posted by
David Templeton, CFA
at
10:50 PM
0
comments
Labels: Dividend Return
Sunday, May 02, 2010
The Beginning Of May And The Market
Source:
Stocks: Sell in May?
Bloomberg BusinessWeek
April 27, 2010
http://www.businessweek.com/investing/insights/blog/archives/2010/04/stocks_sell_in_may.html
Sell in May and Go Where?
The Outlook
By: Sam Stovall
May 5, 2010
http://www.spoutlookonline.com/NASApp/NetAdvantage/mkt/OutlookMarketInsight.do?subtype=OWMO&pc=NET&tracking=NET&context=Company&docId=15400443
Posted by
David Templeton, CFA
at
11:43 PM
1
comments
Labels: General Market , Technicals