Saturday, December 31, 2011

Moderate Inflation Benefits Equities

During moderate periods of inflation, equities tend to generate decent performance results. I posted the below chart in a post, Where To Invest In An Inflationary Environment, in mid 2010 that details the performance of various investment categories based on different inflation ranges going back to 1972.

From The Blog of HORAN Capital Advisors

Since mid year 2010 inflation has been trending higher with the latest year over year report showing inflation running at nearly 3.5%.
From The Blog of HORAN Capital Advisors

The blog at Crossing Wall Street selected the below chart as the Overlooked Chart of the Year. The chart compares the S&P 500 Index to the market’s expectation for inflation (the 10-year TIP spread). Of late, there has certainly been a high correlation to higher inflation expectations and the S&P 500 Index return.

From The Blog of HORAN Capital Advisors

Determining the true level of inflation is also a frequent topic. The Shadow Government Statistics (SGS) site makes an effort to track data on indexes when the calculation methodology is changed. In 1990, the CPI calculation was changed and a comparison of the current CPI versus the 1990-based calculation can be found on the SGS site.


Friday, December 30, 2011

Equity Performance in 2011

With the close of trading today, following is a quick look at the 2011 price performance of a few select equity markets around the globe.

From The Blog of HORAN Capital Advisors
Source: Reuters


Monday, December 26, 2011

Watching The Valuation Of Dividend Payers

The investment mantra this year has been to focus on dividend paying stocks. Over the long run, payers have had a tendency to outperform the non payers and this has certainly been the case this year. On the other hand though, valuations do matter and the below chart provides investors with a cautionary view of simply buying "any" investment that has yield.

From The Blog of HORAN Capital Advisors


Saturday, December 17, 2011

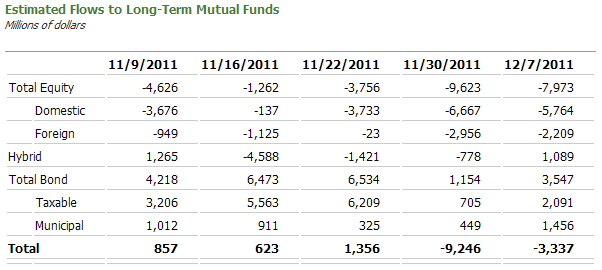
Investors Favoring Bond Funds

Recent mutual fund flow data shows investors continue to favor bonds over equities.

From The Blog of HORAN Capital Advisors
Source: ICI
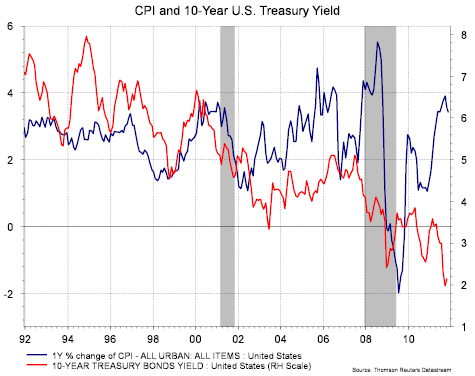
With the sovereign debt issues in Europe top of mind for investors, they continue to bet the best of the worst fixed income investments are U.S. Treasuries. One risk investors face with fixed income investments is the negative impact of a rise in rates. The 10-year U.S. Treasury yield is a meager 1.85% in spite of the fact the consumer price index is running at a year over year rate of 3.4%. Investors are in for a rude awakening when rates do begin to move higher (bond prices have an inverse relationship to the move in interest rates).

From The Blog of HORAN Capital Advisors


Thursday, December 15, 2011

Fragile Employment Market

The improvement in the unemployment rate earlier this month was certainly positive on the surface. The rate declined to 8.6% from the previously reported 9%. The improvement though came largely from the 300,000 individuals that simply stopped looking for a job. As a result, these additional people are not counted among the unemployed. As the below chart shows, the number individuals not in the labor continues to rise.

From The Blog of HORAN Capital Advisors

This fragile state of the consumer also shows up in the number of individuals on food stamps.

From The Blog of HORAN Capital Advisors


Sunday, December 11, 2011

Dividend Aristocrat Changes For 2012

Going forward S&P has changed the methodology on how they determine which companies qualify as Dividend Aristocrats. S&P notes they will only count regular dividend payments when determining the calendar year total dividend payments of a company. Special cash dividends will no longer be considered.

The table below contains a list of Standard & Poor's Dividend Aristocrats for 2012. The rebalance will take place at the market's close on December 16, 2011. The green highlighted companies are the additions and the yellow highlighted company is the deletion. S&P has added ten new Aristocrats while eliminating one, CenturyLink, Inc.


Barron's Income Investing Blog highlights some year to date dividend comments from Howard Silverblatt, Senior Index Analyst for S&P:
  • Year-to-date (YTD) dividend payers in the S&P 500 have returned 1.72%, compared to the non-payers loss of 4.63%.
  • The actual dividend payment YTD is up 16.2%.
  • The indicated dividend rate (based on the current rate) is up 16.8% YTD, but still off 4.9% from the June 2008 high.
  • From 1995 the S&P 500 indicated dividend yield has averaged 43% of the U.S. 10-year Treasury note, the current rate is 105%.
  • 215 issues have a current yield higher than the 10-year Treasury.


Disclosure: Long ABT, APD, ADP, BDX, CTL, CB, BEN, GPC, ITW, JNJ, LOW, MCD, NUE, PG, WMT


The Need For Cutting Spending In Washington

Much of the rhetoric coming out of Washington is focused on the need for more revenue, specifically from individual tax payers. The millionaire tax discussion is emblematic of this focus. As the below chart shows though, individual tax receipts into the U.S. Treasury are up 22% on a year over year basis through the end of September with overall receipts up nearly 7%.

From The Blog of HORAN Capital Advisors

Additionally, individual receipts for the government are near the level received in 2007. On the other hand, government spending has grown 2% on a year over year basis.

From The Blog of HORAN Capital Advisors

From The Blog of HORAN Capital Advisors

In short, Washington needs to have a greater focus on cutting spending, while at the same time promoting policies that are favorable to businesses to enable greater employment growth.


Sunday, December 04, 2011

Future Strength In Retail Sales?

A common view from pundits on the strength in retail sales on Black Friday and Cyber Monday is much of the increase represented consumers buying forward. In other words, the common take on the strong sales report was it likely won't continue into December. If history is any guide, the below chart might indicate additional retail sales growth is likely for the balance of the weeks leading up to Christmas.

From The Blog of HORAN Capital Advisors

The dollar value of total cyber sales increased 22% versus last year and dollars spent per buyer increased 9%.

From The Blog of HORAN Capital Advisors

Since consumers account for 70% of GDP, these retail sales figures suggest Q4 GDP could surprise on the upside.

Source:

comScore
Cyber Monday Spending Hits $1.25 Billion to Rank
as Heaviest U.S. Online Spending Day in History

November 29, 2011
http://www.comscore.com/Press_Events/Press_Releases/2011/11/Cyber_Monday_Spending_Hits_1.25_Billion


Many Corporate And Consumer Positives

I noted in a post a few weeks ago about the positive trend in the JOLTS (Job Openings and Labor Turnover Survey) report which was released by the US Department of Labor and indicated job openings, as of the end of September, were at their highest level since 2008. Additionally, jobless claims, a key leading indicator, have now moved below 400,000 on a four-week moving average basis, which signifies an improving job market. The ADP Private Payroll report showed a 206,000 job gain in November, well above estimates and the best reading since March 2010. The broader November jobs report indicated the US economy added 120,000 jobs and that the unemployment rate declined to 8.6% from 9.0%, the lowest rate since March 2009.

On the corporate side the October Index of Leading Economic Indicators rose 0.9%. This was the sixth monthly increase in a row. Nine of index’s 10 components saw increases for the first time since May of 2003. As noted by the conference board,
“the LEI is pointing to continued growth this winter, possibly even gaining a little momentum by spring. The lack of confidence has been the biggest obstacle in generating forward momentum, domestically or globally. As long as it lasts, there is a glimmer of hope.”
From The Blog of HORAN Capital Advisors

Other positive corporate data points:
  • Industrial production rose 0.7% in October
  • Chicago PMI rose to 62.6 from 58.4, a seven-month high, and the new orders component rose to its highest level since March at 70.2
  • The Institute for Supply Management’s (ISM) Manufacturing Index rose to 52.7, the highest level since June
  • New orders increased to 56.7 from 52.4
Lastly, a number of our articles are republished by SeekingAlpha. Yesterday they republished our post, Market Driven By Emotions Versus Fundamentals. What was interesting is the number of bearish comments (contrarian indicator?) and one comment about the macro environment having a controlling influence on the markets direction.

The biggest potential market negative seems to be the debt crisis in the Eurozone. On the other hand, the economic environment in the U.S. continues to improve in spite of the downward revision to third quarter GDP from 2.5 to 2.0. The revision was largely attributable to a decline in private inventories, which reduced overall GDP by 1.55 percentage points. This type of revision likely means higher growth in Q4 and into early 2012 as businesses have to rebuild inventory levels to keep up with what appears to be improving demand. Our post, Market Driven By Emotions Versus Fundamentals, details some of this demand by touching on the strength in retail sales on Black Friday and Cyber Monday.

From The Blog of HORAN Capital Advisors

From The Blog of HORAN Capital Advisors

There are many positive data points for investors to consider. Certainly the issues in Europe, not to mention in Washington, are not to be made light of. However, the magnitude of the market's advance last week might be some indication of the attractiveness of U.S. equity valuations. Market volatility is high though, so investors should take a disciplined approach if they are building equity positions.


Friday, December 02, 2011

Market Driven By Emotions Versus Fundamentals

I write this shortly after the Dow Jones Industrial Average rockets higher by nearly 500 points, or 4+%, in just one day, I think back to the concerns raised in recent interactions with some investors expressing concern about the market’s volatility. In August and September, 40% of the trading days in the S&P 500 Index saw daily price swings of plus or minus 2%. This level of volatility was last seen in the early 1930’s. Increasingly, the market seems to be trading more on emotion than on company fundamentals. The rally at the end of November was fueled by the announcement that central banks around the globe would provide a liquidity back stop for the European debt issues. The European crisis is contributing to investors trading on short-term emotion while they worry about a repeat of the negative performance seen in 2008 and 2009. One can certainly see similarities; however, we believe there are more recognizable and important differences.

Liz Ann Sonders, Chief Investment Strategist at Charles Schwab noted in a recent report,
“the problems in the eurozone are nothing new: too much debt from eurozone member countries to over-leveraged European financial institutions. Adding to the woes is the lack of global competitiveness among many of the zone's members, thanks to the tying of 17 vastly different economies and policies to one (too-strong) currency. The lack of a single fiscal authority within the eurozone that's capable of enforcement or supervision has allowed the problems to fester and the can to be continually kicked down the road (emphasis added).”
There are many differences in Europe’s problems now and the subprime crisis in the U.S. in 2008. On the positive side, much was learned from the crisis in the U.S. and one outcome is the banks in the U.S. are much better capitalized today. Additionally, the crisis in Europe is one of a top down crisis versus the U.S. crisis which started at the bottom with Lehman Brothers, etc. In short then, European governments have a little more time in crafting a solution.

For investors, we recommend focusing on the fundamentals both economically and at the company level. Economically in the U.S., the data continues to come in better than expected. The November ISM manufacturing index report was stronger than expected (52.7 vs. 51.8) and joins a growing list of indicators that suggest moderate economic growth in the fourth quarter of around 3%. Retail sales on Black Friday exceeded expectations and cyber Monday sales were up a better than expected 24%. The labor market continues to show improvement as can be seen in the below charts: ADP’s Private Employment change for November continues to show improvement and announced corporate layoffs continue to decline.

From The Blog of HORAN Capital Advisors

From The Blog of HORAN Capital Advisors

At the company level, valuations for U.S. equities continue to look more attractive. The below chart represents a broader market P/E measure. The NIPA P/E ratio measures earnings from the GDP calculation and divides it into the S&P 500 Index. Using this measure, valuations are at levels last seen in the early 1980’s. In addition to attractive P/E valuations, corporate balance sheets have record levels of cash. This cash is being returned to shareholders in the form of higher dividend payments and stock buybacks.

From The Blog of HORAN Capital Advisors

In conclusion, the economic data continues to come in better than expected and stock valuations are attractive. Certainly, the news coming out of Europe is going to be market moving and volatility will likely remain high. However, in the longer term, company fundamentals will be the ultimate guiding force for future equity valuations and fundamentals look strong.