Saturday, October 30, 2010

Most Of Market's Gains Occur From November Through April

In general most of the gains on the S&P 500 Index ($SPX) occur in the period from November through April. This is one reason technical analyst indicate investors sell their equity holdings in May, i.e., "sell in May and go away until November." As Chart of the Day notes:
"...investing in the S&P 500 from the last trading day in October (therefore referred to as the Halloween indicator) through the end of April accounted for the vast majority of S&P 500 gains since 1950. While there are some noteworthy periods during which the Halloween indicator didn't produce (e.g. during the oil embargo of 1973-74, the dot-com bust of 2000-01, and the financial meltdown of 2007-2009), the overall out performance is compelling."
From The Blog of HORAN Capital Advisors


Gridlock In Washington And The Market's Performance

If one believes history has a way of repeating itself or at least looking similar, investors might hope that the Republicans gain control of the Senate as well as the House next Tuesday. We have noted on page 4 of this link that the third year of a presidents term in office tends to be the strongest from a stock market perspective; however, this might hinge on the makeup of Congress.

Many prognosticators are already projecting control of the House of Representatives will swing to the Republicans. The prediction website, Intrade, is showing that the odds of the Republicans taking control of the House has increased to nearly 92% versus under 20% at the beginning of 2009.

From The Blog of HORAN Capital Advisors
Source: Intrade

Additionally, Ireland's largest bookie, Paddy Power, has paid gamblers early that bet the House would go Republican noting "there would be nothing short of a miracle for the Democrats to maintain control of the House."

As the below table shows, in an environment where control of Congress is split between Republicans and Democrats, and the presidential party is Democratic, the market's performance has been its worst since 1900. In an environment where the Republicans control both Houses of Congress and there is a democratic president, historically, this has been an environment where the market generates some of its best returns.

From The Blog of HORAN Capital Advisors

S&P surmises that one reason the market does not perform well when Congress is split is due to the fact the market's do not like uncertainty. With a split Congress there does tend to be less accomplished in Washington. One thing seems certain at this time and that is the country needs to get control of the spending coming out of Washington. This will require some difficult decisions to be made in Washington in the coming year and a split Congress might prevent the hard decisions from being made.


Thursday, October 28, 2010

A Few Things On Our Mind In This Market Environment

By and large we have been positive on the markets since mid summer as our prior posts and newsletters have noted. A number of factors contributed to our positive market bias including attractive large cap stock valuations and our belief the economy was/is not going into a double dip recession. Since July of this year, the S&P 500 Index is up 15+% with most of the gain coming since the beginning of September. From September 1st through the close today, the S&P is up 10.8%. It is not reasonable to think the market can move higher by 10+% every two months. The market may not move higher by 10% every two months, but it seems individual stocks like Apple (AAPL) are trying.

So what is on our mind at this point in time as we evaluate the future direction of the market?
  • Mutual fund flows have seen strong flows into fixed income/bond funds over the last three years while at the same time investors have withdrawn funds from equity mutual funds. However, over the last two weeks, equity funds are finally experiencing positive in flows. primarily international equities. The question then is whether investors are now beginning to buy bequonds near a top?

From The Blog of HORAN Capital Advisors

Source:ICI
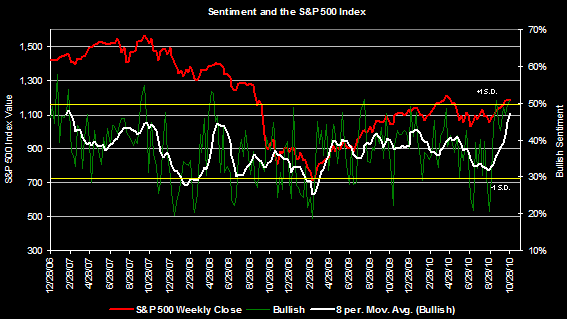
  • Individual investor sentiment as reported by the American Association of Individual Investors indicates bullish sentiment is beginning to move in to an overly bullish zone. Bullish investor sentiment has increased from 24.68% at the beginning of July to 51.23% reported this week. The long term average for the bullishness level is 39% with an 11% standard deviation. The bull/bear spread stands at 30% and has been as high as 75%.

From The Blog of HORAN Capital Advisors

  • As our third quarter newsletter touched on, market sentiment resulting from a change of control in congress seems to be weighing positively on the market as well. The question then becomes, how much of a potential Republican majority is factored into current stock prices. What are the market implications if the outcome is not as expected. As many investors know, the markets trade on expectations and surprises can be market moving.
At the end of the day, we believe investors need to focus on fundamentals and valuations at this point in time. One could say this should always be the case and they would be right. However, there are times when the market favors momentum based stocks and pushes them higher regardless of valuation.
The markets have a lot to digest over the next several months:
  • election outcome
  • expiration of the Bush tax cuts: higher taxes for consumers while consumer spending accounts for 70% of GDP.
  • impact of a lame duck Congress


Wednesday, October 27, 2010

Smart Money Anticipating Higher Interest Rates?

Yesterday, Goldman Sachs (GS) issued a 50-year corporate bond with a coupon yield of 6.125%. Due to the strong investor demand the issued amount was increased from the originally anticipated $250 million. I would say Goldman is expecting higher interest rates in the not too distant future.

From The Blog of HORAN Capital Advisors
Source: Reuters


Tuesday, October 19, 2010

S&P 500 Index Forms Inverted Head & Shoulders Stock Chart Pattern

Over time fundamental factors will determine the longer term direction of stocks and the stock market. On a short term basis though, technical factors can lead to self fulfilling outcomes as enough investors do trade on technical market data.

The recent price action of the market has resulted in the S&P 500 index's chart pattern to resemble an inverted head and shoulders. This pattern tends to be a bullish indicator for future market advances. With the inverted pattern though, volume tends to be a more critical element in determining whether the pattern's anticipated outcome is achieved. As the below chart does show, both the left and right shoulder have been formed on each side of the head pattern. What appears to be missing is the volume on the right shoulder formation.

From The Blog of HORAN Capital Advisors
Upside resistance for the market is around 1,218. Additionally, the 50 day moving average is getting close to crossing the 200 day moving average from below. This cross is know as the golden cross and can be an indication of further market advances as well. Investors should keep in mind that the golden cross and death cross indicators have mixed predictive results.

Lastly, we are approaching the third term of the presidential cycle and the third year of the cycle tends to be one in which the market has its best performance. We highlighted some of the election data in our third quarter newsletter. In addition to the election cycle, we are entering the buy period in the "sell in May and Go Away" seasonal indicator. This indicator suggests selling stocks in May and re-buying them in November. Below is a chart from an earlier post I wrote at the beginning of May this year, The Beginning of May and the Market.

From The Blog of HORAN Capital Advisors
Given the market's strong advance since the end of August a little market consolidation, like experienced today, is to be expected.


Sunday, October 17, 2010

Third Quarter Investor Insight Newsletter

The S&P 500 Index ended up 8.9% for September and 11.3% for the third quarter. It was the market's best September since 1939. Ironically, this strong quarter was achieved in the face of mixed fundamental data. The Philadelphia Fed reported in August that 36 forecasters now see the economy looking less favorable than they thought just three months prior.

Third quarter GDP has been revised down to 2.3% from 3.3% (the second quarter was also revised down from 2.4% to 1.6%) and most economists agree the labor market shows little to no signs of improvement. One might assume historically low mortgage rates would stimulate the housing market but, in fact, housing inventories continue to rise and consumers continue to save and reduce debt. As an important aside, consumer spending accounts for 2/3 of the economy. However, we suspect economic data has presented just enough hope that a double dip recession is unlikely, hence, the bullish quarter.

View the complete Quarterly Investor Letter with market insights.

More information on HORAN Capital Advisors can be found at www.horancapitaladvisors.com.


Retail Sales Higher In September and Inventory To Sales Higher

The U.S. Census Bureau reported advanced retail sales figures for September this past Friday. The preliminary results show retail sales rose .6% for the month while at the same time, the August sales figures were revised higher to +.7% from +.4%. Sales did get a lift from an increase in the automobile sales category; however, sales ex auto were still up +.4%.

Also business inventories and sales were reported on Friday. The total business inventories/sales ratio at the end of August was 1.27 which is lower than the August 2009 ratio of 1.31.

From The Blog of HORAN Capital Advisors

Core CPI remains flat and will give the Fed justification for more quantitative easing (QE2) in an effort to stimulate stronger economic growth at the expensive of higher inflation. QE has consequences as well.

In short, with the continued reporting of mixed economic data, one thing seems certain and that is economic growth is not occurring at a blistering pace. On the other hand, a double dip recession seems fairly remote at this point in time. Throw in the fact the U.S. has a mid term election in November, the election outcome could impact consumer confidence and future economic growth. The recent positive returns in the equity markets might be discounting this outcome though.


Thursday, October 14, 2010

The Potential Consequences of Quantitative Easing And A Weaker U.S. Dollar

As the Federal Reserve continues to push quantitative easing and a resultant weakening of the U.S. Dollar, following is what John Maynard Keynes had to say about this in his writing, The Economic Consequences of the Peace.
"Lenin is said to have declared that the best way to destroy the capitalist system was to debauch the currency. By a continuing process of inflation, governments can confiscate, secretly and unobserved, an important part of the wealth of their citizens. By this method they not only confiscate, but they confiscate arbitrarily; and, while the process impoverishes many, it actually enriches some. The sight of this arbitrary rearrangement of riches strikes not only at security but [also] at confidence in the equity of the existing distribution of wealth.

Those to whom the system brings windfalls, beyond their deserts and even beyond their expectations or desires, become "profiteers," who are the object of the hatred of the bourgeoisie, whom the inflationism has impoverished, not less than of the proletariat. As the inflation proceeds and the real value of the currency fluctuates wildly from month to month, all permanent relations between debtors and creditors, which form the ultimate foundation of capitalism, become so utterly disordered as to be almost meaningless; and the process of wealth-getting degenerates into a gamble and a lottery.

Lenin was certainly right. There is no subtler, no surer means of overturning the existing basis of society than to debauch the currency. The process engages all the hidden forces of economic law on the side of destruction, and does it in a manner which not one man in a million is able to diagnose."
As the below chart shows, the U.S. government is doing a pretty good job of debauching the U.S. Dollar.

From The Blog of HORAN Capital Advisors

As noted in a post I wrote in mid 2009, there can be short term positive implications for multinational U.S. companies as a result of a weaker U.S. Dollar. The problem is if many other countries are trying to force their currencies lower as well, it becomes a race to the bottom.

h/t: Ned Davis Research


Monday, October 11, 2010

Analysts Lower Earnings Expectations For S&P 500 Index In Q3

The earnings season for the third quarter is now underway and it seems analysts have lowered their expectations for earnings. Although expectations have been lowered, earnings are still estimated to increase by 24% compared to Q3 2009. Three of the S&P 500 sector earnings were revised higher, i.e., industrials, technology and consumer discretionary.

From The Blog of HORAN Capital Advisors
  • Quarter to date 30 companies have reported earnings with 80% exceeding expectations and 7% meeting expectations. 13% of the companies earnings reports were below analyst expectations.
  • The ratio of negative-to-positive pre-announcements for the S&P 500 for Q3 2010 is 2.0. This ratio is slightly below the long-term average of 2.1.
  • The forward four-quarter (Q410 – Q311) P/E ratio for the S&P 500 is 12.7, below the average forward four-quarter P/E ratio of the previous 52 weeks (13.7).

From The Blog of HORAN Capital Advisors

As the quarter unfolds, company comments regarding their future outlook is one piece of news we will be evaluating in determining the sustainability of this market advance.


Tuesday, October 05, 2010

The Stock Market Might Be Anticipating An Improvement In Consumer Confidence

The market's strong advance in the third quarter of this year, up over 11%, may be occurring in anticipation of improved consumer confidence later this year and into 2011. The improvement in confidence may be tied to the results of the mid term elections in November.

The importance that is placed on consumer confidence is valid from the standpoint that consumer confidence tends to lead the direction of the stock market. Consumer confidence does have a direct impact on consumer spending. And with consumer spending accounting for over 70% of GDP, improved consumer confidence and a concurrent improvement in consumer spending, an improvement in economic activity likely follows.

From The Blog of HORAN Capital Advisors

In recent discussions with business owners, accountants and attorneys, one theme that is repeated frequently, is the fact businesses are not making hiring or expansions plans due to the uncertainty surrounding future costs related to taxes and health care regulation. If a change in control of Congress provides more clarity on the regulatory environment, this could positively impact business expansion and hiring plans.

From The Blog of HORAN Capital Advisors
Source: Gallop

As I noted in a post about a month ago, a change in control with Congress can have a positive impact on the economy and the stock market. The below chart shows the current market advance relative to the market returns achieved after the midterm elections in 1994, when a democratic congress switched to a republican majority.

From The Blog of HORAN Capital Advisors

Given recent polling data, it seems probable that we will see a change in control of congress in the mid term election this year as well. After the 1994 midterm, the market advanced over 34% in 1995. For investors, an important question is how much of the market's recent advance is pricing in this potential election outcome. Further, if a change in Congress is not realized it is likely the market will not react favorably.


Monday, October 04, 2010

All Eyes On The Friday Employment Report

One primary reason cited for a choppy start to this week's market is the anticipation surrounding Friday's employment report. If the report is anything like recent mixed economic reports, it will not provide clarity on the economy's future direction. The job environment is one reason for the tepid economic recovery. As the below chart shows, consumption accounts for over 70% of GDP. If consumers are unemployed and/or spending more frugally, GDP or economic growth will be constrained.

From The Blog of HORAN Capital Advisors

In spite of this mixed economic environment, the market's advance in the third quarter can be characterized as one in which it climbed a wall of worry; however it wasn't a steady climb higher.

From The Blog of HORAN Capital Advisors

From a pure technical standpoint, the market's recent action seems to show it is attempting to form a base near the 1,118 level on the S&P 500 Index. Of some concern is several of the technical indicators are rolling over, i.e., stochastic oscillator and the MACD. The On Balance Volume (OBV) indicator has been in a longer term downtrend since early May as well. The numerical value of the OBV is not important, but rather the direction of the line. Investors should focus on the OBV trend and its relationship with a security's price. In short, one should expect the market to digest gains achieved in the third quarter. Support can be found at the 200-day moving average on the S&P 500 Index around 1,118.

At HORAN Capital Advisors, we remain cautiously optimistic about the market. An anticipated near term pullback will likely give investors an opportunity to work some cash into equities before the November elections in the U.S.


Sunday, October 03, 2010

Dividend Payers Had Respectable Showing In September

In a strong market like that experienced in the month of September, the dividend payers in the S&P 500 had a respectable showing versus the non-payers. The average return for the payers was 6.77% versus 7.51% for the non-payers. Year to date though, the dividend payers continue to outperform the non-payers and the broader S&P 500 Index as detailed in the table below.

From The Blog of HORAN Capital Advisors
During the month S&P reports,
  • 483 of the stocks in the index generated a positive return.
  • 237, or 47%, of the index stocks had a return that was greater than 10%.
  • September's price return of return of 8.76% was the best since the index returned 16.46% in September 1939.
  • the best performing sectors achieving double digit returns were technology (+12.11%), Industrials (+11.20%) and Consumer Discretionary (+11.00%.)
The first trading day in October (Friday) saw the market move higher by .44%. This coming week will see many investors focused on Friday's non-farm payroll report. A strong recovery would see payrolls increases around 250,000. The economy is far from this figure at the moment.