Thursday, September 23, 2010

Will Dividend Increases Follow An Increase In Stock Buybacks?

As I noted in an earlier post, recently released data by Standard & Poor's shows companies have increased their stock buyback activity in the 2nd quarter of 2010. S&P reported a YOY 220% increase in Q2 2010 buybacks. During this same time period, dividend increases have equaled 5.9%. Given this improved buyback activity at HORAN Capital Advisors, we believe companies that exhibit stong cash flow will also begin rewarding their shareholders with increased dividend payments as the economy gains a firmer footing.
From The Blog of HORAN Capital Advisors


Tough Environment For Consumers

Following is an excerpt by Bill Simon, Wal-Mart Stores' (WMT) President, CEO of Wal-Mart US. This was delivered at Goldman Sachs (GS) Retail Conference:
"Our customers are focused on their savings, and they need us now more than they ever have. Unemployment, we all know, remains mid-9s and doesn't appear to be going anywhere quickly. Gas prices are high. They don't appear to be going anywhere. We need to figure out how to operate in this environment.

The paycheck cycle we've talked about before remains extreme. It is our responsibility to figure out how to sell in that environment, adjusting pack sizes, large pack at sizes the beginning of the month, small pack sizes at the end of the month. And to figure out how to deal with what is an ever-increasing amount of transactions being paid for with government assistance.

And you need not go further than one of our stores on midnight at the end of the month. And it's real interesting to watch,about 11 p.m., customers start to come in and shop, fill their grocery basket with basic items, baby formula, milk, bread, eggs, and continue to shop and mill about the store until midnight, when electronic -- government electronic benefits cards get activated and then the checkout starts and occurs. And our sales for those first few hours on the first of the month are substantially and significantly higher.

And if you really think about it, the only reason somebody gets out in the middle of the night and buys baby formula is that they need it, and they've been waiting for it. Otherwise, we are open 24 hours -- come at 5 a.m., come at 7 a.m., come at 10 a.m. But if you are there at midnight, you are there for a reason. And we have to look at that and we have to watch that and we have a commitment to serve those customers who need that. And we are very, very focused on that."


Wednesday, September 22, 2010

Standard & Poor's Reports Jump In Stock Buybacks

Today S&P reports that stock buybacks in Q2 2010 jumped 220.9% versus the record low reached in the second quarter of 2009. On a sequential basis buybacks were up 40.5% to $77.64 billion in the second quarter of this year. Factoring in dividends, the buyback + dividend yield is 4.43% at the end of Q2 and this compares to 3.38% in Q1.


Friday, September 17, 2010

More Confirmation Investors Increasing Bond Allocation

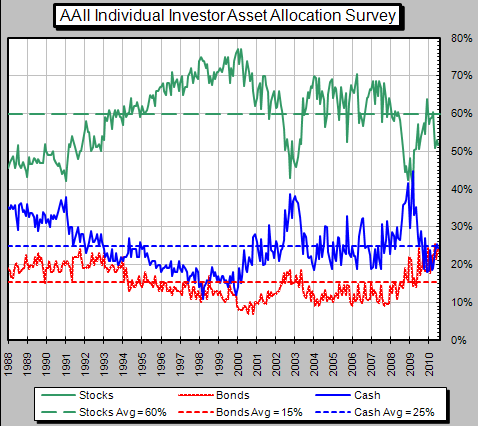
Below is a chart from the American Association of Individual Investors that summarizes investors current asset allocation. The data included in the chart is updated at the end of each month by AAII. As the chart shows an investors bond allocation at 21% is above the longer term average of 15%. Additionally, the equity allocation is down to 55% or 5% below the 60% longer term average.

From The Blog of HORAN Capital Advisors
The AAII data supports the mutual fund flow data we have outlined in prior posts. Below is a chart that shows the flow of funds into bond mutual funds and out of equity funds. This is the opposite of what occurred at the top of the market in 2000.

From The Blog of HORAN Capital Advisors

As the below chart of the iShares Barclays 20+ year Treasury ETF (TLT) shows, the price has broken support.

From The Blog of HORAN Capital Advisors

A declining price means higher interest rates. If rates would continue to move higher, bond prices would adjust lower. With inflation working its way into the pipeline, and who knows what happens in November (could be bullish for stocks and bearish for bonds), inflation seems a greater threat than deflation.


Thursday, September 16, 2010

Bullish Investor Sentiment Continues To Move Higher

In today's sentiment survey released by the American Association of Individual Investors, the weekly individual investor bullish sentiment increased seven percentage points to 50.89%. This bullish sentiment level compares to the yearly low of 20.74% that was reported in the last week of August. The bull/bear spread widened to 26.6%. In spite of the increase in bullish sentiment, the 8-period moving average remains in the mid thirty percent range, i.e., 36%. The 8-period moving average has been as high as the upper 50% to lower 60% range at prior market tops.

From The Blog of HORAN Capital Advisors


Sunday, September 12, 2010

The Dividend Paying Stocks In The S&P 500 Index

In a recent Bloomberg article, Phillip Cruz provides a list of the dividend yield stocks in the S&P 500 Index. The notes the list is arranged as follows:
The yield is calculated by taking the latest declared dividend, annualized and divided by the stock price. Payout ratios are calculated based on latest quarterly dividend paid divided by earnings. The data is first sorted by the industry name alphabetically and then by the yield in descending order. Dividends are paid on a quarterly basis unless noted.


Saturday, September 11, 2010

Market Continues To Trade In A Range

For the last 3-4 months, the S&P 500 Index seems stuck in a trading range. Additionally, the trading volume during this time period continues to trend lower. Now that summer is officially over and and next week offers the first full week of trading since Labor Day in the U.S., more clarity may be forthcoming in the market's future direction. If the S&P can break through resistance at the 1,130 level a more sustainable rally might be at hand. The coming week may be more volatile due to Friday's quadruple option expiration day.

From The Blog of HORAN Capital Advisors

The percentage of stocks trading above their 50 day average stands at 72% which is off the summer lows around 5%. Still, this percentage remains below those achieved at prior market highs when this percentage was over 90%. A lower percentage of stocks are trading above their 150 day moving average, 52%.

From The Blog of HORAN Capital Advisors

For investors looking at broader market movements, watching the stochastics indicator in the first chart is a technical indicator that can provide some insight into the market's potential future direction. This indicator is best used to determine overbought/oversold levels. No one indicator provides a certain answer, but it is one indicator that investors might use in this trading range market.


Friday, September 10, 2010

U.S. Budget Deficit or Surplus

At some point in the not too distant future, the U.S. budget deficit needs to be brought under control. Stronger economic growth is a key to this gap being closed.

From The Blog of HORAN Capital Advisors


Thursday, September 09, 2010

Inflation and Equity Valuations

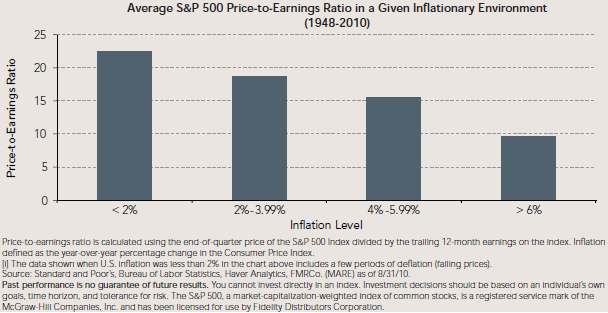
Of some concern at this point in time is what will be the future rate of inflation. The concern with inflation is its impact on the expected returns for stocks and bonds. For stocks, higher levels of inflation will reduce the value of future earnings since those future earnings will be worth less in present value dollar terms. Because of this lower value of earnings, one can expect the price to earnings ratio (or P/E) to contract. From an investment perspective this is will be a headwind for stock prices as PE multiples will tend to contract.

At HORAN Capital Advisors, we do believe inflation will be a factor investors will need to contend with in the not to distant future. This being the case, what impact might this have on stock returns and valuations going forward? As I have noted in prior posts, specifically, Inflation in the Pipeline and Relating Company Fundamentals To The Dividend Discount Model, inflation does have an impact on stock valuations. An important question then becomes what level of inflation can an investor expect and what will be the impact on stock valuations. At HORAN we do believe inflation will be an issue in the future that investors need to factor into their expected stock returns. We do not believe we will see an environment where we get hyper inflation though.

At today's valuations and moderate expected levels of inflation, stock valuations do seem to be trading at valuations levels below historical averages. Fidelity recently published a research article noting where stocks might trade at various levels of inflation.

From The Blog of HORAN Capital Advisors
We would agree with Fidelity's assessment of the current valuation environment:
As of July 2010, year-over-year inflation stood at 1.3%, while the S&P 500’s P/E ratio (using trailing 12-month earnings) was 15.6 as of August 2010—somewhat below the index’s historical average (17.7).

Using earnings forecasted over the next 12 months (to August 2011) the market’s P/E ratio was 14.1 as of the end of August—also below the index’s long-term average. Thus, given the low current level of inflation and both trailing and forward-looking measures of earnings, the stock market’s current valuation is somewhat below historical norms.
Inflation becomes a more serious problem for investors if/when the economy begins to show better growth. Not that politics drives the economy; however, the policies coming out of Washington over the last two years have not been pro-growth. With a likely change in the control of Congress in November, sentiment and gridlock might be a positive attribute for higher stock prices and a stronger economy. Consumer and investor sentiment historically have had a strong influence on the economy and the market.


Monday, September 06, 2010

More Stimulus and More Debt

Today President Obama announced a $50 billion infrastructure stimulus plan that he hopes will create new jobs during this slow economic recovery. He also proposed creating an "infrastructure bank" where the government would decide which projects are worthy of federal funding. Having the federal government take over more control of a segment of the private sector is concerning. The infrastructure bank will be on top of the federal government's additional control over health care and the automobile industry. Historically, projects/expenses that are controlled by the government sector have been done in a less efficient manner than the private sector.

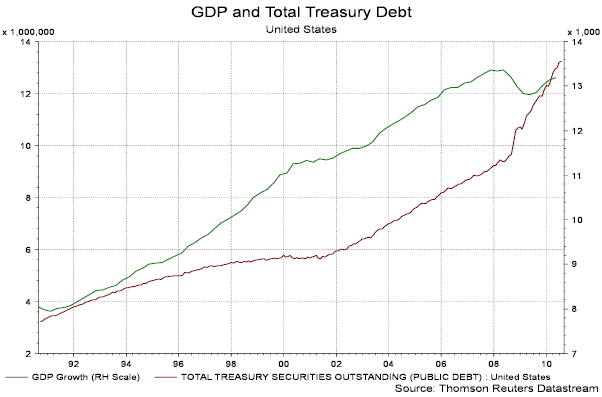
As the below chart details, the amount of total treasury debt, nearing $14 trillion, now surpasses the size of the U.S economy as measured by GDP. This trend in the debt is unsustainable and should be addressed sooner versus later.

From The Blog of HORAN Capital Advisors


Sunday, September 05, 2010

Emerging Markets Representing Larger Percentage of World GDP

The GDP of emerging markets continues to garner a increasing larger percentage of world GDP. In 1987 China was not one of the top ten countries by GDP weight; however, by the end of 2008 China accounted for 6.3% of world GDP. By 2030 it is projected that the BRIC countries will account for nearly 25% of world GDP.

From The Blog of HORAN Capital Advisors
Source: MSCI

At the end of 2009, the US accounted for 41.9% of the weighting the MSCI All Country World Index. This is down from 52.5% at the end of 2003.

From The Blog of HORAN Capital Advisors

For investors, allocating some investment assets toward the emerging markets will likely enhance ones returns; however, emerging market returns do tend to exhibit higher volatility. Additionally, the quality of economic and financial data from emerging countries tends to be less robust than that of the developed markets. One avenue investors can pursue to gain emerging market exposure is via multinational companies that are doing business in these countries. Many of the multinational firms have a stated goal of expanding their business activities in these higher growth countries.


Thursday, September 02, 2010

Dividend Payers Versus Non Payers Performance in August

Although the month of August saw the average return for the dividend payers in the S&P 500 Index trail the non-payers and the S&P 500 Index as a whole, on a YTD and 12-month basis, the payers continue to outperform. On a year to date basis, the average return of the payers equals -.62% versus -3.41% for the non payers. On an average return basis, the payers and non payers are outperforming the market cap weighted S&P 500 Index. The fact that the equal weighted returns are outperforming the market cap weighted returns continues to support the findings in the July 2010 report issued by Standard and Poor's.

From The Blog of HORAN Capital Advisors


Wednesday, September 01, 2010

Alternative Investments: Navigating Volatile Markets

The world has changed. Market volatility is here to stay and increased correlations are making investors less reliant on modern portfolio theory. These higher correlations are likely the result of the globalization of trade, the introduction and adoption of new investment vehicles, and quantitative trading programs. The lack of diversifying properties within asset classes, particularly equity, has caused serious reservations among investors about future prospects. A recent Barron’s article commented that mutual fund flows from January 2008 to June 2010 has nearly $600 billion dollars moving into bond mutual funds while nearly $250 billion has exited equity funds (chart below).

From Horan Capital Advisors Blog

Ramblings about bubbles forming in the bond market may have investors spooked but data would not suggest any near term outflows. Investors have opted for fixed income securities as more and more people become frustrated and disenchanted with equity returns. However, those same investors are starved for yield and now frequently reach to uncharted territory to satisfy income needs. Is lower quality or longer duration better? Which camp are we in, deflation or inflation? Is the double dip going to become a reality or is extended slow growth the next step? The common investor asks every day, “Where should I direct my investments?” Maybe he or she should be asking, “How do I invest to reduce overall market risks?”

Investors need strategy specific solutions which can provide consistent returns and hedge systemic risk. The environment for the past decade calls for such. The investment management community has heard those cries and responded quickly by providing alternatives in various wrappers: ETFs, ETNs, alternative mutual funds, structured products, and hedge funds. Clearly the adoption of these various vehicles has added to market variability but nevertheless, their intent is often times to provide hedged market returns within specific or multiple asset classes. These vehicles attempt to set predetermined return expectations. Some managers focus on absolute returns while others position for hedged but directionally long exposures. Regardless of which strategy, both intend to provide consistent and more predictable return streams.

Alternative investments, in their truest form, are unencumbered from trading constraints and provide intellectual freedom far beyond traditional money manager constraints. Example strategies: capital structure arbitrage, special situation events, long/short exposure, discretionary and systemic market trading. The global opportunity set truly becomes utilized as alternative investment managers act to expose market dislocations without traditional market boundaries. Alternatives are simply an expansion of an existing asset class or an investment intermediary between traditional asset classes to help facilitate acceptable balances between risk and return. Investors move between equity and fixed in a blurred or complimentary fashion via alternative investments. Managers must evaluate the means in which they assess market volatility relative to the fees they pay for risk-adjusted returns. For example, hedged equity has mostly long equity properties and should perform like long equity over a full market cycle but with significantly less market variability. Fixed income arbitrage and equity market neutral strategies should exhibit standard deviations equivalent to conservative fixed income securities as they hedge most market risk in an effort to achieve absolute returns conservatively higher than the risk free rate. A liquid alternative with compelling numbers in this category is the TFS Market Neutral Fund (TFSMX).

From Horan Capital Advisors Blog

In this type of economic environment, investors should be setting allocations to investment vehicles that answer the questions regarding how they will generate better risk-adjusted returns rather than where they will necessarily find them.