Tuesday, June 30, 2009

Investor Sentiment, Cash and the Market

As noted in some of my prior blog posts, I frequently review various sentiment indicators. At extreme levels, these indicators can highlight turning points in the market. In addition to investor bullish versus bearish sentiment, another indicator gaining quite a bit of attention lately is investor cash levels. I noted in a post over the weekend that money market fund assets remain at a fairly high level.

The American Association of Individual Investors (AAII) surveys its members on a monthly basis regarding investor asset allocation. These investors indicated they had 42% of their investments allocated to cash in December 2008. In the most recent survey (May 2009) investors indicated they had 35% of assets invested in the cash portion of their allocation. AAII's asset allocation survey goes back to 1987 and the average cash level since the survey began is 25%. Investors continue to be overweight cash versus the historical average.

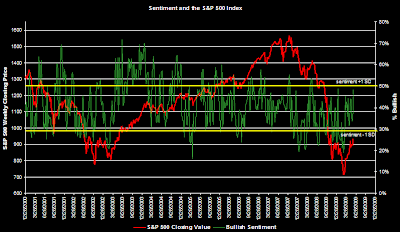
The below chart graphs the cash allocation (red line), the S&P 500 Index (green line) and the 3-period moving average of the Bull/Bear Spread (white line). Given the various sentiment indicators, it does appear investors are still skeptical of the market's current level. From a contrarian perspective then, sentiment would indicate the market could continue to grind higher.

(click to enlarge)

investor cash levels, bull bear spread and S&P 500 Index chart
The sentiment data can be difficult to evaluate. The Technical Take website has a different view of the sentiment data that is worth reading as well.

What is missing in all of the data to this point are truly positive factors and not simply less negative. One potentially positive data point could be company earnings reports in the second half of the year. The market tends to trade on expectations and companies will certainly have an easier time achieving earnings growth compared to the year earlier reported results.

Saturday, June 27, 2009

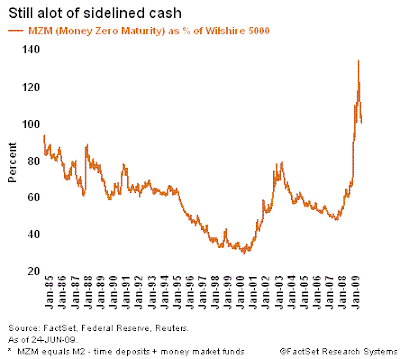
Investor Cash Levels Remain High

Investors continue to hold high levels of cash relative to the value of the market. The below charts graphs cash as a percent of the Wilshire 5000 ($DWC). A part of the increased percentage level of cash can be attributable to the decline in the market's value.

cash levels as percent of stock market value June 24, 2009Source: Charles Schwab & Co.

Interestingly, the increased cash levels are being controlled within institutional money market funds.

Going back to January 2008 the Investment Company Institute reports total cash in money market funds has increased 17.39%. Individual money market fund assets over this same time period are essentially unchanged while institutional money market fund assets are up 28.46%


Thursday, June 25, 2009

Bullish Investor Sentiment Falls To Near March Levels

Today's sentiment survey released by the American Association of Individual Investors saw bullish sentiment fall to 28%. The bull/bear spread came in at -20.80. The 28% level is the lowest since March 12th when the reading was reported at 27.64%. The bearish sentiment level is 48.80% and reached a high of 70.27% for the week of March 5th.


Tuesday, June 23, 2009

Dividend Growers Beyond Just Large Cap Stocks

Standard & Poor's evaluated companies in the S&P 1500 as of June 15, 2009 that had the following characteristics.
  • paid increasing annual cash dividends for the past ten years
  • 2009 estimated coverage and 2010 ratio of at least 2-to-1 (based on street estimates divided by the current 12 month indicated dividend rate)
As S&P notes, and I strongly concur, this is not a buy list, but a starting point for investors who are interested in dividend growth stocks. Undoubtedly, the current economic environment has negatively impacted a number of companies and their dividend practices.


Source:
Standard & Poor's (.xls)


Stock Buybacks At 2003 Level

Preliminary buyback results for the first quarter of 2009 show S&P 500 companies repurchased $30.78 billion of their company's stock. This level of buyback activity was last reached in June of 2003 when companies repurchased $28.36 billion. This June 2003 level marked the low point for buyback activity until the level reached this quarter.

(click to enlarge)

stock buyback and dividend chart March 31, 2009Howard Silverblatt, Senior Index Analyst for Standard & Poor's notes:
"Buybacks are off 82% from their peak during the third quarter of 2007 when S&P 500 companies spent $172 billion on share repurchases.

...a closer look at the data reveals two more telling stories. The first is that Exxon Mobil
represented over a quarter of the buybacks that took place during the first quarter. The second is that 83 of the issues that repurchased shares during the fourth quarter of 2008 did not participate in a stock buyback program during the first quarter of 2009."
Source:

S&P 500 Stock Buybacks Rereat 73% in the First
Quarter; Lowest Since Second Quarter of 2003

Standard & Poor's
By: Howard Silverblatt
June 18, 2009
http://www.mcgraw-hill.com/releases/sandp/20090618.shtml


Saturday, June 20, 2009

Quality Outperforms In Down Market

In an update on the performance of stocks based on their quality ranking, Standard & Poor's shows the higher quality rated stocks outperform in down markets. The short term downside to the outperformance in down markets is the highest quality stocks tend to lag the market when the market moves rapidly higher like the market performance since March 9, 2009.

As the below table notes, for the 12-months ending June 12, 2009, the A+, A and A- rated stocks have far outpaced the stocks rated B+ and lower.

(click to enlarge)

return based on quality ranking June 12, 2009However, year to date in 2009, the lowest rated stocks in the S&P 500 Index have generated the higher return. At the end of the day though, what harms an investor's total return the most is the size of the loss incurred in down markets. Generally, if an investor loses less when the market contracts, they have a better chance of outperforming in the long run due to the fact they have more capital at work when the market recovers.

The below table notes the return an investor needs in order to recover losses at various rates of return.

table % return required based on prior period loss
Source:

A Quest for Quality ($)
Sam Stovall, Chief Investment Strategist
Standard & Poor's, The Outlook
June 24, 2009
http://www.outlook.standardandpoors.com/NASApp/NetAdvantage/i/displayStovallsSectorWatchEditorial.do?&context=IndustryFocus&docId=14325863


Thursday, June 18, 2009

Medtronic Increases Dividend 9%

Medtronic (MDT) announced a 9.33% increase in the company's quarterly dividend. The new quarterly dividend increases to 20.5 cents per share versus 18.75 cents per share in the same quarter last year. The payout ratio increases slightly to 26% based on estimated April 2010 fiscal year end earnings of $3.13. The company's 5-year average payout ratio is approximately 24%. The company maintains an S&P Earnings & Dividend Quality Ranking of A-.

Medtronic dividend analysis table June 2009
Medtronic Stock chart June 2009


Investor Bullish Sentiment Declines

This week's sentiment survey from the American Association of Individual Investors saw bullish sentiment decline to 33.33% versus last week's reading of 39.25%. Additionally, the week before last saw the bullish sentiment come in at 47.56%. In addition to the bullishness level declining, the bull/bear spread is -13% versus +11% two weeks ago.

The sentiment survey is a contrarian indicator, thus the lower the bullishness reading, the more likely the market could move higher if looking at the indicator in a vacuum. The below chart graphs the S&P 500 Index versus the bull/bear spread.

(click to enlarge)


Wednesday, June 17, 2009

Tobin's "q" Remains Below 1.0

Argus Research estimated the "q" value for first quarter 2009 based on flow of funds data from the Federal Reserve. In Q1 the "q" ratio is estimated at .64.

Tobin's 'q' first quarter 2009
Argus notes:
‘Q’ is defined as the ratio of the market value of a firm to the replacement cost of its assets – in this case, we are estimating those figures for the entire industry. According to Nobel Laureate James Tobin, the ratio of total stock market value to the stock market’s net worth (corporate net worth) is a reliable indicator of market valuation. When the stock market trades at a ‘discount’ to the replacement cost of its assets, the market is inexpensive. This discount possesses ‘q’ ratios that are less than 1.0. Conversely, when ‘q’ exceeds 1.0, the market trades at a premium to its replacement cost. The run-up from 1996-2000 had ‘q’ approaching the unthinkable value of 2.0. Encouragingly, the most recent (QI 09) level of 0.64 is the lowest since QII 91 – quite discounted. The long-term average (since 1952) for Tobin’s ‘q’ is 0.75.
Source:

Tobin’s ‘q’ at 0.64 in Q1 ($)
Argus Research
June 16, 2009
http://www.argusresearch.com/


Saturday, June 13, 2009

Recession Longest Since Depression

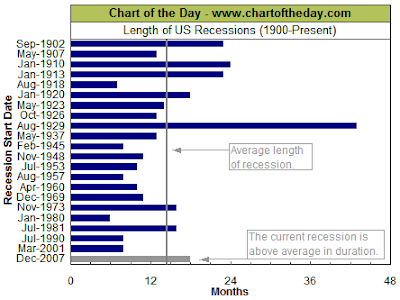
The 18-month duration of this recession is the longest since the depression that began in 1929.


In order to lessen the depth of this recession and to get the economy back on a growth track, effective policies out of Washington are critical. One time stimulus checks to individuals historically do not have a longer term positive economic impact. The reason being consumer behavior remains unchanged since they understand this type of stimulus is a one time payment and not an ongoing benefit to their cash flow.

In January of this year, The Heritage Foundation noted in a report, Economic Recovery: How Best to End the Recession:

Much of official Washington is focused on a big stimulus plan based predominantly on increased spending, possibly including an expanded infrastructure program plus aid to the states and to low-income families. Whatever the merits of these programs on other policy grounds might be, they would not stimulate--and indeed are likely to weaken--the economy in the near term.

The American economy does not rise and fall with the level of aggregate demand or deficit spending. Further, government cannot simply pump up total demand through deficit spending. The deficit for 2009 is already projected to exceed $1 trillion, so if deficit spending were effective, the economy should already be poised to take off.

Yet the economy is contracting despite these unprecedented deficits because government spending in excess of tax revenues will be financed by borrowing from the private sector, which deprives the private sector of a like amount of purchasing power. In short, deficit-financed government spending goes up and private spending goes down, changing the composition of demand but not the total (emphasis added).

Focusing on demand in this way is like focusing on the sound of one hand clapping. The other hand is supply, and that is where the economic action really is. There are normal processes that launch a recovery and drive an economy. These processes involve individuals and businesses responding to opportunities and incentives. When they respond, these individuals and businesses produce more goods and services valued in the marketplace, simultaneously increasing production, demand, and income. An effective stimulus policy recognizes these economic processes and seeks to accelerate them. Lower marginal tax rates stimulate the economy because they improve the incentives facing individuals and businesses to work, invest, take risks, and seize opportunities.

Additionally, policies coming out of Washington that focus on increasing taxes will most certainly extend the length and depth of this recession. As much as health care may need some adjustments, initiating a government program that includes tax increases, will not stimulate economic and/or employment growth. This was tried in the 1929 recession and was a significant factor that pushed that economy into the Great Depression.

Alex Tabarrok at Marginal Revolution notes:
During the Great Depression federal expenditures increased tremendously but so did taxes. Thus, the reason spending was not stimulative was not that spending wasn't tried it's that taxes were also raised to prohibitive levels. But don't take my word for it. Read Cary Brown (JSTOR).
taxes during the depressionSource: Greg Mankiw

So, one important factor policy makers need to keep in mind is stimulative initiatives need to be directed at consumers and these policies must result in a perceived permanent increase in ones income. Simply raising taxes only moves the spending out of the private sector into the public sector with no net increase to economic demand.


Thursday, June 11, 2009

Target Corp. Increases Dividend 6%

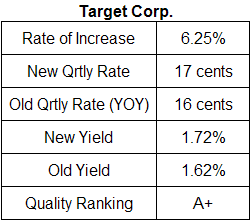
Today Target (TGT) announced a 6.25% increase in the company's quarterly dividend. The new quarterly dividend increases to 17 cents per share versus 16 cents per share in the same period a year ago. The projected dividend payout ratio is 24% based the January 2010 earnings per share estimate of $2.85. This compares to the 5-year average payout ratio of 13%. Lastly, Target carries an S&P Earnings & Dividend Quality Ranking of A+.

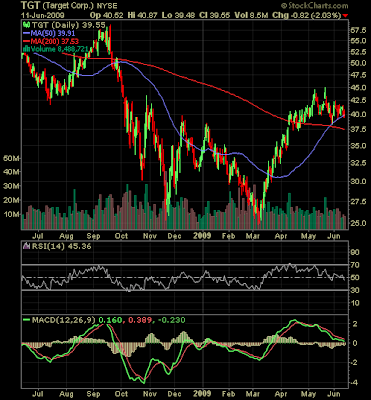
(click to enlarge table/chart)

Target Corp. dividend analysis table June 11, 2009
Target Corp. stock chart June 11, 2009


Sunday, June 07, 2009

S&P Initiates Pan Asia Dividend Aristocrats

About a month and a half ago, S&P announced the introduction of a Pan Asia Dividend Aristocrats Index. A couple of key factors that will be evaluated in constructing the index:
  • The S&P Pan Asia Dividend Aristocrats Index is designed to measure the performance of Asia Pacific companies that have followed a managed dividend policy of consistently increasing dividends every year for at least 7 consecutive years. The index is weighted by dividend yield with caps on single stock concentration.
  • The Aristocrats index had a higher return and lower volatility compared to the S&P Pan Asia BMI over the past 7 years of back-tested history.
  • Index yields have been in the range of 2.8% to 5.1%, about 100 to 150 basis points above the market yield.
  • The S&P Pan Asia Dividend Aristocrats Class of 2009 includes 31 companies across 8 sectors and 7 countries. They have both growth and income characteristics.
The dividend contribution to total return of approximately 30 for the Pan Asia Aristocrats is not too different from the S&P 500 Aristocrats.

dividend income percent total return pan Asia aristocrats index 2009From a sector concentration perspective, consumer discretionary stocks represent 27% of the Pan Asia Aristocrats Index.

pan Asia Aristocrats sector weighting 2009The 31 companies that will initially comprise the Pan Asia Aristocrats universe are:


Source:

Introducing the S&P Pan Asia Dividend Aristocrats (PDF)
Standard & Poor's
By: Liyu Zeng, CFA and Dave Guarino
April 2009
http://www2.standardandpoors.com/spf/pdf/index/SP_Pan_Asia_Aristocrats_White_Paper.pdf


Saturday, June 06, 2009

Evaluating Dividend Sustainability

Below is a table of factors one can use to evaluate the potential sustainability of a company's dividend. These factors should be compared on a trend basis over time as well as compared to the industry in which the company operates.


Source:

Dividend Safety Signs and Warning Flags ($)
American Association of Individual Investors
By: Maria Crawford Scott, Editor, AAII Journal
June 2009
http://www.aaii.com/includes/DisplayArticle.cfm?Article_Id=3728


Thursday, June 04, 2009

Investor Bullish Sentiment Continues Its Trend Higher

Since investor bullish sentiment reached a low of 18.92% for the period ending March 5, 2009, the bullish sentiment level has trended higher to 48.56% this week. During this same time period, the S&P 500 Index has steadily moved higher. The bull/bear spread at the March 5th reading was a -51%. This week's bull/bear spread reading came in at 12%.

(click to enlarge)


Wednesday, June 03, 2009

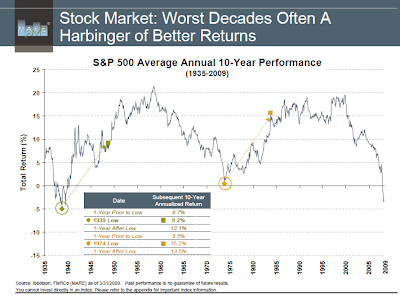
Stock Market Returns Better After Poor Returning Decades

Some will argue the March 9th market low is not the low that will be reached in this bear market cycle. And that could be the case.

(click to enlarge)


However, market returns after decades that resulted in poor returns are generally followed by decades that generate fairly reasonable returns.

(click to enlarge)


The 10-year annualized return for the S&P 500 Index as of April 30, 2009 is -2.48%. Could the subsequent ten year period see better returns then?


Monday, June 01, 2009

Dividend Contribution By Sector For The S&P 500 Index

Probably not much of a surprise, but dividends paid by companies in the financial sector of the S&P 500 Index now account for only 9.08% of the index's total dividends. This is down from nearly 30% for the year ending December 2007. The leading contributor to the index's dividends for the period ending May 29, 2009 is consumer staples. The staples sector accounts for 17% of the index's dividend versus 11.6% for the year ending December 2007.

(click to enlarge)

dividend contribution by sector S&P 500 Index May 2009Source: Standard & Poor's (xls)

For the period ending May 29, 2009, the performance of the dividend payers in the S&P 500 Index continues to lag the performance of the non-payers. The year to date return disparity is significant with the non-payers generating a return of 24.12% versus the payers return of -1.61%.

(click to enlarge)

payers versus non-payers S&P 500 Index May 29, 2009