Sunday, May 31, 2009

Retention Rate Is Important Factor For Dividend Growth Companies

Investing in a company that simply increases it dividend will not ensure an investor that the investment will yield higher returns. One factor to evaluate is the earnings retention rate. Retention rate is the amount of earnings left over after accounting for the dividends paid to shareholders. If a company pays all earnings to shareholders, then the earnings retention would be zero. If a company pays out 70% of its earnings to shareholders, then the company's retention rate would equal 30%.

David Wendell Associates recently published a newsletter noting dividend paying companies with higher retention rates than the S&P 500 Index tend to outperform the index over longer periods of time.
The table below shows the average retention and dividend growth rates over the past ten and five years for a number of companies we have recommended. As can be seen, since 1999 these companies, as a group, had an average retention rate of 17%, or more than four times the average of the S&P 500 for the same period. Their average dividend growth rates for the past five years were also far superior to the S&P 500 -- even taking into account the three companies in the group not paying dividends for the entire period.

(click to enlarge)

retention rate versus dividend growth table May 31, 2009
As can be seen, the retention rate of these companies, as a group, averaged well over four times that of the S&P 500 last year. Their earnings increased an average of 13% last year while the S&P 500’s decreased about 40% amid the carnage of the financial crisis.

These companies even outperformed the S&P 500 over the three years beginning in 2005 -- when the bubble in financial assets began. As a group, their earnings increased at a compound annual rate of 14%, versus the S&P 500 which declined at a compound annual rate of 16%. As a group, their dividends increased at a compound annual rate of 21%, versus the S&P 500 which saw an increase of 9%.

Finally, last year these companies increased their dividends an average of 18% while the S&P 500 saw a dividend increase of only 2%. For the current year-to-date, some of these companies have already announced dividend increases averaging 14%, while Standard & Poor’s is projecting S&P 500 dividends will likely decrease almost 23% this year.
One attractive aspect of investing in dividend growth companies is the investor can gain insight into a company's financial prospects by reviewing financial ratios that might deviate from historical norms because of the desire to maintain a certain dividend growth rate. In the David Wendell Associates article, the firm focuses on retention rate; however, other ratios may deviate from a company's historical norm such as leverage. If a company is borrowing in order to pay an ever increasing dividend, this could be a signal that the company's future earnings may not be as strong as anticipated.

In the end an investor can gain unique insight into a company's financial prospects by evaluating the impact the dividend growth rate has on other key financial ratios like leverage and retention rate.

Source:

Solid and Sustainable: Growth Company Dividends (PDF)
David Wendell Associates
First Quarter, 2009
http://209.62.111.98/~dwendell/images/1q09commonsense.pdf

Market's Recovery Similar To Past Cycles

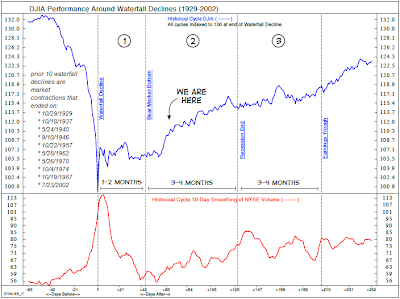
Interestingly, the market's recovery since the March 9th low is following a similar path as 10 prior bear market recoveries. These recoveries occurred after so called waterfall declines.

(click to enlarge)

market waterfall decline chartChart Courtesy of: Schwab & Ned Davis Research

Liz Ann Sonders, Chief Investment Strategist at Charles Schwab (SCHW) notes:
In waterfall declines, the Dow loses more than 20% in a short period, and near the end, the 10-day average of NYSE total volume rises to two times its average seen just a few months earlier. In the majority of cases, the end of the waterfall decline wasn't the end of the bear market.

However, in the composite average, the lows were tested but not broken, followed by a basing phase of up to three months before a breakout to a new bull market. The chart below shows the performance of the Dow as averaged from the 10 waterfall declines between 1929 and 2002.
The market's strong advance is now running into technical resistance. The market's close on Friday at 919 is near the 200-day moving average of 928. Additionally, volume has been declining and the MACD is negative with the 12-day moving average below the 26-day moving average.

(click to enlarge)

S&P 500 Index chart as of May 29, 2009The market seems to be in a phase where "less bad" economic and corporate news is viewed positively. In order for the advance to be more than a cyclical bull market and turn into a secular one, some of this "less bad" data will likely need to become "good" data.


Saturday, May 30, 2009

Stocks With Improved Quality Rankings

Standard & Poor's upgraded the quality ranking on the stocks noted below. S&P's quality ranking looks at a company's growth and stability of earnings and dividends over the past 10 years.

Over the long run, higher quality stocks tend to outperform lower quality ones. In the short run though, lower quality stocks can achieve higher performance. This has been the case so far in 2009.


Source:

Quality Ranking Upgrades ($)
The Outlook
Standard & Poor's
By: Beth Piskora, Managing Editor
June 3, 2009
http://www.outlook.standardandpoors.com/NASApp/NetAdvantage/servlet/login?url=/NASApp/NetAdvantage/index.do


Sunday, May 24, 2009

The Latest In Dividend Research

For investors interested in the latest research on the factors impacting dividend policy for corporations, Harry DeAngela (Marshall School of Business-USC), Linda DeAngela (Marshall School of Business-USC) and Doulas J. Skinner (University of Chicago Booth School of Business), recently published a paper titled, Corporate Payout Policy. In this recent research the authors' have incorporated recent corporate dividend activity and related it back to prior dividend research by Lintner, Miller and Modigliani, Fama and French, just to name a few.

The paper begins with a discussion on the distribution of free cash flow and just a few of the topics reviewed are:
  • Are Dividends Disappearing
  • Why Do Dividends Survive
  • Signaling and the Information Content of Dividends
  • Taxes and Payout Policy
  • The Advantages of Stock Repurchases
As the authors note, the paper is organized:
...around a simple asymmetric information-based theoretical framework that moves beyond MM (1961) to determine optimal payout policy as a time-varying trade-off of the security valuation problems in Myers and Majluf (1984), which encourage retention, versus the agency costs of free cash flow (FCF) in Jensen (1986), which encourage payouts. The latter two path-breaking studies trail only Jensen and Meckling (1976) in terms of their importance to the post-MM (1958, 1961) corporate finance literature; thus, they provide solid building blocks for a theory that can explain the main features of real-world payout policies including, e.g., why payouts become increasingly likely (and retention less so) over the corporate lifecycle. The foundation of this framework is the need to distribute FCF to make investors as well off as possible — a principle that drives optimal payout policies even in the absence of frictions, but whose fundamental importance only became clear with Jensen’s (1986) analysis of the stockholder welfare consequences of managerial failures to distribute full value.
An example of one portion of the research publication is the recent desire of corporations to institute stock buybacks in place of higher dividend payments. The paper notes, historically, companies would payout excess earnings in the form of specially designated dividends (SDDs). The current research suggests many companies now implement stock buyback programs instead of SDDs. In the past these so-called SDDs were counted as dividends.
Finally, Grullon et al. (2008) find that firms’ overall net propensity to distribute cash to stockholders—defined as the fraction of firms with positive net payouts measured as dividends plus stock repurchase payouts minus equity issues — has not in fact declined over the past three decades. Their analysis suggests that the simplest explanation for the secular decline in the incidence of firms that pay dividends is that most firms continue to distribute cash when their earnings and investment opportunities indicate that it is appropriate to do so, but that they now rely increasingly on stock repurchases to deliver those distributions to investors, consistent with the results in Grullon and Michaely (2002) and Skinner (2008). It is still early to accept this explanation as the definitive factor driving the decline in the propensity to pay dividends initially identified by Fama and French (2001), but the explanation does have a strong ring of plausibility to it, especially given the tectonic shift in the population of publicly traded firms toward firms that are currently unprofitable and/or as yet unable to generate positive earnings for stockholders on a consistent basis.
The research paper contains a great deal of useful dividend data that incorporates recent dividend and buyback activity. It is a worthwhile reading for the serious dividend investor.

(H/T: Douglas J. Skinner)

Source:

Corporate Payout Policy
DeAngelo, DeAngelo and Skinner
May 2009
http://ssrn.com/abstract=1400682


Thursday, May 21, 2009

Investor Bullish Sentiment Below Long Term Average

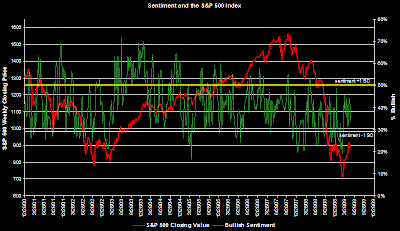
The American Association of Individual Investors reported this week that investor bullish sentiment of 33.72% was below the long term average bullish sentiment level of 39%. This technical indicator is a contrarian one and would point to potentially higher stock gains if looked at on a standalone basis. This week's reading saw a nearly 10 percentage point drop in bullishness from the prior week's level of 43.81%. The bull/bear spread widened to -12% versus last weeks +9% spread.

(click to enlarge)


Sunday, May 17, 2009

Focus On ROE To Avoid Dividend Cuts

One certainty in this market is dividend paying companies are finding it palatable to cut their payout to investors.

graph of number of companies cutting dividendCharles Schwab & Co. (SCHW) recently issued a research report that evaluated a number of different financial factors and found companies that have higher ROE's (return on equity) are less likely to cut their dividend. Schwab reviewed the characteristics of dividend-paying stocks within the top 3,200 stocks by market capitalization, from 1990 through February 2009.

The result of the research noted:
  • A firm with high ROE is more likely to be able to generate income in excess of expenses and, thus, support its dividend.
  • To examine ROE’s ability to predict future dividend changes, SCHW calculated each dividend-paying stock’s trailing 12-month ROE at the end of each month from 1990 to February 2009. They then calculated each stock’s subsequent 12-month change in dividends at the end of each month, and used this change number to split their dividend-paying universe into three groups: those that cut dividends, those that raised them and stocks with no change. Then, they examined the success of ROE in identifying safer dividend payers.
  • What they found was stocks in the lowest 20% of ROE were twice as likely, on average, to cut dividends as the other 80% over the subsequent 12 months, as noted on the below chart.
percent of stocks that cut dividendThey also found that companies with a high ROE had more dividend increases.
  • Stocks in the top 20% of ROE increased dividends, on average, more than 60% of the time during the subsequent 12 months, as the chart below details.
percent of stocks that raised dividendIn the end, the research concluded, "investors could have minimized their risk of experiencing a dividend cut by focusing on dividend payers with higher ROE." They also found the higher ROE dividend payers had higher total returns compared to the dividend paying universe of 3,200 stocks.

Lastly, I recently wrote a post noting how ROE is a component of the dividend discount model (DDM). Although the dividend discount model may seem simplistic, when looking at the variables that are at play in this model, an investor will get a better understanding of the financial factors behind the DDM.

Source:

Are Your Stock Dividends Safe?
Charles Schwab & Co.
By: John Wightkin
April 13, 2009
http://www.schwabinsights.com/2009_04/stocks.html


Dividend Aristocrats Underperforming Broader Market

S&P's Dividend Aristocrats are underperforming the broader market through May 15, 2009. On a market cap weighted basis the Aristocrats are down 5.7% while the S&P 500 Index is down 2.3% and the NASDAQ Index is actually up 6.5%. The Aristocrat stocks are slightly outperforming the Dow Industrial Index, -5.7% versus -5.8%. Year to date financials continue to be a drag on performance.
Dividend Aristocrats


Wednesday, May 13, 2009

Retail Sales Decline Triggers Market Sell Off

Today's April retail sales release seems to be cited as the cause of today's market sell off. I am not sure the .4% decline in April is the only reason for the market pullback. Retail sales were expected to show a .1% increase so the April sales figure did fall short of the estimate.

(click to enlarge)

retail sales April 2009Inventory related data was also released for the period ending in March. Inventory levels declined by almost 1%, but the inventory to sales ratio has remained at 1.44 for the past two months. Sales continue to decline at a faster pace, falling 1.6%.

(click to enlarge)

inventory and sales data March 2009
inventory to sales chart March 2009
I believe the slightly negative results contained in the above two economic data points provided the catalyst for the sell off. As noted in yesterday's post, stocks had advanced in a nearly uninterrupted pace since early March. The market needed to consolidate these recent gains.

(click to enlarge)

S&P 500 Index and percentage of stocks above 50 day moving average May 13, 2009The percentage of stocks trading above their 50 day moving average fell to about 86%. As the above chart indicates. This percentage has been above 90% since late April/early May. Additionally, the MACD has turned slightly negative at -.707 so is the market setting up for a bigger consolidation?

All of the above data points are rear view mirror looking. On a going forward basis what might impact the direction of the market?
  • investors still have large amounts of cash on the sidelines. A large number of these investors will use the pullback to add to equities. The market decline has resulted in investor's equity allocation to fall below target levels; consequently, this pullback could be short lived and a more significant contraction could occur in mid to late summer after the cash has been pulled off the sideline.
It would have been nice to go all in on March 9th, but that activity goes against the emotional side of investor behavior. At this point in the cycle, being selective and focusing on high quality dividend paying stocks for the foundation of ones equity portfolio should pay off in the longer term.


Tuesday, May 12, 2009

At A Turning Point?

On March 9th many investors were glad to be holding sizable cash balances in their investment portfolio when the S&P 500 Index hit an intra day low of 667. Since that time the S&P has moved higher by nearly 36%. Now investors are lamenting the fact they are holding cash that is earning very little interest. Keep in mind, the Fed's goal is to get investors to move out of cash into more risky investments.

We are at the point where the "less bad" news is viewed as good by the market. Appropriately, economic data that is getting less worse is a positive, but data, like unemployment, needs to turn into employment growth. Losing 500,000 jobs is still bad although it isn't as bad as losing 600,000 job like we have seen recently.

Several discouraging pieces of data in the short term are related to consumers. Consumer revolving credit continues to decline. Record job losses are contributing to the credit decline.

consumer revolving credit chart May 7, 2009Source: Federal Reserve Bank & Argus Research

In the long run, reducing consumer debt is a positive as the consumer is too leveraged at the moment. However, short term, reduced consumer spending is a drag on GDP growth since consumer spending has accounted for 70% of GDP growth. So where does economic growth come from?

The level of inventory remains bleak, but additional data will be released on Wednesday regarding inventory levels.

(click to enlarge)

As I have noted in earlier post, once inventory gets down to a low enough level relative to sales, companies will need to produce additional goods. This will stimulate some economic growth.

Lastly, the bull market run has seen a majority of stock prices move higher. The percentage of NYSE stocks that are trading above their 50 day moving average is over 90%.

(click to enlarge)

percentage of NYSE stocks trading above 50 day moving average May 12, 2009
Today's market action saw a rotation into some of the defensive sectors in the S&P 500 Index. The health care sector was up 4.08% and the staples sector increased 3.08%. The economically sensitive sectors saw declines: industrials down 2.46% and technology down 1.64%.

A market correction at this point that consolidates recent gains would certainly be healthy.


Sunday, May 10, 2009

Sell In May? Not After Bear Markets

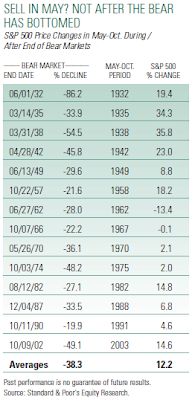
Many investors are familiar with the adage, "sell in May and go away," as superior market returns have been achieved in the November to April period. This adage has not always worked though. Standard & Poor's notes the sell in May approach would have been correct in two out of three years. After bear markets though the May to October period is generally a strong one.

(click to enlarge)

sell in May chart after Bear marketIn investing, few strategies are certain. Given the market's strong advance since early March, consolidating some of the recent gains would be healthy: perhaps a near retesting of some earlier technical lows, like the 50 day moving average around 812.

Source:

Sell in May? ($)
The Outlook
Standard & Poor's
By: Sam Stovall, Chief Investment Strategist
May 13, 2009
http://www.outlook.standardandpoors.com/NASApp/NetAdvantage/servlet/login?url=/NASApp/NetAdvantage/index.do


Wednesday, May 06, 2009

Pepsico Increases Dividend By 6%

Pepsico (PEP) announced a 5.88% increase in the company's third quarter dividend to 45 cents per share. This compares to a quarterly dividend of 42.5 cents per share in the same quarter last year. The rate of dividend increase for the company is declining from the 5-year historical dividend growth rate of 14%.
  • The projected payout ratio based on the new dividend is 44% based on 2010 estimated earnings per share of $4.02.
  • The 5-year average payout ratio is approximately 41%.
  • PEP carries a S&P Earnings and Dividend Quality Ranking of A+.

Pepsico dividend analysis table May 6, 2009
Pepsico stock chart May 6, 2009


Monday, May 04, 2009

Dividend Increases Becoming More Scarce

Standard & Poor's tracks monthly dividend information for more than 30,000 firms and provides dividend detail in their monthly dividend action report. For the period ending April 2009 it is evident that dividends are becoming less sacred for those companies that paid and increased dividends in the past.

The chart data below shows decreased and omitted dividends surged to 480 for the four months ending April 2009 versus 111 for the same period last year. Increases fell to 252 versus 632 for this same time period.

(click to enlarge)

Some of the major dividend actions for April:


Source: Standard & Poor's Dividend Action Report (xls)


Saturday, May 02, 2009

Just A Bear Rally?

Could the market's recent advance simply be one of several bear rallies we can expect to experience in this secular bear market that began in 2000? As the below chart notes, the current rally in the Dow is shorter in duration and magnitude than the average 1929-1932 bear market rally.


It is not uncommon to have these bull runs in secular bear markets. Crestmont Research has a nice table of past secular bear and bull markets that detail the intermediate bull and bear periods within each cycle. Even in bear markets, such as in the bear market of 1966-1981, there were nine positive years that generated an average return of 13%. The entire 16 year period saw the market return -10% from the beginning to the end of the bear period.
Secular Bear Market Table
I noted in an earlier post today that investor cash now exceeds the value of assets invested in equities. So maybe this sideline cash is warranted and won't find its way into equities?


Sideline Cash May Drive Equity Prices Higher

November of last year marked the first year in over 15 that investors had more of their assets allocated to cash than to equity. Not surprisingly this cash is beginning to find its way into the market.
“Most investors have missed the rally” in U.S. stocks, so further gains are likely as they spend some of their cash to buy shares, according to Andrew Garthwaite, a global strategist at Credit Suisse Group.
Garthwaite believes the S&P 500 Index could reach 1,000 before settling at 920 at year end.

(click to enlarge)

cash versus equity chart May 2009
Source:

Catch-Up Buying May Lift S&P 500 as High as 1,000
Bloomberg
By: David Wilson
May 1, 2009
http://www.bloomberg.com/apps/news?pid=20601109&sid=aDP38XCc.mzU&refer=home


Friday, May 01, 2009

Dividend Payers Make Up Ground On S&P 500 Index

For the month of April, the dividend payers in the S&P 500 Index ($INX) generated a return of 17.87% versus the S&P 500 return of 9.57%. The non payers in the index did outperform the payers by generating a return of 20.21%. Over time though, dividend payers are less volatile and tend to have a better risk adjusted return.

Source: Standard & Poor's (xls)