Reviewing the weekly chart for the S&P 500 Index, it appears recent market action resembles the action that occurred in the October through December period late last year. Friday's trading activity/volume will be interesting as it appears the volume for the week could be below earlier up weeks.
(click to enlarge)
 Even reviewing the daily chart, up volume is coming in light. Undoubtedly, there are some technical positives, i.e., favorable MACD and improving relative strength index.
(click to enlarge)

Investors need to keep in mind the market will anticipate a better fundamental economic picture about six months before the economy begins to improve. Given the depth of this contraction, one data figure I am watching is the inventory to sales ratio. Once inventory gets down to a low enough level, manufacturers will need to ramp up production and hopefully hire more employees.
Today's inventory to sales data was somewhat positive on the whole. The inventory to sales ratio came in at 1.43 and was unchanged from December's reading of 1.43. Compared to the January of 2008 inventory/sales ratio of 1.25, it is evident inventories remain elevated though.
Today's inventory to sales data was somewhat positive on the whole. The inventory to sales ratio came in at 1.43 and was unchanged from December's reading of 1.43. Compared to the January of 2008 inventory/sales ratio of 1.25, it is evident inventories remain elevated though.
(click to enlarge)
 The U.S. Census Bureau announced today,
- the combined value of distributive trade sales and manufacturers’ shipments for January, adjusted for seasonal and trading-day differences but not for price changes, was estimated at $1,004.0 billion, down 1.0 percent from December 2008 and down 14.0 percent from January 2008.
- Manufacturers’ and trade inventories, adjusted for seasonal variations but not for price changes, were estimated at an end-of-month level of $1,440.1 billion, down 1.1 percent from December 2008 and down 1.5 percent from January 2008.
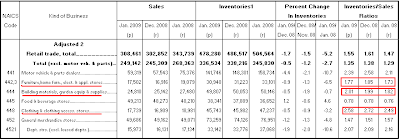
Sales continue to contract at a more rapid rate than inventories. The data for the discretionary consumer items has not improved as well.
(click to enlarge)
 Although inventories have been reduced on a sequential and year over year basis, sales continue to decline at a more rapid rate.
I believe this consumer oriented data is worth watching closely in order to provide a sign that improvement in the economy is taking hold. Given positive market performance, the consumer's sentiment can turn more positive fairly quickly. As noted in an earlier post, The President Should Pay Attention To The Market--It Does Matter, consumer sentiment is somewhat impacted by the direction of the stock market.

1 comment :
>Once inventory gets down to a low enough level, manufacturers will need to ramp up production and hopefully hire more employees.
Or cut capacity even further if sales continue to drop.
Post a Comment