Interestingly, market bubbles seem to follow a similar pattern. The below chart graphically displays the bubbles in technology and housing. Additionally, the ascent in oil is overlayed on the chart.
(click on chart for larger image)
 According to a recent strategy article from Schwab (SCHW) strategist, Brad Sorensen, CFA, there are two common themes prevalent in the creation of these bubbles:
- relatively easy money
- innovation
The above two factors are certainly present today. The air was let out of the bubbles when:
- liquidity that had fueled the bubbles disappeared
- monetary conditions tightened
- economies deteriorated
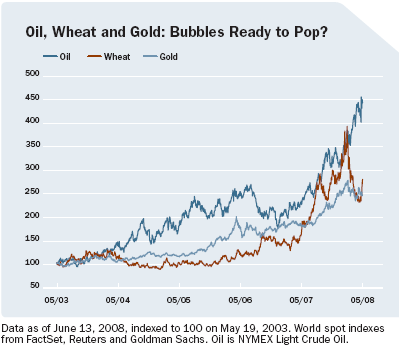
As the below chart shows, more than oil may be entering bubble territory.
(click on chart for larger image)
 One can cite fundamental reasons for the increase in commodity prices. The Schwab article, Bubble Trouble, covers a few of these fundamental factors. On the other hand, history does have a tendency to repeat itself.
Source:
Bubble Trouble
Charles Schwab & Co., Inc.
By: Brad Sorensen, CFA
June 24, 2008
http://www.schwab.com/public/schwab/research_strategies/market_insight/todays_market/recent_commentary/bubble_trouble.html

No comments :
Post a Comment