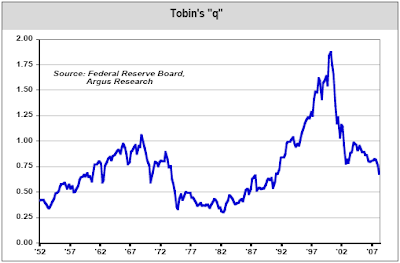
Tobin's q ratio was originally formulated by Yale University professor James Tobin. James Tobin is a Nobel laureate in economics. The theory behind the ratio is the combined market value of companies on the stock market should be equal to the replacement cost of company assets.

According to a recent report from Argus Research, the current value of Tobin's q equals .68.
(click on chart for larger image)
When the stock market trades at a ‘discount’ to its replacement cost, the market is inexpensive, or cheaper to buy than build. This discount possesses ‘q’ ratios that are less than 1.0. When “q” exceeds 1.0, the market trades at a premium. The run-up from 1996-2000 had ‘q’ approaching the unthinkable value of 2.0. Encouragingly, the most recent (1Q08) level of 0.68 implies a reasonable valuation of market conditions. The long-term average for Tobin’s ‘q’ is 0.75.
What are the implications with "q" values greater than or less than 1.0,? According to the website, Money Terms,
An investor should not rely on one single variable when determining valuations, but this does provide insight into one perspective on market valuation.
Source:A Tobin's Q of more than one means that the market value of assets (as reflected in share prices) is greater than their replacement cost. This means it is likely that capex will create wealth for shareholders. This means companies should increase capex, raising more money to do so if necessary, but should not make acquisitions. This should reduce share prices and increase asset prices, pushing Q towards one.
A Tobin's Q of less than one suggests that the market value of the assets is less than replacement cost, making acquisitions cheaper than capex; buying cheaper than setting up from scratch. This should increase share prices and reduce asset prices, again pushing Q towards one.
Tobin's q at .68 in Q1 ($)
Argus Research
June 10, 2008
http://www.argusresearch.com/


No comments :
Post a Comment