Monday, June 30, 2008

Aristocrats Performance Through June 30, 2008

Below is the estimated performance for the Dividend Aristocrats for the first six months of the year. The Aristocrats did manage to out perform the Dow Jones Industrial Average and the NASDAQ Composite Index; however, the Aristocrats slightly under performed the S&P 500 Index.

dividend aristocrats year to date performance summary June 30, 2008Not surprisingly, the financial sector was a major contributor to the weak performance this year. The only financial stock in the top ten is Aflac (AFL). As the below spreadsheet shows, most of the banks fall in the bottom third of the table from a year to date performance perspective. The full spreadsheet can be seen at this link.


Sunday, June 29, 2008

The Debut Of The Dividend And Value Network

It is with great pleasure that I, and the collective membership announce the debut of The Dividend Investing and Value Network (DIV-Net). Disciplined Approach to Investing is proud to be a charter member of this new investing network focusing on dividend investing, value investing and a long-term buy and hold philosophy.

The authors of The DIV-Net want this new network to be the premier destination for readers interested in a variety of investing topics, stock analysis, and perspectives that might otherwise be found fragmented across the web. The DIV-Net is a unique network providing exclusive, original, and unpublished content daily from a growing network containing the best authors in the field. Seven Core Members are responsible for maintaining and administering The DIV-Net site and the DIV-Net network.

Our Core Members include:
Here at DIV-Net we believe strongly in the virtues of our dividend investing, value investing and a long-term buy & hold philosophy and we'll not limit DIV-Net to just seven Core Members. In our aim to include as many bloggers interested in our core focus we created an Associate Membership. Associate Members are eligible to submit original unpublished articles to The DIV-Net, access to use DIV-Net's content on their site, participate in the aggregated feed and a site listing on The DIV-Net's Associates page.

Our Associate Members include:
In addition, DIV-Net sponsors a weekly carnival titled "Investing Carnival." The carnival's focus is on Value Investing, Dividend Investing and Long-term Buy-and-Hold Investing, as well as categories for real estate, commodities and other alternative investments. We welcome your relevant articles. To participate please submit your article here no later than 5:00 PM ET each Sunday. The Carnival will post every Tuesday. If you are interested in hosting, please e-mail dividendgrowthinvestor [AT] gmail [DOT] com.

At The DIV-Net we are dedicated to providing the best independent and original dividend, value, and a buy-and-hold investing content available on the web. We strive to bring these views together in one community focused on the highest quality membership of authors available. It is our hope that publishing, reading, following, and participating in The DIV-Net will pay long-term dividends for all involved.

Join us at The DIV-Net, and see what all the excitement is about!


Saturday, June 28, 2008

The Beat Continues At Medtronic

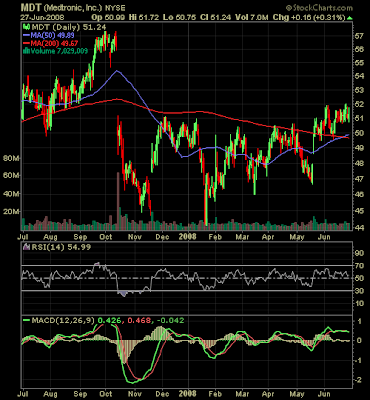
Earlier this week, Medtronic (MDT) announced a 50% increase in the company's quarterly dividend. The new quarterly dividend increases to 18.75 cents per share versus 12.50 cents per share in the same quarter last year. The estimated payout ratio is 25% based on April 2009 estimated earnings per share of $2.98. The 5-year average payout ratio is 18%. Could this rate of increase be an indication of stronger earnings going forward? The company maintains an S&P Quality Ranking of A-.

(click on table/chart for larger image)

medtronic dividend analysis table June 2008
medtronic stock chart June 2008


Market Bubbles: Technology, Housing, now Oil?

Interestingly, market bubbles seem to follow a similar pattern. The below chart graphically displays the bubbles in technology and housing. Additionally, the ascent in oil is overlayed on the chart.

(click on chart for larger image)


chart of technology housing and oil bubblesAccording to a recent strategy article from Schwab (SCHW) strategist, Brad Sorensen, CFA, there are two common themes prevalent in the creation of these bubbles:
  1. relatively easy money
  2. innovation
The above two factors are certainly present today. The air was let out of the bubbles when:
  1. liquidity that had fueled the bubbles disappeared
  2. monetary conditions tightened
  3. economies deteriorated
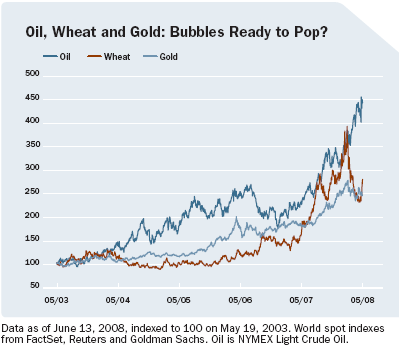
As the below chart shows, more than oil may be entering bubble territory.

(click on chart for larger image)

chart of oil, wheat and goldOne can cite fundamental reasons for the increase in commodity prices. The Schwab article, Bubble Trouble, covers a few of these fundamental factors. On the other hand, history does have a tendency to repeat itself.

Source:

Bubble Trouble
Charles Schwab & Co., Inc.
By: Brad Sorensen, CFA
June 24, 2008
http://www.schwab.com/public/schwab/research_strategies/market_insight/todays_market/recent_commentary/bubble_trouble.html


Thursday, June 26, 2008

Is The Glass Half Full Or Half Empty?

AG Lafley, chairman and chief executive of Procter & Gamble (PG), in an article in today's Financial Times, essentially warns the presidential candidates not to worsen the economic environment with overly pessimistic rhetoric. In the article Mr. Lafley notes,
...he was concerned by the "woe is me and ain't it awful" rhetoric adopted by Hillary Clinton and Mr Obama during their fierce battle for the Democrat nomination.

He stated, "In my business we don't need excessive negativism," said Mr Lafley. "You know we are in a business where psychology matters - even in the staples business - and in the economy psychology matters. It could go negative on the economy, that could be a problem . . . We will talk ourselves into a worse recession."
It is human nature to have ones perspective shaped by past events. I wrote an earlier post on this titled, Psychological Bias: Keep In Perspective. However, don't get down on the market and the economy based on old/historical news or data. Sticking with an investment discipline that allows one to uncover attractively priced investment opportunities will likely result in positive investment returns in the long run.

Source:

P&G chief urges US presidential candidates to end gloom rhetoric

Financial Times
By: Elizabeth Rigby and Jonathan Birchall
June 26, 2008
http://www.ft.com/cms/s/0/ce0fd162-4317-11dd-81d0-0000779fd2ac.html?nclick_check=1


Best Buy Increases Dividend 40%

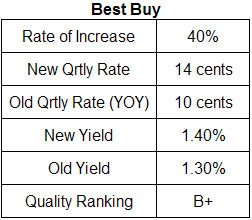
Yesterday Best Buy (BBY) announced a 40% increase in the company's quarterly dividend. The new quarterly dividend increases to 14 cents versus 10 cents in the same period last year. On a sequential basis the dividend increases 7.7% versus the 13 cent quarterly dividend in the prior quarter. The projected payout ratio is approximately 17% based on February 2009 estimated earnings per share of $3.31. The 5-year average payout ratio equals 19%. BBY has an S&P Quality Ranking of B+.

(click on table/chart for larger image)

Best Buy dividend analysis table June 26, 2008
Best Buy stock chart dated June 27, 2008


Tuesday, June 24, 2008

BB&T Corp. And Duke Energy Announce Dividend Increases

BB&T Corp. (BBT) and Duke Energy (DUK) both announced dividend increases today.

BBT increased its quarterly dividend to 47 cents per share versus 46 cents per share in the same quarter last year. This represents a year over year increase of 2.17%. The estimated dividend payout increases to 64% based on 2008 estimated earnings of $2.95. The 5-year historical payout ratio is approximately 54%. BBT carries an S&P Quality Ranking of A-

DUK increased its quarterly dividend to 23 cents per share versus 22 cents per share in the same quarter last year. The year over year dividend increase is 4.55%. The estimated dividend payout is approximately 72% based on 2008 estimated earnings of $1.28. DUK carries an S&P Quality Ranking of B.

(click on table/charts for larger image)

BB&T and Duke Energy dividend analysis June 23, 2008
BB&T stock chart June 23, 2008
Duke Energy stock chart June 23, 2008


Monday, June 23, 2008

Financials Bear Brunt Of Dividend Decreases

In an ongoing dividend data report maintained by Standard & Poor's, they detail dividend actions by sector. Not surprisingly, the negative dividend actions have been centered in the financial sector. The below spreadsheet shows that 17 out of the 20 negative dividend announcements through June 18, 2008 were from financial firms. The entire spreadsheet can be found at this link.


The one misleading consumer staples dividend decrease reported in the above table is Altria's (MO) dividend reduction. Altria reduced its dividend simultaneously with the spin off of Phillip Morris International (PM). However, the combined PM and MO dividend equals the old MO dividend.

Data Source: Standard & Poor's (Excel file)


Sunday, June 22, 2008

Dividend Aristocrats Performance As Of June 20, 2008

Standard & Poor's Dividend Aristocrats have managed to outperform the Dow Jones Industrial Average Index and the S&P 500 Index through June 20th this year. The price weighted returns are detailed in the below spreadsheet. The spreadsheet also contains other stock related detail, for example, dividend rate, payout ratio, etc. The full spreadsheet can be seen at this link.


On a year to date basis, the Aristocrats have achieved a return of -9.7% versus -10.2% for the S&P 500 Index and -10.7% for the Dow Jones Industrial Average Index. The Nasdaq Index has managed to outperform the Aristocrats by 40 basis points.


Saturday, June 21, 2008

Market Downtrend Remains In Place

The downtrend in the S&P 500 Index seems to remain firmly in place. This downward move in the market has occurred on increasingly higher volumes as well.

(click on chart for larger image)

s&p 500 index chart analysis June 20, 2008
Based on the percentage of stocks trading above their 50 day and 200 day moving averages, extreme oversold levels have not been reached. However, given the strong pullback this past week, a positive bounce in the interim could be realized next week.

(click on chart for larger image)

percentage of S&P 500 stocks trading above 50 day and 200 day moving average June 20, 2008
Lastly, Bespoke Investment Group provided commentary earlier this week on the high level of short interest on the NYSE. Bespoke makes the point in their short interest commentary that this contrary indicator has been less reliable and why. It is worth reading Bespoke's short interest post.

(click on chart for larger image)

NYSE short interest June 20, 2008


Thursday, June 19, 2008

Small Improvement In Investor Sentiment

Today's release of the American Association of Individual Investors' sentiment survey indicates bullish sentiment improved slightly. The bullishness level increased to 32.98% versus last week's reading of 31.25%. A larger improvement was reported in the bearishness level at 45.74% versus last week's level of 53.57%. The end result was a narrowing of the bull/bear spread to -13% versus -22% last week.

(click on graph for larger image)


Wednesday, June 18, 2008

Buybacks And Dividends On The Decline In First Quarter 2008

Today, Standard & Poor's reported dividend and buyback activity for the first quarter of 2008 for the S&P 500 Index. Although buybacks continue at a rate exceeding $100 billion and dividends exceed $60 billion, the buyback and dividend trend is not positive.

One critical aspect of a dividend growth investment discipline is to look at the change in the dividend growth rate of a particular company. For those knowledgeable in calculus, it is the second derivative that is important. Although the growth rate may be positive, the rate may be lower than the prior period. This means the rate of change (second derivative) is negative. If the dividend growth rate is slowing, is this a precursor to slowing earnings growth? A number of factors other than the dividend growth rate are important criteria to review, e.g., payout ratio, dividend yield, etc, but the slowing rate of dividend growth is certainly a yellow flag.

Getting back to the S&P 500 Index buyback and dividend detail for the first quarter of 2008, although difficult to tell, the YOY dividend growth rate is slowing, i. e., the second derivative is negative. Additionally, the below chart notes the sequential dividend and buyback total for the first quarter is lower than in the 4th quarter of 2007.

(click on chart for larger image)


This could be a signal that earnings growth for the S&P 500 Index is set to turn negative at some point in the near future? The 1st quarter of 2008 represents the second quarter in a row that the level of buybacks has declined. The decline in the dividend total is the first decline since a decline was recorded in the 1st quarter of 2006.

Source:

S&P 500 Stock Buybacks Retreat in Q1 But Remain Strong (pdf)
Standard & Poor's
By: David Guarino & Howard Silverblatt
http://www2.standardandpoors.com/portal/site/sp/en/us/page.article/2,3,2,2,1204837108299.html


Tuesday, June 17, 2008

The Dow Dogs Are Truly Dogs This Year

The Dow Dogs are getting off to a doggish start in 2008. The Dogs of the Dow are the ten highest yielding stocks in the Dow Jones Industrial Average on December 31st of the prior year. The ten Dow Dogs for 2008 are detailed below, along with their year to date performance through June 17, 2008. The Dow Dogs are down 15.7% while the Dow Jones Industrial Average is down 10.5%

It should be noted that Dow Jones removed Altria (MO) and Honeywell (HON) on February 19, 2008. The two replacements were Bank America (BAC) and Chevron (CVX).

(click on table for larger image)


Monday, June 16, 2008

Financial Stocks' Price To Book Ratio Sees Further Decline

The price to book ratio for the S&P 500 financial sector is down to 1.2 versus a price to book of 1.3 in March earlier this year. Argus Research notes:
The S&P 500 Financials index is close to the bottom reached in March 2003, coincidentally about the same time that the broader S&P 500 hit its own bear market low. This time, however, the S&P 500 is less than 15% from its 2007 peak while the Financials are down by nearly 40%. Probably more revealing is that the Financials index now trades for just 1.2-times reported book value, the lowest level since the last major credit crisis in the early 1990’s. At these levels, we’d be ready to sound the ‘all-clear’ signal if not for the fact that we believe that analysts as a group are still too optimistic about bank earnings over the next few quarters. Our 2008 estimates are below the consensus for many of the banks that we follow. We expect a busy second-quarter pre-announcement period for the banks over the next few weeks which may start to finally dampen expectations for 2008.
(click on chart for larger image)

S&P 500 financial sector price to book ratio June 16, 2008

Source:

Financials: Where’s the Bottom? ($)
Argus Research Company
June 16, 2008
http://www.argusresearch.com/


Sunday, June 15, 2008

Stocks At Risk Of Removal In S&P 500 Index/Dividend Aristocrats Index

One criteria Standard & Poor's uses in considering a stock for inclusion in the Dividend Aristocrats Index is the stock must be a member of the S&P 500 Index. Recent stocks removed from the S&P 500 Index have been stocks with a market capitalization below $5 billion dollars.

Two recent changes to the S&P 500 Index involve the removal of Brunswick (BC) and OfficeMax (OMX). These two companies are being replaced by Cabot Oil & Gas (COG) and Massey Energy (MEE) at the close of trading on June 20, 2008.

(click on table for larger image)

Cabot Oil & Gas and Massey Energy added to S&P 500 Index June 20, 2008Source: Standard & Poor's (pdf)

Existing stocks in the S&P 500 Index that have a market cap below $5 billion are detailed in the below table. Stocks highlighted in red are current dividend aristocrats. The two stocks that are in bold are upcoming removals. It should be noted that changes to the Aristocrats Index do not occur until December of each year.


The S&P Midcap 400 Index contains several stocks with market capitalizations far above $5 billion:
  • Peabody Energy (BTU) with a market cap of $21.1billon
  • Precision Castparts (PCP) with a market cap of $14.4 billion
  • Cognizant Technology Solutions (CTSH) with a market cap of $10.3 billion


Could The Market React Differently This Time?

I am always skeptical when market strategists state things are different this time around. In the run up to the technology bubble in early 2000, many market strategists tried to justify higher P/Es due to the growth of the internet. Until 18-months ago, the rapid inflation in real estate prices was partly supported by strategists citing the growth of the baby boomers and their desire to purchase second homes.

In a recent market commentary, New Paradigm Ahead?, by Liz Ann Sounders, Schwab's (SCHW) Chief Investment Strategist, Liz Ann makes a case for higher U.S. equity prices. She details sixteen events that may occur that may lead up to a better U.S. equity market:
  • U.S. economy slows dramatically (check)
  • U.S. Fed cuts interest rates dramatically (check)
  • Dollar sinks further (check)
  • Commodity prices go parabolic (check)
  • Speculative hoarding of commodities ensues (check)
  • Regulators and Congress rev up the anti-speculation rhetoric (check)
  • Commodity-hungry emerging economies suffer (check)
  • Global growth suffers, including noticeably in China (check)
  • Investors shift funds from international stocks to commodities (check)
  • Non-U.S. central banks consider rate cuts to fight growth slowdown (pending?)
  • U.S. Fed enters pause mode (could be there already)
  • Rate differentials support dollar rally (fledgling rally so far)
  • Commodity prices begin to correct (fledgling correction so far)
  • Commodities move from U.S. economic headwind to tailwind (pending?)
  • Lower commodities/inflation supports U.S. valuation expansion (pending?)
  • Investors shift from international stocks/commodities to U.S. stocks (pending?)
In the above list, Liz Ann has "checked" the events that have occurred to date.

I am always skeptical of the "it is different this time" belief; however, could the above events lead to higher equity prices?

Source:

New Paradigm Ahead?
Charles Schwab & Company
By Liz Ann Sounders, Chief Investment Strategist
May 16, 2008
http://www.schwab.com/public/schwab/research_strategies/market_insight/todays_market/recent_commentary/new_paradigm_ahead.html?cmsid=P-2603064&lvl1=research_strategies&lvl2=market_insight&refid=P-2413636&refpid=P-994224


Saturday, June 14, 2008

Using The PEG Ratio To Find Value

The PEG Ratio is often referred to as the P/E to Growth Rate measure. P/E is a company's price per share divided by earnings per share. The growth rate can by a company's 1 or 3 year compound annual earnings per share growth rate. The lower a company's PEG ratio the cheaper the stock relative to the company's earnings growth.
  • P/E = Price Per Share/Earnings Per Share
  • PEG Ratio = (P/E)/Earnings Per Share Growth Rate
The importance of comparing PEGs across different stocks is the PEG enables an investor to uncover stocks that may trade at relatively high P/Es because the company's earnings are expected to grow at a faster rate than maybe a lower P/E stock. An example in the below spreadsheet is CSX Corp. (CSX) that trades at a P/E of 21.3 with an earnings growth rate of 24% (PEG = .87) versus Entergy (ETR) that trades at a P/E of 19.8 with an earnings growth rate of 14% (PEG = 1.45).


One must evaluate a company's PEG relative to the company's historical PEG ranges as well as evaluate the PEGs across industries. Some stocks may generally trade at higher P/Es relative to their growth rate due to the long term stability of that company's earnings. Also, a company may trade at a lower PEG due to the market anticipating negative earnings news from the company. A good example of this is Textron (TXT). Textron trades at a 1.2 PEG; however, after the close Friday, Textron announced in an SEC filing that top end earnings would be lower due to issues at the company's finance unit. The stock traded down 5% in Friday's after hours session.

As noted in my earlier post on using Enterprise Value As A Starting Point For Finding Bargain Stocks, no one single metric should be used when determining the appropriateness of a specific investment. Nonetheless, the PEG ratio is another variable an investor can use when screen ing for stocks.

In conclusion, it is useful to use several variables in one's stock screening exercise. I have found Microsoft's (MSFT) Money site contains a fairly advanced stock screen tool. The screening tool works best in Internet Explorer.


The Herd Dumps Financials

For a dividend focused investor financial stocks are frequently present in dividend growth stock screens. However, the last 12-18 months have seen financial stocks as a difficult investment choice due to real estate/commercial related loan losses. Additionally, the once steady financial dividend growers have resorted to cutting or eliminating dividends in an effort to preserve precious capital.

Yesterday, in the first 30 minutes of market trading, the stock market action in financials was nothing short amazing. Near the end of the trading day there was speculation that the trading was driven by several rumors (which I will not repeat) which fueled the selling/shorting of the financial sector.

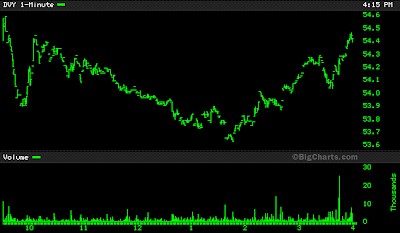
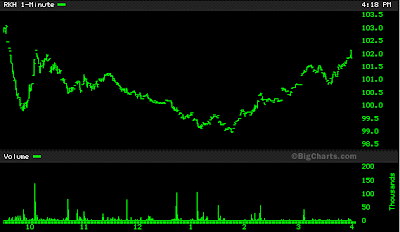
As the below charts depict, the daily market action for a large number of financial stocks and financial focused indexes looks exactly the same: a sharp sell off in early trading and a slow recovery by the end of the day.

(click on charts for larger image)

BB&T stock chart June 13, 2008MI stock chart June 13, 2008PNC stock chart June 13, 2008WFC stock chart June 13, 2008DVY stock chart June 13, 2008RKH stock chart June 13, 2008GE stock chart June 13, 2008
The last chart is that of General Electric (GE). I included GE's chart since more than 50% of the company's earnings are derived from GE Capital. It appears investors sold GE in the morning as well.

The take away for investors in all of this is to remember to focus on company fundamentals when making investment decisions. Do not get caught up in the herd mentality that often infects the market.


Friday, June 13, 2008

Market Remains In A Downtrend

From a technical standpoint the NYSE Index remains in a downtrend channel.

(click on chart for larger image)

NYSE Index chart June 13, 2008
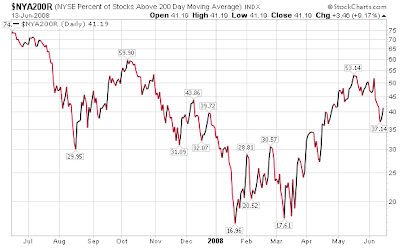
The percentage of NYSE stocks trading above their 50 day and 200 day moving averages have declined from their highs in mid May; however, the percentages do not appear to have reached oversold levels.

(click on charts for larger image)

percentage of NYSE stocks trading above 50 day moving average chart June 13, 2008
percentage of NYSE stocks trading above 200 day moving average chart June 13, 2008


Investor Bullish Sentiment Swings Lower

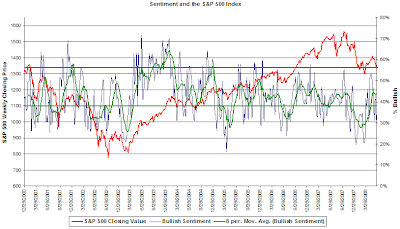
This week's sentiment survey from the American Association of Individual Investors reported a sharp decline in bullish investor sentiment. The individual investor bullishness level came in at 31.25% versus the prior week's level of 43.48%. Additionally, the bull/bear spread was reported at -22% versus last week's reading of +5%. The S&P 500 Index closed at 1,335 on the day prior to the report. Since the reports release, the S&P 500 Index is up 24.5 points or 1.8%.

(click on graph for larger image)


Thursday, June 12, 2008

Enterprise Value As A Starting Point For Finding Bargain Stocks

The American Association of Individual Investors website contains a number of useful predefined stock screens. The most recent issue of the American Association of Individual Investors' AAII Journal contained an article covering one of the screens that can be used as a starting point to finding 'out of favor stocks.' The focus of the article is to use enterprise value to EBITDA as a starting point for screening for bargain stocks. The article notes:
...The enterprise value is calculated by adding market capitalization, preferred stock, and total debt and reducing this total by the amount of cash held by the firm. Debt and preferred stock is added because the acquirer must shoulder the cost of assuming the obligations of the firm. Cash is subtracted because once you acquire the firm, it becomes yours. The enterprise value to EBITDA ratio relates a firm’s takeover cost to its earnings potential. The lower the ratio, the more attractive the firm...
Below is a list of 11 of the 30 companies AAII uncovered in the screen.


Source:

Using Enterprise Value to Locate Bargains ($)
AAII Journal
By: John Bajkowski, AAII Vice President, Sr. Financial Analyst
June 2008
http://www.aaii.com/includes/DisplayArticle.cfm?Article_Id=3443


Tuesday, June 10, 2008

Tobin's q

Tobin's q ratio was originally formulated by Yale University professor James Tobin. James Tobin is a Nobel laureate in economics. The theory behind the ratio is the combined market value of companies on the stock market should be equal to the replacement cost of company assets.

Tobin's q formula
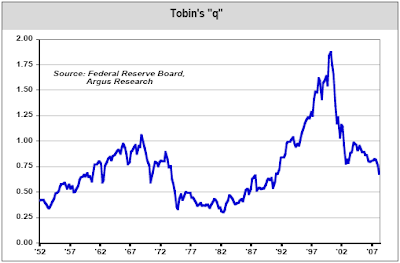
According to a recent report from Argus Research, the current value of Tobin's q equals .68.

(click on chart for larger image)

Tobin's q chart June 10, 2008According to Argus Research,
When the stock market trades at a ‘discount’ to its replacement cost, the market is inexpensive, or cheaper to buy than build. This discount possesses ‘q’ ratios that are less than 1.0. When “q” exceeds 1.0, the market trades at a premium. The run-up from 1996-2000 had ‘q’ approaching the unthinkable value of 2.0. Encouragingly, the most recent (1Q08) level of 0.68 implies a reasonable valuation of market conditions. The long-term average for Tobin’s ‘q’ is 0.75.
What are the implications with "q" values greater than or less than 1.0,? According to the website, Money Terms,
A Tobin's Q of more than one means that the market value of assets (as reflected in share prices) is greater than their replacement cost. This means it is likely that capex will create wealth for shareholders. This means companies should increase capex, raising more money to do so if necessary, but should not make acquisitions. This should reduce share prices and increase asset prices, pushing Q towards one.

A Tobin's Q of less than one suggests that the market value of the assets is less than replacement cost, making acquisitions cheaper than capex; buying cheaper than setting up from scratch. This should increase share prices and reduce asset prices, again pushing Q towards one.
An investor should not rely on one single variable when determining valuations, but this does provide insight into one perspective on market valuation.

Source:

Tobin's q at .68 in Q1 ($)
Argus Research
June 10, 2008
http://www.argusresearch.com/


Sunday, June 08, 2008

Election Year Market Return: Don't Sell In May?

An often repeated stock market mantra is to "sell in May and go away." One often forgotten fact is historically the market has performed differently in presidential election years.

A recent chart by Chart of the Day details the performance of the Dow Jones Industrial Average in election years.


With the 2008 presidential campaign now in full swing, today's chart illustrates how the stock market has performed during the average election year. Whether the average election year is measured from 1980 or 1900, the market has tended to struggle during the first five months of an election year. That initial subpar performance was then followed with a rally (on average) right up to the November election. One theory to support this election year stock market behavior is that the first five months of choppiness is due in part to the uncertainty of the outcome of the presidential election (the market abhors uncertainty) with the market beginning to rally as the outcome of the election becomes increasingly evident.


Saturday, June 07, 2008

Dividend Payers Underperform Non-Payers In May

In May the dividend paying stocks in the S&P 500 Index underperformed the non-payers, 1.90% versus 4.75% respectively. However, over the course of the trailing 12-months, the dividend payers have managed to maintain a slight performance edge over their non dividend paying counterparts, -10.56% versus -11.07%.

dividend payers versus non-payers performance May 2008
With respect to dividend increases and decreases, Standard & Poor's notes (pdf):
  • Year-to-date, there have been 17 Financials reductions in dividend rates compared to 12 for 2002 through 2007.
  • For the month, 27 issues increased, 0 initiated, 2 decreased and 0 suspended, versus 25 increases, 1 initiation, 0 decreases, 0 suspensions for the same period in 2007.
  • Year-to-date increases are down 144 versus 155 issues in 2007, with decreases up 19 versus.


The Risk In Hedging Energy Exposure

One concern being discussed by investment strategist and business news commentators is the thought that the sharp rise in many energy stocks is being driven by investor speculation. If individual investors want to protect against a potential sharp drop in their energy holdings, they can hedge the exposure via investment products like the Proshares UltraShort Oil & Gas (DUG) exchange traded fund. The UltraShort Oil & Gas Proshare seeks:
daily investment results, before fees and expenses, that correspond to twice (200%) the inverse (opposite) of the daily performance of the Dow Jones U.S. Oil & Gas IndexSM.
Yesterday, crude oil futures increased $10.75. This was the the largest, single-day price gain ever. Oil prices closed at a new record high of $138.54 per barrel, surpassing the May 21st record of $133.17. With this sharp spike in crude oil futures, one would think the UltraShort Oil & Gas Proshare would have declined. In fact, DUG actually rose 2.47%!

The lesson in this example is one should be aware of the underlying components in these types of indexes. The four largest positions in the Dow Jones Oil & Gas Index (DJUSEN) are:

Dow Jones Oil & Energy Index top four holdingsAs detailed in the above table, the four largest holdings in the Dow Jones Oil & Gas Index all declined on Friday. Additionally, these four holdings account for 49.34% of the overall index. So, if oil prices decline will the the UltraShort Oil & Gas Proshare rise?

In conclusion, if an investor is looking to hedge any position or sector within their overall account, understanding the components of the hedging product is vitally important.

(Disclosure: I hold a position in the Dow Jones Oil & Gas Proshare)


Investor Bullish Sentiment Rises

Earlier this week, the American Association of Individual Investors reported investor bullish sentiment rose to 43.48%. This compares to the prior week's bullishness reading of 31.36%. The bull/bear spread was reported at +5% versus last week's -14%.

(click on chart for larger image)

investor bullish sentiment chart June 4, 2008


Wednesday, June 04, 2008

Ambac Financial Dropped From S&P 500 Index

Standard & Poor's announced Ambac Financial (ABK) will be removed from the S&P 500 Index after the close of trading on June 10th. Ambac will be replaced by Lorillard. According to S&P:

Lorillard is being distributed to the public via a two-tier process involving 1) the retirement of the tracking stock Carolina Group (NYSE:CG), in exchange for which approximately 62% of Lorillard’s common stock will be issued, and 2) an offer in which shares of S&P 500 constituent Loews Corp. (NYSE:LTR) can be exchanged for the remaining shares of Lorillard. As of today’s close of trading Ambac’s market capitalization was roughly $860 million, ranking 500th in the index.
Lorillard is a producer and seller of cigarettes, under brand names including Newport, Kent, True, Maverick and Old Gold.

(click on charts for larger image)

Carolina Group and Ambak Financial stock chart June 4, 2008