Monday, April 28, 2008

Harley Davidson Increases Dividend 10%

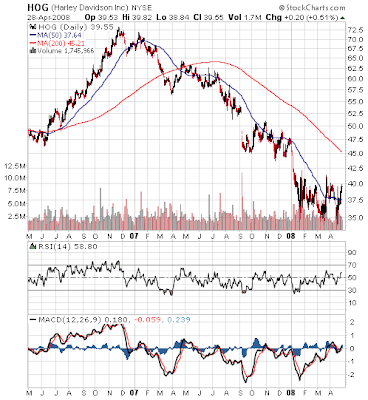
Harley Davidson (HOG) announced a 10% increase in its quarterly cash dividend to 33 cents per share versus 30 cents in the same quarter last year. In spite of this double digit increase, the company is seeing softness in the number of motorcycle units sold. In an announcement earlier this month, HOG stated it would close plants and layoff employees. The goal is to reduce motorcycle shipments by at least 23,000 units.

The estimated 2008 payout ratio is 43% based on 2008 estimated earnings of $3.07. This earnings estimate is down 20% from 2007 earnings of $3.75. The 5-year average payout ratio is 18%. The company carries an S&P Quality Ranking of A+. According to MarketWatch though, Standard and Poor's may downgrade HOG's "A" credit rating due to softer demand for the company's bikes.

(click on table/chart for larger image)

Harley Davidson dividend analysis table April 28, 2008
Harley Davidson stock chart April 28, 2008


U.S. Supreme Court Deliberating Since November On Kentucky v. Davis

The U.S. Supreme Court has been deliberating the Commonwealth of Kentucky v. Davis municipal bond case since November. Joe Mysak of Bloomberg notes, "the longer the court considers the matter, the more possibility there is of mischief. Sometimes the judges rule not only on the subject at hand, but on other things, too." He also indicates the ruling could be a surprise to the municipal bond market since it is not on many radars at the moment.
"You would think a Supreme Court ruling that has the potential to overturn the status quo and remake the mutual-fund business would have everyone in the market talking. It's a sign of the trouble brewing in this market that Kentucky v. Davis, the case before the court, is barely on the radar.

"If the judges decide that states don't have the right to discriminate against out-of-state bonds, why would anyone want to keep their money in the almost 500 single-state bond funds? That's just for starters.

The longer the court deliberates, the knottier the ruling may be. I am waiting for one of those very special 'this, but also this' rulings that keep bond lawyers guessing for weeks."
Detail on the opinion, when released, can be found
The uncertainly surrounding this bond ruling may be one reason municipal bonds are yielding nearly the same as Treasuries. Additional stories about this case can be found at the following blog posts on this site:

Source:

Court Case Is Lost in Cauldron of Muni Market Woes
Bloomberg
By: Joe Mysak
April 15, 2008
http://www.bloomberg.com/apps/news?pid=newsarchive&sid=aVR9JW.PVXiU


Thursday, April 24, 2008

Johnson & Johnson Increases Dividend 10.8%

Today, Johnson & Johnson (JNJ) announced the company is raising the quarterly dividend 10.84%. The new quarterly dividend equals 46 cents per share versus 41.5 cents per share in the same quarter last year. The company's 5-year dividend growth rate is approximately 10%. The payout ratio will equal 41% based on 2008 estimated earnings of $4.45. The earnings estimate was raised by the company in its recent quarterly earnings release to a range of $4.40-$4.45. The 5-year average payout ratio totals approximately 40%. The company has an S&P Quality Ranking of A+.

(click on table/chart for larger image)

Johnson & Johnson dividend analysis table April 24, 2008
Johnson & Johnson stock chart April 24, 2008


Bullish Investor Sentiment Increases This Week

AAII Sentiment SurveyI suppose it should not be too surprising that investor bullish sentiment rose this week after last week's decline. Since the end of March, the bullish sentiment level has alternated between an increase and a decline. This week's bullishness level was reported at 46.67% versus the prior week's level of 30.37%. True to form the bull/bear spread came in at a +19% versus -18% last week. Recent results attest to the volatility of this sentiment indicator.

Below is a table a graph of historical sentiment results.

(click on table/chart for larger image)

American Association of Individual Investors Sentiment Survey Table. April 24, 2008


Wednesday, April 23, 2008

Marshall & Ilsley Increases Dividend 3.2%

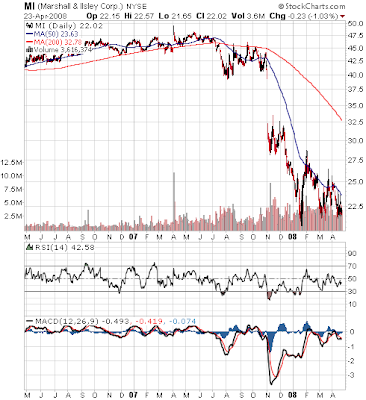
Marshall & Ilsley (MI) announced a 3.23% increases in its quarterly cash dividend. The new quarterly dividend increases to 32 cents per share versus 31 cents per share in the same quarter last year. This increase is far below the 5-year historical dividend growth rate of 11% for MI. Additionally, the projected payout ratio, based on estimated 2008 earnings of $1.90, increases to 67% compared to the 5-year average payout ratio of 37%. The company has a S&P Quality Ranking of A.

(click on table/chart for larger image)

Marshall & Ilsley dividend analysis table April 23, 2008
Marshall & Ilsley stock chart April 23, 2008


Sunday, April 20, 2008

Altria: Dividend Impact With Spin Off Of Phillip Morris International

At end of March, Altria Group (MO) spun off Phillip Morris International. For each share of Altria, shareholders received one share in Phillip Morris International (PM). Additionally, the dividend for Altria was adjusted as PMI will begin paying a dividend equal to the adjustment. The Altria/Phillip Morris International spin-off news release notes:
"Altria reaffirmed its intention to adjust its current dividend so that following the distribution of shares of Philip Morris International to Altria stockholders, those stockholders who retain their Altria Group, Inc. and PM shares will receive, in the aggregate, the same dividend dollars as before the distribution of PM shares on March 28, 2008. Following the distribution, PM's initial annualized dividend rate will be $1.84 per common share and Altria Group, Inc.'s initial annualized dividend rate will be $1.16 per common share. All decisions regarding future dividends will be made independently by the Altria Group, Inc. Board of Directors and the PM Board of Directors, for their respective companies. Additional information regarding the Phillip Morris International/Altria Group spin-off is available at http://www.altria.com/investors/2_2_1_pmispinoff.asp"


Market Approaching Short Term Overbought Level, But Not On Long Term Basis

In looking at the percentage of stocks on the NYSE trading above their 50-day moving average, it appears the index is approaching a short term overbought level.

(click on chart for larger image)

NYSE Index. Percent of stocks trading above 50 day moving average as of April 18 2008However, the percentage of stocks trading above their 200-day moving average level (approximately 40%) remains below an overbought level.

(click on chart for larger image)

NYSE Index. Percent of stocks trading above 200 day moving average as of April 18, 2008The NYSE Index appears to have broken through resistance of 9292.89. This was the index's closing value on February 27th. The index closed at 9310.24 on Friday. At issue will be whether or not this level turns into a support level for the index.

(click on charts for larger image)

NYSE Index. six month chart as of April1, 2008
NYSE Index. three year chart as of April 18, 2008


Thursday, April 17, 2008

Investor Sentiment: Indecision

The American Association of Individual Investors reported a significant decline in bullish investor sentiment this week. The investor bullish sentiment level fell to 30.37% versus last week's reading of 45.76%. The offset was an increase in bearish sentiment to 48.69% versus 37.29% last week. The bull/bear spread equaled -18% versus +8% last week. Interestingly, we have seen the S&P 500 Index trend higher by about 1% on the week.

As noted in my prior post on Tuesday, The Market May Be Setting Itself Up For An Extended Move Higher, I get the sense the market is wanting to move higher given high investor cash levels, high levels of negative news flow and respectable earnings outside the financial sector. Google's (GOOG) earnings report tonight may add fuel to the fire on Friday. In after hours trading Google is up $76.46 or 17% from the early close today. Companies in all but the financial sector appear to be reporting respectable earnings for the first quarter, with a few exceptions like General Electric (GE). GE's miss was attributable to the company's financial business though.

(click on chart for larger image)


Tuesday, April 15, 2008

The Market May Be Setting Itself Up For Extended Move Higher

The negative news sentiment seems to increase on a daily basis. Where the news media once talked about a "possible recession", the media begins most of their economic statements by stating the economy is in a recession. The negative aspects of the economy seem to be growing:
  • higher energy prices
  • high agricultural prices
  • high commodity prices
  • high real estate foreclosure rate
  • unemployment trending higher
and I could list others as well.

This negative news flow has certainly had an impact on investors. A March 2008 report by the IMF notes that investors report near record levels of risk aversion as detailed below.

(click on charts for larger image)


The Investment Company Institute (ICI) reports record levels of cash in money market funds too. As of April 9th, ICI reports money market assets total a record $3.5 trillion. This represents a 44% increase over cash balances a year earlier. So what is the so called "smart money" doing?

In a post I wrote a few weeks ago, The Commodities Stampede: Is the Smart Money Heading for the Exit?, commercial traders have record level short positions in commodities. According to a Bloomberg report, Larry Fink, of Blackrock, is telling investors to add more risk. Blackrock is advising investors to buy riskier assets such as bank loans, mortgages and high-yield debt. Some of the data Blackrock is likely reviewing is the near record spreads in high yield debt.

Source: Bespoke Investment Group

When high yield spreads begin to narrow, the return on high yield investments should increase due to an increase in high yield bond prices. If the historical correlation holds, stocks would move higher as high yield bonds have a positive correlation of .50 to the S&P 500 Index.

In the end, an investor needs to focus prospectively on where the high yield and stock market may be headed. Looking forward takes on the additional risk that ones forecast may not unfold immediately. To minimize this risk, averaging into the chosen asset classes may be appropriate.

Note: The IMF report was originally highlighted by Barry Ritholtz of The Big Picture website.

Source:

Global Financial Stability Report
International Monetary Fund
April 2008
http://www.imf.org/external/pubs/ft/gfsr/2008/01/index.htm

High Yield Spreads
Bespoke Investment Group
March 4, 2008
http://bespokeinvest.typepad.com/bespoke/2008/03/high-yield-spre.html

Cash on the Sidelines
Business Standard
By: John Authors
April 10, 2008
http://www.business-standard.com/ft/storypage_ft.php?&autono=319526


Monday, April 14, 2008

Wachovia Cuts Dividend 41%

Wachovia (WB) begins to address its real estate and loan problems. Today the company announced it was cutting its quarterly dividend by 41.4% to 37.5 cents per share versus 64 cents per share in the prior quarter. The interesting question is whether other financial firms will follow suit. The company's current S&P Quality Ranking is B+. Additionally, the company announced:
  • it is seeking a $7 billion cash injection to make up for a poorly timed expansion of its mortgage business.
  • it took write-downs of $2 billion during the quarter related to the credit crunch.
  • it set aside $2.8 billion to cover problem loans, up from $1.5 billion in the fourth quarter.
(click on chart for larger image)


Sunday, April 13, 2008

Focus On The Long Term

An important factor many investors understand is investing in stocks is a long term commitment. The primary reason for a long term time horizon when investing in stocks is the volatility stocks can exhibit over the course of any single year.

The chart below details the annual returns of the S&P 500 Index since 1926. Many investors expect returns from stocks to average around 10%. In fact that is the average return when going back to 1926. Interestingly, since 1926, the S&P 500 Index has returned between 8%-10% in only four years.

(click on chart for larger image)

annual returns S&P 500 Index 1926-2007 graphic
Also evident from the chart is the fact that the S&P 500 Index has more positive years than negative. The other important fact to be aware of is missing just a few of the big up days in the market can significantly reduce ones returns. The below chart shows what an investor's returns would be if they missed a few of those big up days in the market since 1987.

(click on chart for larger image)
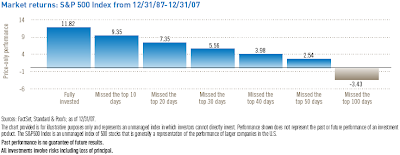
chart if one misses biggest up days in the market
As the above chart depicts, if an investor missed just 40 of the biggest up days in the market over the last 20 years, their return would have totaled 3.98% versus remaining fully invested and achieving a average annualized return of 11.82%.

In the end, investing in stocks is something one should consider if they have a long term time perspective. Since market timing is difficult to implement successfully, if one misses the big up days in the market that tends to occur, returns will be far below the long term average.

Source:
The Rewards of Long-Term Investing
Legg Mason
2008
http://www.leggmason.com/individualinvestors/education/index.aspx


Thursday, April 10, 2008

Bullish Investor Sentiment Continues To Trend Higher

The American Association of Individual Investors sentiment survey reported an increase in individual investor's bullish sentiment this week. The bullish sentiment level increased to 45.76% versus 36.70% last week. Most of the increase came at the expense of investors who had reported a neutral bias last week. The neutral investor reading declined to 16.95% from last week's level of 23.94%. The bull/bear spread widened to a +8% versus last week's -3%.

(click on chart for larger image)


Tuesday, April 08, 2008

Dividend History Matters

Approximately 7,000 publicly traded companies report dividend information to Standard & Poor's Dividend Record. S&P reports 598 of those companies increased their dividend in the first quarter of 2008. This is a 19.2% decline versus the 740 companies that increased their dividend in the first quarter of 2007. S&P noted in a recent press release that 83 companies decreased dividend payments in the first quarter versus 19 in the same quarter last year.

Howard Silverblatt, Senior Index Analyst at S&P notes:
  • "...larger-cap issues (market value greater than $10 billion) that pay dividends have increased their rate 27.2% of the time versus just 18.7% for lower-cap issues (those under $10 billion)."
  • "Issues that have increased their rate for ten years straight simply cannot just stop raising it; the increase is expected and built into the price of the stock. Conversely, those companies that have increased their dividend every few years have the option of not increasing it as the expectation is not built into the company profile."
Source:
Double Hit: Corporate Dividend Growth Deteriorates as Decreases Surge
Standard & Poor's
By: Howard Silverblatt & David R. Guarino
April 3, 2008
http://www2.standardandpoors.com/portal/site/sp/en/us/page.article/2,3,2,2,1148434843833.html


Stock Buybacks In 2007 Were At A High Level But On The Decline

Standard & Poor's reported stock buybacks were at a fairly high level in 2007. Total buybacks for the year equaled an estimated $589 billion. This compares to total buybacks in 2006 of $432 billion.
  • reported earnings of $68.53 billion represented a declined of 62% versus $181.65 billion reported in 2006.
  • dividends in the quarter increased 8.6% to $67.1 billion dollars versus $61.8 billion recorded in the fourth quarter of 2006.
In S&P's buyback press release it was noted there has been a shift in which sector is leading in the buyback activity.
"Financial issues continue to pull back on buybacks, accounting for just 13.4% of the aggregate repurchases during the fourth quarter of 2007 compared to 22.3% during the fourth quarter of 2006," adds Howard Silverblatt. "Information Technology remained the prime player in the buyback market, with 22.5% of the buybacks, partially due to their use of options to supplement employee salaries."

(click on chart for larger image)

stock buyback chart December 31, 2007
Source:
S&P 500 Buybacks Set Record of $589 Billion in 2007
Standard & Poor's
By: Howard Silverblatt & David R. Guarino
April 7, 2008
http://www2.standardandpoors.com/portal/site/sp/en/us/page.article/2,3,2,2,1148434843833.html


Friday, April 04, 2008

Best Buy Increases Earnings Per Share While Net Income Declines?

Earlier this week Best Buy (BBY) reported an increase in earnings per share, while at the same time, reported net income actually declined. In the company's earnings release they reported a significant level of stock buyback activity. For the year the company repurchased 75.6 million shares of stock or nearly 16% of the shares outstanding. The cost of the buyback to the company was an estimated $3.5 billion dollars.

As an investor one needs to ask if this level of buyback is an indication by the company/board of future business prospects. If the company had committed to paying a higher dividend on an ongoing basis, this could have been viewed more positively. A higher dividend payment might be an indication the company sees sustainable earnings growth out into the future. The buyback is a one time activity; thus, not committing the company to higher cash outflow going forward. Therefore, are there clues in the financial reports that might indicate a slowing in the business?

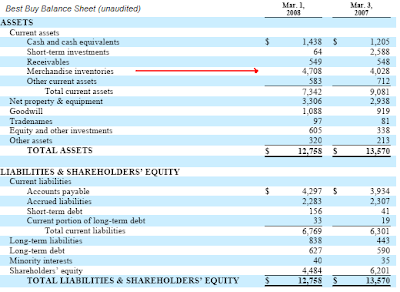
The company has yet to file its 10-K, but they plan on filing by the end of April. One can look at some of the financial information included in the 8-K to get a sense for the business activity. One piece of information to note is merchandise inventory saw an increase of almost 17% as noted below. This rate of increase compares to an increase in revenue of 4% when comparing the quarter ending 3/1/2008 to the same quarter last year. It should be noted that the 4th quarter included one less week than last year. Adjusting for this difference, revenue would have increased 9%. So, is inventory at a higher level than the company anticipated due to sales not meeting the company's expectations? Also, will this inventory need to be cleared out of stores at lower selling prices; thus impacting future margins and earnings? The company does note in the 8-K that it has seen a shift in customers' desire for higher ticket items like gaming systems.

(click on table for larger image)

Best Buy balance sheet March 2008
Best Buy Income Statement March 2008
Best Buy is the premier electronic retailer, but these items are worth watching.


Thursday, April 03, 2008

The Sentiment Rollercoaster: Bullish Investor Sentiment Declines

Another week and another result in the ever volatile investor sentiment survey from the American Association of Individual Investors. Individual investor bullish sentiment declined to 36.7% versus last week's 41.6%. The decline in bullish sentiment was to the benefit of the bearish investors. The bearish sentiment indicator increased to 39.4% versus the prior week reading of 33.6%. The bull/bear spread declined to a negative 3% from a positive 8% last week.

(click on graph for larger image)


Tuesday, April 01, 2008

Dividend Payers Make Up Ground Versus Non Payers In March

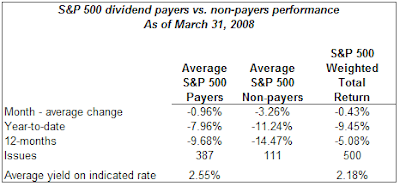
In March the dividend paying stocks in the S&P 500 Index out performed the non-payers, -.96% versus -3.26%, respectively. On a year to date basis the payers also out performed the non-payers, -7.96% versus -11.24%, respectively. In the first three months of the year, the payers also out performed the S&P 500 Index as a whole.

(click on table for larger image)


TJX Companies, Inc. Increases Dividend 22%

Today, TJX Companies, Inc. (TJX) announced a 22.22% increase in its quarterly cash dividend. The new dividend increases to 11 cents per share versus 9 cents per share in the same quarter last year. The projected payout ratio increases to 20% based on estimated January 2009 earnings per share of $2.22. This compares to the 5-year historical average payout of 13%. The company carries a S&P Quality Ranking of A+.

(click on table/chart for larger image)

TJX Cos. dividend analysis table April 1, 2008
TJX Companies stock chart April 1, 2008