Sunday, March 30, 2008

Dividend Aristocrats Performance as of March 28, 2008

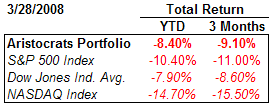
The first quarter of 2008 still has one trading day remaining; however, Standard and Poor's Dividend Aristocrats have held up fairly well on a relative basis. The U.S. domestic index that has out performed the Aristocrats is the Dow Jones Industrial Average (DJIA). The DJIA has achieved a year to date return of -7.9% versus the Aristocrats year to date return of -8.4% as of March 28, 2008. The Aristocrats have out performed the NASDAQ and the S&P 500 indices though. The return summary and individual performance of each Aristocrat is detailed below.

(click on tables for larger image)

dividend aristocrat performance summary March 28, 2008
individual performance dividend aristocrats March 28, 2008


Saturday, March 29, 2008

The Commodities Stampede: Is the Smart Money Heading for the Exit

As one can see by looking at the 3-year commodity charts below, commodity prices have been rising at a steep rate. As an investor, one should ask, are the increases occurring due to fundamental factors like demand or are prices rising due to speculation? Maybe it is less speculation and more the fact that individual investors are jumping on board this train near the tail end of the commodity price boom. One can't easily predict if the end of the commodity boom will turn out like the end of the technology boom that began in 2000. On the other hand, investors should be knowledgeable of the bets of the so called smart money.

(click on charts for larger image)

gold, crb and ag commodity charts March 29, 2008
The Barron's issue that was released today has a story titled, Commodities: Who's Behind the Boom? ($). The article notes:
"...Thanks to the proliferation of mutual funds and exchange-traded funds tied to commodities indexes, speculative buying has gone way beyond anything the domestic commodities markets have ever seen. By one estimate, index funds right now account for 40% of all bullish bets on commodities. The speculative juices are even more plentiful -- nearly 60% of bullish positions -- if you count the bets placed by traditional commodity "pools."

Here's the problem: The speculators' bullishness may be way overdone, in the process lifting prices far above fair value. If the speculators were to follow the commercial players -- the farmers, the food processors, the energy producers and others who trade daily in the physical commodities -- they'd be heading for the exits. For right now, the commercial players are betting on price declines more heavily than ever before, says independent analyst Steve Briese.

For example, in the 17 commodities that make up the Continuous Commodity Index, net short positions by the commercials have been running more than 30% higher than their previous net-short record, in March 2004.
It seems commodity speculators are betting that prices will wane. The below chart details the historically high short positions of the commercial traders. In the end, over valuation alone may not burst this apparent bubble, but an investor needs to know prices may be ahead of fundamental demand.

(click on chart for larger image)

commodity short position chart. March 29, 2008
Source:
Commodities: Who's Behind the Boom? ($)
Barron's
By: Gene Epstein
March 31, 2008
http://online.barrons.com/article/SB120674485506173053.html?mod=9_0002_b_this_weeks_magazine_home_top


Thursday, March 27, 2008

The Market and Elections

In a recent article by Liz Ann Sonders of Charles Schwab (SCHW) titled Election Economics, she notes interesting stock market patterns over the course of an election cycle. She provides the following caution though:

"Is the election becoming a bigger factor for the stock market? From the perspective of investors and Wall Street, does it matter who wins in November? I strongly believe that the economic atmosphere is more the context in which the president maneuvers and less the outcome of the president’s actions. As such, I feel there is some risk in overstating the impact of the election on stock market returns. And making investment decisions based on anticipated election results is a dicey strategy—one which we wouldn’t recommend."
Also noted in her analysis is the fact,
  • It’s rare when a sitting president is not eligible for re-election. During the past 60 years, that’s occurred only three times—after the two-term presidencies of Dwight D. Eisenhower in 1960, Ronald Reagan in 1988 and Bill Clinton in 2000. Interestingly, stock market returns were subpar during those three years, averaging a slight loss, while bonds fared much better (sound familiar?).
  • This is also the first time in over 50 years that neither a sitting president nor vice president is in the race for the nomination.
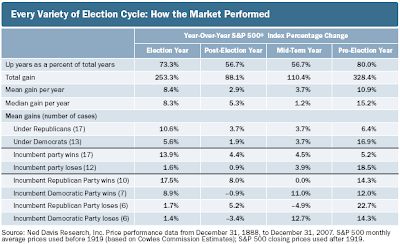
As noted in the chart below, the market does tend to struggle during the first half of an election year. The second half tends to see the market rally.

(click on chart for larger image)

stock market election cycle chart
A more detailed look at market performance is contained in the below table.

(click on table for larger image)

election cycle breakdown by party
Source:
Election Economics
Investing Insights
Charles Schwab & Co., Inc.
By: Liz Ann Sonders
March 20, 2008
http://www.schwab.com/public/schwab/research_strategies/market_insight/todays_market/recent_commentary/
election_economics.html?cmsid=P-2491582&lvl1=research_strategies&lvl2=market_insight&refid=P-2187533&refpid=P-994220


Investor Bullish Sentiment Leaps Higher

The American Association of Individual Investors sentiment survey released today shows a jump in bullish sentiment to 41.60% versus last week's bullishness level of 25.21%. The bull/bear spread came in at a +8% versus last week's spread of -29%. Recall the sentiment indicator is a contrarian one.

(click on chart for larger image)


Sunday, March 23, 2008

Are Your Investment And Deposit Assets Safe?

With the recent difficulties surrounding Bear Stearns (BSC) and anticipated acquisition by JP Morgan Chase (JPM), investors have inquired about the safety of their investment assets. There is a notable difference between assets held by banks, bank trust departments and security firms.

BusinessWeek recently ran an article, What if your Broker Goes Belly Up?, describing the nuances of security firm deposits and the interaction of the Securities Investor Protection Corp. (SIPC). The article answers the question about asset safety if a brokerage firm fails:
Unless a broker has run off with your assets, the securities you own will be available, even if the firm files for bankruptcy. Your biggest worry becomes how long it will take to get your money, but that's only a cause for concern if the back-office operations of the firm are in disarray. In the event of a financial crisis, an organization known as the Securities Investor Protection Corp. (SIPC) will step in to make sure that customer accounts are transferred to a financially sound institution. That's what happened when Cincinnati-based Donahue Securities collapsed in 2001.
Additionally, the article notes there has been some confusion about SIPC's specific role:
SIPC steps in to cover losses only when assets disappear due to wrongful conduct, such as misappropriation, by the broker. In that case, SIPC covers losses up to $500,000 per account. (Only $100,000 may be in cash.) Most brokerage firms carry excess coverage for losses above this amount. You won't be covered for losses due to a drop in security prices.
The American Bankers Association recently released an article about the difference between deposit, trust, fiduciary and custodial accounts. The article, Are My Trust, Fiduciary and Custody Assets Safe?, explains the difference between deposit accounts, trust and fiduciary accounts, and custodial accounts if a bank does fail.
Since deposit accounts become liabilities of the bank, it follows that the depositor would become a creditor in the event a bank failed. However, the FDIC insures depositors for up to $100,000 per individual per bank.

Since assets held in trust, fiduciary and custodial accounts do not become liabilities of the bank (title is held by the account's owner(s)), it follows that none of this property is subject to the claims of the bank's creditors. As a result, a failure of a bank will have no adverse effect on trust, fiduciary or custodial accounts: they remain the property of the account's owner(s).


Source:
What If Your Broker Goes Belly Up?
BusinessWeek
By: Lauren Young
March 20, 2008
http://www.businessweek.com/magazine/content/08_13/b4077086438962.htm?

Are My Trust, Fiduciary and Custody Assets Safe?
American Bankers Association
By: Carol Kaplan
March 20, 2008
http://www.aba.com/Press+Room/032008AssetSafety.htm


Saturday, March 22, 2008

S&P Upgrades Five Stocks to A+

Over the past four months, Standard and Poor's upgraded five stocks to A+. The stocks affected are:

(click on table for larger image)

Standard & Poor's stocks upgraded to A+ March 2008S&P notes:
"In the eight years since the bursting of the technology bubble in March 2000, high-quality stocks (as measured by a proprietary Standard & Poor’s system) have outperformed lower-quality issues. In the last 96 months, high-quality stocks have put up an average monthly gain of 0.4%, while lower-quality issues have gained only 0.3%.

Standard & Poor’s has provided Quality Rankings for stocks since 1956. For performance measurements, S&P considers any stock with a Quality Ranking of A- or above to be high quality."
Source:
Top-Quality Stocks ($)
The Outlook
Standard and Poor's
March 26, 2008
http://sandp.ecnext.com/coms2/page_outlook


Historical Perspective on Financials Price to Book Ratio

Argus Research recently detailed the price to book ratio for the S&P Financials Index. The chart graphs the P/B ratio over the past 30-years. Argus notes:
"...The index now trades at about 1.3-times its reported book value, down from more than 2-times just last year and more than 3-times when the tech bubble burst several years ago. Granted, this credit cycle is different, and book value is difficult to measure because banks are still holding enormous amounts of difficult-to-value securities on their books. Financial stock bears note that once goodwill and other intangibles are removed from banks’ reported equity, their so-called “tangible” book values are much lower. As a result, these banks are still somewhat pricey on the basis of price to tangible book value. We remain cautious about major banks that still face losses on actual mortgage assets, not just on securities. But we think that the stocks of the major securities firms are looking attractive for those with a tolerance for risk. We believe that the Fed’s move to open the discount window to these companies, along with its decision to accept nonagency mortgage-backed securities as collateral in exchange for Treasuries, should calm the trading markets with time."
(click on chart for larger image)

S&P Financials Index Price to Book thirty year history chart
Source:
Are Financials Nearing a Bottom? ($)
Argus Research
March 20, 2008
http://www.argusresearch.com/


Thursday, March 20, 2008

Investor Bullish Sentiment Ticks Higher

Yesterday the American Association of Individual Investors reported an improvement in investor bullish sentiment. The bullish sentiment level increased to 25.21% versus the prior week's level of 20.42%. However, the 8-period moving average remained unchanged at 29.1%. The bull/bear spread narrowed to -29% versus last week's -39%.

(click on chart for larger image)


Saturday, March 15, 2008

Hedge Funds: What Are They?

I great deal of the market weakness experienced recently is being attributed to the difficulty experienced with hedge fund investments. I have received questions asking what are hedge funds and ran across the below video on the website Hedge Fund.


A recent article in BusinessWeek magazine, Hedge Funds Frozen Shut, discusses some of the recent difficulties experienced by hedge funds as well. Another good source for hedge fund information is the website noted above, Hedge Fund.


Friday, March 14, 2008

Gold: The Chart Says It All

The Chart of the Day notes:

"Gold has been in a strong bull market since 2001 and picked up the pace in mid-2005 and then again in mid-2007. In fact, gold has gone parabolic and today briefly crossed the $1000 per ounce level for the first time. Today's chart illustrates how the price of gold has nearly quadrupled during its seven year bull market."
The chart axes is plotted in a logarithmic scale; thus the tick marks are spaced by percentage. If a logarithmic scale were not used, the graph increase would appear even more dramatic. How much higher can gold move?


(click on chart for larger image)


Another interesting graphic is the Dow/Gold relationship. Additional discussion can be found at my post titled: Dow/Gold Ratio: What The Ratio Might Be Projecting


Thursday, March 13, 2008

Another Decline In Investor Bullish Sentiment

This week the American Association of Individual Investors reported a further decline in individual investor bullish sentiment. The level of bullishness declined to 20.42% versus last week's 21.98% bullishness level. The bull/bear spread also widened to -39% from -30% last week.

(click on graph for larger image)


Friday, March 07, 2008

Significant Decline in Investor Bullish Sentiment

This week the American Association of Individual Investors reported a sharp decline in investor's bullish sentiment. The bullishness level fell to 21.98% versus last week's 34.31%. The bull/bear spread widened to -30% versus last week's -11%. The sentiment indicator is a contrarian one as individual investors tend to be the least bullish at market bottoms.

(click on graph for larger image)


Wednesday, March 05, 2008

Dividend Payers Underperform In February

The dividend paying stocks in the S&P 500 Index underperformed the non-payers in the index in February. The dividend payers returned -3.12% while the non-payers returned -2.42%. However, on a 12-month basis, the payers outperformed the non-payers, -8.32% versus -10.53%, respectively.

(click on table for larger image)

dividend payers versus non payers performance February 29, 2008